Constructing Valid Geospatial Tools for Environmental Justice (2024)
Chapter: Summary
Summary
President Biden’s Executive Order (EO) 14008 (Tackling the Climate Crisis at Home and Abroad) established the Justice40 Initiative, which sets a goal that disadvantaged communities reap 40 percent of federal investment benefits in the areas of clean energy and energy efficiency, clean transit, affordable and sustainable housing, training and workforce development, legacy pollution, and clean water infrastructure. EO 14008 directed the White House Council on Environmental Quality (CEQ) to create a geospatial tool to identify the communities across the United States and its territories eligible for Justice40 investment benefits. The Climate and Economic Justice Screening Tool (CEJST)1 was developed in 2022 in response.
Mapping and geographical information systems have been crucial for analyzing the environmental burdens of marginalized communities since the 1980s, and several federal and state geospatial tools have emerged to address a variety of environmental justice (EJ) concerns. These include the Environmental Protection Agency’s EJScreen2 and California’s CalEnviroScreen.3 CEJST is the first tool of this type developed at the federal level to identify disadvantaged communities in terms of climate, energy, sustainable housing, employment, and pollution burden for the purpose of guiding federal investment. As with any novel initiative, it requires breaking new ground in terms of research methodologies and data use. It calls for data of sufficient granularity and scientific validity to compare communities across states and regions, and in terms of their rural and urban contexts. Federal agencies have been instructed to use CEJST to identify communities that meet Justice40 goals in their programming. States, territories, Tribal governments, and other organizations also look to this national-level tool for guidance.
___________________
1See https://screeningtool.geoplatform.gov/ (accessed October 3, 2023).
2See https://www.epa.gov/ejscreen (accessed March 27, 2024).
3See https://oehha.ca.gov/calenviroscreen/report/calenviroscreen-40 (accessed March 27, 2024).
Definitions of terms associated with identifying disadvantaged communities and environmental and economic justice vary. A community is a group of people who share common experiences and interactions. In the case of CEJST, communities also share geographic proximity based on U.S. Census Bureau-defined census tract boundaries. Community disadvantage results from a complex interplay of factors that inhibit or prevent people in some communities from achieving the positive life outcomes that are commonly expected in a society. Community disadvantage is also a consequence of structural factors and historical processes that create conditions undermining resilience to shocks and disruptions (e.g., those associated with climate change, economic transitions, or other social and environmental pressures). Cumulative impacts (also called cumulative burdens) are the combined total burden from stressors, their interactions, and the environment that affects the health, well-being, and quality of life of an individual, community, or population. The concept of burden is included in nearly all definitions of disadvantaged communities and indicates an activity or agent with negative consequences for human health and well-being. Measuring community disadvantage in a tool such as CEJST requires careful conceptualization and rigorous application of model construction if the results are to reflect the real world and support effective policy. The challenge of reducing a multidimensional concept to a single composite indicator is not specific to CEJST or EJ tools.
STUDY CHARGE AND APPROACH
Under the sponsorship of the Bezos Earth Fund, The National Academies of Sciences, Engineering, and Medicine convened an ad hoc multidisciplinary committee of 11 experts to consider the different types of environmental health and geospatial data and data integration approaches used in existing environmental screening tools that could be applied to identify disadvantaged communities. The committee was not asked to review CEJST, but rather to conduct a scan of existing EJ tools including CEJST to identify types of data (e.g., environmental, socioeconomic) needed for CEQ tools; to evaluate data availability, quality, resolutions, and gaps; and to discuss data integration approaches. The committee was asked to provide recommendations that could be incorporated into an overall data strategy for CEQ’s tool(s). The committee concluded early in its deliberations that a good data strategy appropriate for CEQ and CEJST would also be appropriate for other EJ tool developers and tools. Concepts and recommendations in this report are therefore generalized and applicable to the development or management of any EJ tool. Therefore, this chapter synthesizes the main concepts of this report into actionable recommendations intended for EJ tool developers at CEQ and elsewhere.
On the basis of a review of existing EJ tools and the literature, through discussions with state and federal EJ tool developers and experts from the European Commission’s Competence Centre on Composite Indicators and Scoreboards at the Joint Research Centre, and through a public workshop focused on community engagement,4 the committee developed its own conceptual framework for composite indicator and
___________________
4Proceedings in Brief from the workshop are available at https://nap.nationalacademies.org/catalog/27158/representing-lived-experience-in-the-climate-and-economic-justice-screening-tool (accessed March 14, 2024).
tool construction. While the statement of task requested recommendations regarding elements of a data strategy for CEQ tools, recommendations in this report are rooted in the fundamentals of sound indicator development and are applicable to EJ tools generally.
SYNTHESIS OF REPORT CONCEPTS
At the heart of many geospatial EJ tools is a composite indicator that represents a multidimensional concept or condition related to the EJ questions of concern—for example, community disadvantage in CEJST to guide investment under the Justice40 Initiative. Quantitative indicators are proxies for abstract concepts and are represented by one or more existing datasets. Calculating a composite indicator brings together measurements from multiple dimensions of the concept (e.g., different aspects of community disadvantage) to determine a single value intended to reflect the condition being measured. Sound composite indicators are developed with a clearly defined purpose and intended audience and reflect real-world conditions. The validity of a tool rests on a foundation of scientific and methodological rigor, meaningful and sustained participation and input from community and other interested and affected parties, transparency, and acceptance by institutional actors (e.g., government agencies), communities, and other affected parties.
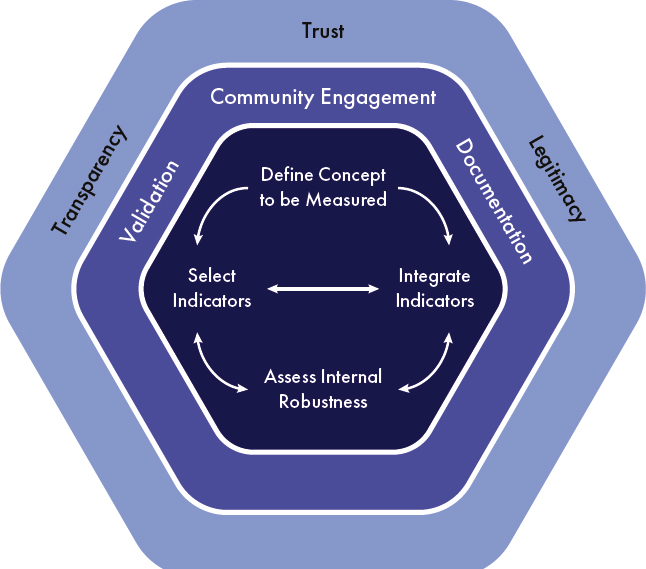
There are published, systematic methodologies for developing composite indicators, for evaluating decisions related to their construction and internal robustness, and for external validation. In these methodologies, composite indicator construction is an interrelated system of steps or components for identifying the concept to be measured; selecting indicators and data, analyzing, normalizing, weighting, and aggregating the data; evaluating the results for coherence, internal robustness, and validity, and presenting the resulting information. Effective community engagement—described by the Centers for Disease Control and Prevention as the collaborative process of working with people connected by geographic proximity or interests to address issues of health and wellbeing—is necessary to validate every component of composite indicator construction to determine if each of those components represents real-world conditions and lived experience. The committee developed a conceptual framework (Figure S.1) to demonstrate the interrelationships of the different components of tool construction and used this framework to organize recommendations around an EJ tool data strategy. The outermost ring represents the objectives for constructing any tool, the innermost ring represents activities related to composite indicator construction, and the middle ring represents the communication activities necessary to move inside out.
An EJ tool that measures cumulative impacts reflects the combined effects of environmental and socioeconomic burdens. A binary approach such as that applied in CEJST does not discern communities facing single and multiple burdens. However, systematically identifying all the burdens faced by communities and how those burdens combine and interact is challenging. A certain amount of error is inevitable, but tool validation techniques can be applied to create a tool that is stable, accepted, scientifically sound, and based on cumulative impact scoring approaches. Considering appropriate indicators and measures, including measures of economic burden beyond the federal
poverty level, and explicitly incorporating measures of race and racism into an EJ tool will result in a tool that better reflects lived experience.
DATA STRATEGY RECOMMENDATIONS
Transparency implies that a tool’s goals, processes, data, and uncertainties are recognized and understood by tool users and the people interested in tool results. The committee formulated a set of science-based recommendations to inform a data strategy for EJ tool development based on current research in geospatial tool development and EJ. These recommendations are not intended to advocate for changes in legal policy, but rather represent the committee’s conclusions regarding how data may be used to achieve model results that reflect reality. The legitimacy of a tool is related to acceptance of the tool and its results by communities. Therefore, a good data strategy considers how transparency, trust, and legitimacy can be created and reinforced in all components of tool construction (i.e., those depicted in Figure S.1). As the guiding forces of the tool
development process, the recommendations outlined in this report inherently are meant to promote trust, transparency, legitimacy in the tool.
As of this writing, 35 different state and federal EJ tools have been released, and half of those have been released since 2021. Several reviews of EJ tools have found that definitions of community and disadvantage are often inappropriate and not reflective of community self-determinations or lived experiences; that indicators and measures of burden incorporated into tools are often incomplete or out of date (e.g., collected many years previously and not reflective of current conditions); that consideration of race and ethnicity is warranted; that the ways in which multiple burdens interact (cumulative impacts) are important, and that community input and engagement are vital to a relevant tool. However, many good indicator construction and analysis practices have been employed in EJ tool development. The recommendations provided here are based on the sound practices identified by the committee that could help tool developers such as CEQ improve their tool development and data strategies.
Community Engagement
The committee’s conceptual framework (Figure S.1) emphasizes the importance of community engagement in tool construction. Choosing appropriate indicators, datasets, and integration approaches requires more than statistical robustness to achieve valid results. Community engagement validates the choices made in tool development as well as tool results and allows developers to understand the types of errors that are likely, why and where they occur, and how they might be overcome. Community engagement helps developers understand how uncertainties in tool results might impact the policy decisions the tool is meant to inform.
Recommendation 1: Create and sustain community partnerships that provide forums and opportunities to identify local environmental justice issues, identify the indicators and datasets for measuring them, and determine whether tool results reflect community lived experiences.
There is a spectrum of possible engagement approaches based on the desired level of involvement by community members and interested and affected parties. For community engagement to be meaningful, it will be collaborative and sustained, and allow communities to feel involved in governmental decisions with local implications. Many EJ issues are local in scope, and close community engagement helps bring local issues into context, not only for understanding burdens across communities, but also for finding targeted solutions that address unique needs. However, community in-depth engagement cannot be accomplished meaningfully or sustained with every community represented by a tool, and an engagement program will necessarily be designed with the aid of experts in community engagement and with advisory committees to appropriately identify representative communities, to design tool feedback methodologies, and to validate decisions made during indicator construction. EJ tools such as CEJST often use indicators developed for different purposes for other tools or datasets. Ensur-
ing that processes are established to meaningfully validate those derived indicators with communities will support the transparency, trust, and legitimacy of the tool.
Documentation
Community engagement, validation, and documentation (middle ring of Figure S.1) are all dependent on communication between the tool developer and communities, tool users, and a variety of interested and affected parties. Documentation is the means for a tool developer to describe tool components and explain the rationale behind decisions related to indicator and data selection, data integration and analysis approaches chosen, and about all aspects of robustness and validation analyses.
Recommendation 2: Provide thorough and accessible documentation of indicator design processes and decisions, including descriptions and rationale for all major indicator construction components.
The current documentation of CEJST methodology and data includes descriptions of the burden categories and datasets, instructions on how to use the tool, and access to the code via a public repository. Less clear are the processes and rationale for decisions regarding indicator selection and weighting, data normalization, data treatments, thresholds, indicator aggregation, assessing statistical and conceptual coherence, epistemic uncertainty analysis, external validation via community engagement, and the design of the user interface. Thorough documentation of all tool components and approaches is vital to ensure proper tool use and to help decision makers understand where and how the tool may be accurate, what kinds of uncertainties should be expected, and when tool results need to be supplemented with other types of information. Good documentation makes the strengths and weaknesses of the tool clear to a variety of technical and nontechnical users or community members and provides guidance regarding the best use of the tool for decision making.
Validation
Composite indicator construction requires a certain amount of compromise. In alignment with the executive order that mandated the creation of CEJST, CEQ uses census tracts to define communities knowing that census tract boundaries do not always align with community boundaries and that large disparities in community health and well-being within a census tract may exist. However, the choice also takes advantage of national data sets available at that scale. Given that such compromises are inevitable during the development of any tool, and given that no single definitive measure might be available to validate for the purpose of a tool (e.g., “overburden” or “disadvantage” for CEJST), validation methodologies need to be applied throughout the construction of a tool to determine how well the tool relates to real-world conditions.
Effective validation spans how well the indicators measure what they are supposed to (construct validity), the degree of alignment among indicators (concurrent validity),
and the indicators’ representativeness of the underlying concept (content validity). Methodological components and processes can be applied during tool construction to ensure that a tool and its findings are rooted in the realities and lived experiences of communities. Validation may take the form of a combination of technical, statistical, and community engagement activities. Ground truthing, for example, includes a comparison of measured versus modeled information through a variety of approaches, including:
- Convergent validation: comparing tool components or results with those of similar tools (e.g., correlation analysis of tools results).
- Community validation: an iterative process conducted via collaborative engagement with communities to compare how well the tool reflects lived experiences. Although challenging given the scope of many tools, consistent engagement throughout tool development allows developers to test decisions, approaches, and tool results against community member narratives, while empowering communities to accept or refute definitions being assigned to them.
- Mixed methods: allowing collection and analysis of both qualitative and quantitative datasets to better understand multiple perspectives on any issue. Mixed methods challenge the “traditional” scientific mindset focused on quantitative data, but their use will result in the incorporation of lived-experience information into data analyses.
Supplemental analysis using independent external datasets outside a tool development process can be used to check indicator data sources for gaps or inaccuracies and to compare, for example, the spatial correlations between the results of different tools. CEQ might conduct supplemental analysis to, for example, compare the distribution of race/ethnicity indicators and CEJST outputs to understand the impact of the tool’s current formulation on underrepresentation of racial disparities. The analysis can result in a greater understanding of sociodemographic composition, identification of the determinants of health in communities identified, and generation of localized narratives to better understand lived experience. Because communities and burdens are dynamic, repeated validation of indicators and results is necessary.
Recommendation 3: Validate tool development and evaluative processes throughout the construction of an environmental justice tool using approaches such as ground truthing, convergent validation, and community validation to ensure that the tool’s indicators and results reflect lived experiences.
Using a Structured Development Process
Composite indicator construction involves carefully considered interlinked decisions. The first decisions to be made are related to the objective of the tool, identifying the concept to be measured and developing a clear definition of the concept. There are multiple structured frameworks for the construction of a composite indicator that ensure that all composite indicator construction decisions are considered explicitly, lead to the
stated objective, and are then documented thoroughly and carefully. Tool developers such as CEQ can utilize one of these frameworks to improve the transparency, trust, and legitimacy of their tools.
Recommendation 4: Initiate environmental justice tool and indicator construction with the development of clear objectives and definitions for the concept(s) to be measured. Follow a structured composite indicator development process that requires explicit consideration and robustness analysis of all major decisions involved with indicator selection and integration; assessment of uncertainties; and validation and visualization of results.
A good data strategy requires an explicit, systematic structure. The lack of explicit structure in CEJST linking the concept to be defined, its dimensions, indicators, and integration strategies results in an implicit weighting scheme. If CEQ incorporates more sophisticated indicator integration methods for capturing cumulative burdens in future iterations of CEJST, the lack of an explicit conceptual structure may be problematic. The state of the art and practice in composite indicator and EJ tool construction includes:
- Defining the concept to be measured and developing a description of its multiple facets or dimensions;
- Selecting the indicators that measure each dimension;
- Analyzing, treating, normalizing, and weighting the indicators as appropriate;
- Integrating/aggregating the indicators;
- Assessing statistical and conceptual robustness and coherence and determining the impact of uncertainties; and
- Validating the results and presenting them visually (e.g., choice of category breaks and colors).
Selecting and Assessing Indicators
The selection of indicators and datasets is part of the structured approach described above and requires consideration of their technical and practical characteristics and how objectively and well they support the indicator and tool. Available datasets may not be of equal quality, expressed in the same units or at the same scales, or collected for the same purposes. Many indicators are based on empirical datasets, which, through analysis, may be found to be statistically sound, but may not actually represent lived experiences. Not all information will be empirical and require different techniques to assess. Given the close interconnection between concept definition, indicator selection, weighting, and ground-truthing methods, decisions related to the selection of indicators are central to a high-quality and accurate tool. CEJST uses an apparently reasonable set of indicators and datasets, but numerous other federal and national datasets exist for EJ tools that could be used (Appendix D provides examples).
Recommendation 5: Adopt systematic, transparent, and inclusive processes to identify and select indicators and datasets that consider technical criteria (validity, sensitivity, specificity, robustness, reproducibility, and scale) and practicality (measurability, availability, simplicity, affordability, credibility, and relevance). Evaluate measures in consultation with federal agencies, technical experts, and community partners.
A systematic scan of the federal and national-level indicators and datasets, perhaps in partnership with federal agencies, other data providers, or a steering committee, could identify additional or more appropriate indicators for defining community disadvantage. Once identified, correlation analyses of potential indicators would inform indicator selection and organization into categories. Demonstration of highly correlated indicators might indicate redundancy in the indicator set, possibly resulting in an unintended implicit weighting scheme if the highly correlated datasets are used. Low, negative, or statistically insignificant dataset correlation signifies poor statistical alignment with the concept to be measured. Correlation analysis of an indicator set could provide an empirical rationale and methodological transparency for a targeted revision of an indicator set.
Selecting Economic Indicators
Metrics of income do not necessarily measure wealth, and the wealth gap between high-income and low-income households is larger than the income gap. A single, uniform low-income measure in an EJ tool such as CEJST may not accurately reflect lived experiences, even after doubling the standard poverty level and accounting for the cost of living.
Recommendation 6: Choose measures of economic burden beyond the federal poverty level that reflect lived experiences, attend to other dimensions of wealth, and consider geographic variations in cost of living.
Income-based measures deserve scrutiny because of the effects of income on all aspects of a person’s or household’s quality of life (e.g., nutrition, health care, and education). Other indicators can be used as socioeconomic measures (e.g., U.S. Department of Housing and Urban Development Public Housing/Section 8 Income limits for low-income,5 homeownership rates, median home values, or weighted income metrics). Tool developers should work alongside communities to identify other dimensions of wealth that would more accurately reflect economic burdens, and they should conduct sensitivity analyses on these indicators and their thresholds.
___________________
5HUD’s FY2023 methodology for determining Section 8 limits can be found here: https://www.huduser.gov/portal/datasets/il//il23/IncomeLimitsMethodology-FY23.pdf (accessed March 8, 2024).
Consideration of Racism and Race
The enduring effects of historical race-based policies on housing, transportation, and urban development continue to shape contemporary environmental inequalities. There is ample research demonstrating racism as a fundamental cause of disadvantage and social, economic, health, and environmental inequalities in the United States. Racism itself is a key factor leading to unequal exposures and outcomes for specific populations, and research demonstrates that race and ethnicity—more so than economic indicators—are reliable predictors of disparity.
Recommendation 7: Use indicators that measure the impacts of racism in policies and practices that have led to the disparities observed today. If indicators of racism are not used, explicitly factor race and ethnicity as indicators when measuring community disadvantage.
The best available research suggests that incorporating racism as an indicator in an EJ tool can strengthen and add legitimacy to the tool; however, doing so may pose legal policy challenges. If a tool developer chooses not to explicitly factor race or ethnicity as an indicator to measure community disadvantage as the best available research would suggest (e.g., developers of CEJST and some other EJ tools), then other approaches are necessary to acknowledge the history of racism and land use policies that have led to EJ disparities observed in communities populated by peoples of color. There are readily available disaggregated data on race and ethnicity that could be used in a national-level EJ tool (e.g., U.S. Census data on race and ethnicity). Those data could be used until appropriate indicators for racism are chosen or developed. Tool developers can work with those who have developed other tools, representatives of communities of color, and technical experts to identify existing empirical data (see Recommendation 5) and consider whether and how well the metrics, quantitative data, and qualitative data reflect community lived experiences. To measure residential segregation, CEJST includes an indicator of historic underinvestment based on redlining data. While those data are important for understanding the multidimensional nature of structural racism, the data are incomplete and unavailable nationally.
Supplemental analysis to compare distributions of race or ethnicity indicators and CEJST outputs could help CEQ tool developers better understand how well CEJST captures community disadvantage in its current formulation. The results could reveal how the input and output indicators are distributed by racial and ethnic composition. Such analyses can improve the understanding of the degree of racial and ethnic disparities in the designation of disadvantaged communities and can address how well CEJST identifies disadvantage without the inclusion of race or ethnicity indicators. Publication of the analysis results would show CEQ’s responsiveness to numerous public comments received on this issue and increase trust in the tool development process and tool results.
Integrating Indicators and Cumulative Impact Scoring
Measuring and redressing the cumulative impacts of environmental stressors is a stated objective of EO 14008, the CEQ, and EJ advocates. This is important because the interplay of multiple concurrent stressors interacting with sociodemographic, environmental, and public health factors leads to the possibility of the total burdens on a community being greater than the sum of the individual stressors.
Recommendation 8: Designate communities as disadvantaged based on cumulative impact scoring approaches that are informed by the state of science; the knowledge, needs, and experiences of agencies, tool developers, and users; and validation efforts conducted in partnership with affected communities. Choose an approach to represent cumulative impacts, such as threshold approaches (e.g., summing thresholds or categories exceeded) or aggregation-based approaches for composite indicator construction (e.g., compensatory, noncompensatory, or a combination of approaches).
Cumulative impact scoring is an established practice applied in state-level EJ tools such as CalEnviroScreen and Maryland EJ Screen.6 Such scoring enables clearer comparison of communities and prioritization of investment based on the severity of burden. The current binary approach used in CEJST to designate communities as either disadvantaged or not disadvantaged is based on meeting the threshold of a burden indicator and its associated socioeconomic indicator. This type of approach does not allow the tool to discern communities facing single or multiple burdens. A future CEQ data strategy could incorporate the use of an aggregated approach that allows combining indicators mathematically into a single number, thus capturing a representation of cumulative impacts.
Decisions related to indicator selection, weighting, and aggregation to capture cumulative burdens are intertwined and should be made in an iterative and engaged manner, reflecting scientific knowledge, tenets of indicator construction, perspectives from interested and affected parties, and lived experiences. Explicit weighting of indicators is necessary, given their major impact on composite indicator results when aggregating.
Assessing Internal Robustness
When constructing composite indicators that are used for high-consequence resource allocation and project prioritization, it is crucial to understand the degree to which modeling decisions affect the robustness of the outputs. Numerous modeling decisions—each of which includes multiple plausible options based on scientific knowledge, available data, and community preferences—can independently and conjointly influence which communities a tool identifies as disadvantaged. Uncertainty
___________________
6See https://mde.maryland.gov/Environmental_Justice/Pages/EJ-Screening-Tool.aspx (accessed March 26, 2024).
and sensitivity analyses are methodologies that can illuminate the degree and drivers of instability in model outputs. Uncertainty analyses quantify the variability in model outputs based on changes in model inputs. Sensitivity analyses apportion variability in model outputs to different input parameters or model structures. Both types of analyses can be conducted as a local analysis (i.e., one parameter evaluated at a time) and global analysis (i.e., multiple parameters and their interactions assessed simultaneously using Monte Carlo simulation). Interactive methods exist for understanding the implications of modeling decisions, visualizing the impacts of different decisions on the results, and visualizing the composite indicator decomposed into subgroups and individual indicators in both chart and map form.
Recommendation 9: Perform and document uncertainty and sensitivity analyses to evaluate how decisions made during tool development affect tool results. Decisions to be assessed may relate to, for example, the selection of indicators and indicator thresholds; model structure; processes related to the normalization, weighting, and aggregation of indicators; and the criteria used for the final designation or classification of communities.
Uncertainty and sensitivity analyses are core best practices for quality assurance in composite indicator construction and should be a part of a data strategy for any EJ tool, including CEQ tools such as CEJST. A global uncertainty analysis of CEJST will improve understanding of the precision with which communities are designated as disadvantaged when the model is subjected to alternative construction choices. The modeling decisions creating the most uncertainty can be identified in subsequent global sensitivity analyses. Uncertainty can then be diminished through subsequent research, targeted data collection, and improved modeling. The ultimate goals are reducing statistical fragility and increasing the transparency of the modeling process. Global uncertainty and sensitivity analyses can also provide empirical results that support response to public queries about the certainty of overall and geographically-specific designations of community disadvantage.
CLOSING THOUGHTS
A good data strategy to create a trusted, transparent, and legitimate EJ tool is one that uses a structured composite indicator development process that facilitates decision making on the independent and interrelated design factors in the construction process. Decisions related to clear identification of the concept to be measured; selection of indicators and data; analysis, normalization, weighting, and aggregating the data; evaluation of results for coherence, internal robustness, and validity; and the visual presentation of results need to be made considering how those decisions affect each other. For example, to create a legitimate tool that represents lived experience, decisions regarding effective community engagement need to be made in consideration of how every component of composite indicator construction can be validated to determine if real-world conditions are being represented. Collaborative partnerships with community
members, government entities, other tool developers, advisory groups, and technical experts are a means to identify appropriate indicators and datasets, check modeling decisions, validate indicators and results, and refine model approaches. Documenting community engagement, response to input, tool approaches, rationale for decisions, uncertainties in tool data and results, and how and when tool users need to supplement tool results with additional information will create needed transparency.
Careful analysis of indicators and datasets to choose—in partnerships with communities, governments, and technical experts—appropriate representative measures and correlation among datasets. Considering measures of economic burden beyond the federal poverty level and explicitly incorporating measures of race and racism into an EJ tool will result in a tool that also better reflects lived experience. Data strategies based on cumulative impact scoring approaches are the state of the science and advanced practice and can reflect the combined effects of environmental and socioeconomic burdens over time in a manner that reflects reality. Implementing the recommendations in this report will allow the construction of valid geospatial tools for EJ that can inform better targeting of community investment.


