Constructing Valid Geospatial Tools for Environmental Justice (2024)
Chapter: 5 Selecting and Analyzing Indicators and Datasets and CEJST Indicators
5
Selecting and Analyzing Indicators and Datasets and CEJST Indicators
Determining how to represent the concept to be measured—either quantitatively or qualitatively—is critical in developing any mapping or screening tool. Three decision points are relevant to this chapter: (1) which burden categories to include, (2) which indicators to represent those burdens, and (3) which individual dataset to represent each of those indicators. Chapter 3 described this process to include defining the concept to be measured, selecting a group of indicators and datasets to represent those indicators, and analyzing the indicators and datasets, all within an iterative process for constant refinement and improvement. This chapter begins with a description of useful practices for quantitatively representing the concept to be measured for individual indicators that contribute to disadvantage (e.g., selecting and analyzing indicators; qualitative representation is described in Chapter 7). It then more specifically considers the burden categories and indicators used in the White House Council on Environmental Quality (CEQ) Climate and Economic Justice Screening Tool (CEJST).1 The text is intended to provide criteria, parameters, and important considerations for making often difficult choices as to which indicators and datasets are selected.
The committee’s statement of task (see Box 1.1) calls on the committee to identify key data gaps that CEQ could address in future iterations of its EJ tool(s). However, without comprehensive documentation of the problem being addressed by their tools, clear definitions of concepts being measured, and descriptions of decision-making rationale, the identification of specific data gaps could be based on erroneous assumptions. Instead, the committee describes several indicators that could be included in a tool such as CEJST based on the committee’s understanding of the CEJST objectives, community feedback received at the committee’s workshop, and expert judgment. The committee provides examples of datasets and sources in Appendix D that could be considered when
___________________
1See https://screeningtool.geoplatform.gov/en/#3/33.47/-97.5 (accessed March 3, 2024).
identifying future datasets for tools such as CEJST. New data may become available and incorporated into the tool in the future. CEQ could facilitate the development of new, fit-for-purpose datasets through collaborations with federal agencies, nonprofit research organizations, university-based research groups, and private firms who may have proprietary data sources that fill gaps in publicly available datasets.
An exhaustive list of individual indicators and datasets that could be used in an EJ tool such as CEJST is not provided because these, too, need to be determined by the tool developer through a structured indicator development process as described in this report. Identifying appropriate indicators and datasets through an inclusive, community-informed process could lead to improved and more informed identification of representative data, and scientific and technical advances may drive improvements in data quality and completeness. The structured tool development process recommended in this report could minimize the potential for data gaps in future iterations of the tool.2
INDICATOR SELECTION
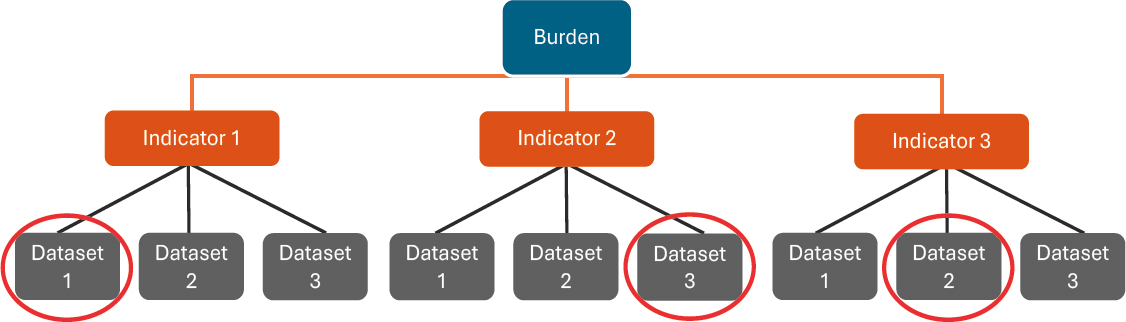
An indicator is a quantitative proxy for an abstract concept, such as “exposure,” “access,” or “disadvantage.” To select appropriate indicators, it is necessary to understand the relationships between burden, indicator, and dataset (see Figure 5.1). These relationships are also described in Chapter 3 as part of the discussion on the conceptual foundation for constructing composite indicators. Creating a compelling rationale for why different indicators should be included is fundamental to creating composite indicators that are interpretable and useful. For example, various environmental exposures such as particulate matter and heat exposures can interact to affect health. A conceptual model could help frame and explain the complex interrelationships (including potential causal relationships) between the indicators and their impacts on the concept being measured. The model will be dependent on the goal of the tool, the structural approach used to develop the tool (including community input) the data available, and the state of the science that allows understanding of interrelationships, causality, and cumulative impacts related to the problem at hand. A model that hypothesizes the interrelationships of the indicators can help the developer (1) select which domains to be included and why and (2) determine if and how cumulative impacts could be captured.
CEJST includes eight categories of what CEQ labels “burdens”—climate change, energy, health, housing, legacy pollution, transportation, water and wastewater, and workforce development. Each of these categories contains a set of indicators that are intended to represent the burden category. For example, the energy category includes two indicators: energy cost and fine particulate matter (PM2.5). The number of indicators differs between burden categories (currently between two and five indicators per category), but each indicator is represented in the tool by one dataset. In general, these datasets are files of numerical quantities that vary in magnitude and in space, intended
___________________
2Executive Order 14096 authorizes the director of the Office of Science and Technology in conjunction with the Chair of CEQ to “address the need for a coordinated Federal strategy to identify and address gaps in science, data, and research related to environmental justice.”
to align with real-world variation in the property being measured. Although multiple datasets are often available for the same indicator, only one dataset is selected and used in CEJST. For example, many annual average ambient particulate matter (PM2.5) concentration datasets are used across the federal government and scientific community, and each was developed using different methods and data inputs (e.g., statistical modeling, geophysical modeling, satellite remote sensing); the dataset used in CEJST was developed by Environmental Protection Agency (EPA) using a model-monitor fusion approach.
Criteria
The structured process for indicator construction outlined in Chapter 3 includes a systematic approach to indicator and data selection. Table 5.1 outlines technical and practical indicator characteristics to consider when selecting specific measures, with the aim of optimizing quality and validity. A set of practical questions that tool developers could ask is provided. The criteria are not unique to indicator construction and have been used in other contexts (e.g., comparing federal tools for ranking hazardous waste sites for remedial action; NRC, 1994). Technical characteristics emphasize representational, statistical, and geospatial aspects of indicator data and are typically the focus of analysts and modelers. Practical characteristics, such as data availability and cost, are generally of greater interest to indicator program managers and end users. An important technical criterion is validity—how well the indicator reflects the lived experience. Validity will also be discussed in Chapter 7, particularly as it pertains to community involvement. Whether or not the data are findable, accessible, interoperable, and reusable (FAIR;
TABLE 5.1 Indicator Selection Criteria
| Type | Criterion | Description |
|---|---|---|
| Technical | Validity | How well does the indicator measure the characteristic it represents? |
| Sensitivity | Is the indicator sensitive to changes in the underlying phenomenon? | |
| Robustness | Is the indicator analytically and statistically sound? | |
| Reproducibility | Can the data be independently verified and reproduced? | |
| Scale | Do the geographic and temporal scales of the indicator match those of the characteristic it represents? | |
| Practical | Measurability | How easily can the data be measured quantitatively? |
| Availability | How easily can the data be obtained? | |
| Simplicity | Is the indicator intuitive and easy to interpret? | |
| Affordability | How reasonable are the data collection costs? | |
| Credibility | How acceptable is the indicator to the intended audience? | |
| Relevance | Does the indicator align with the intended goals of the tool? |
SOURCE: Adapted from: Tate, 2011.
Wilkinson et al., 2016) may also be part of the data selection criteria, as might whether the data are consistent with CARE principles (collective benefit, authority to control, responsibility, and ethics)3 and support Indigenous self-determination and innovation (see Box 5.1). Use of FAIR data and CARE principles may serve to enhance the transparency and acceptance of the data as representative of community lived experience. If Indigenous data are used, CARE principles need to be applied so that data are used in a manner in accordance with the rights, knowledge, and values of Indigenous peoples (Carroll et al., 2020).
There are multiple forms of validity, three of which are particularly important for environmental indicators:
- Construct validity: how well an indicator measures what it is supposed to. For example, a composite indicator of cumulative disadvantage with high construct validity embodies the principal dimensions and interactions that govern how disadvantage functions.
- Concurrent validity: the degree of alignment between two measures that should be related. It is typically evaluated using correlation analysis, for example, testing the statistical association between alternative measures of socioeconomic status.
- Content validity: representativeness, essentially the extent to which an indicator includes all principal dimensions of the underlying concept.
Other leading technical criteria include sensitivity, robustness, reproducibility, and spatial or temporal scale. A sensitive indicator will change in direction and magnitude with a change in its real-world proxy. Robustness is a statistical measure of the stability of an indicator to changes in its construction: the indicator should not change substantially with small changes in how it is measured. This is typically assessed using sensitivity analysis. Reproducibility is the ease with which the indicator can be constructed by others independent of the current indicator construction project. The scale criterion is the degree to which the spatial units and time periods of the indicator data align with those of the process or phenomenon being measured. A scalar mismatch can occur when practical considerations of availability, cost, or administrative structures constrain the selection of geographic and temporal scales.
The practical considerations in indicator selection, described in Table 5.1, are often more ambiguous to assess but are no less important. Measurability is the ease of quantitatively manifesting the underlying concept or process. In practice, physical and economic characteristics are easier to measure than more intangible processes, such as marginalization and compounding effects. Failure to incorporate difficult-to-measure concepts can negatively affect the content validity of a single or composite indicator. Availability is the ease of obtaining indicator data for the dimensions, geography, and time frame of interest. Widely available and standardized secondary data are often chosen for indicators used to compare places at the national level, yet they can conflict
___________________
3See https://www.gida-global.org/care (accessed May 14, 2024).
BOX 5.1
FAIR Data and CARE Principles
To improve infrastructure that supports research data, academics, funding entities, industry, and scholarly publishers have developed a set of principles known as the FAIR (findable, accessible, interoperable, and reusable) Data Principles. Specific guidelines have been established and adopted that are intended to increase data sharing and aid science discovery through guidelines for data and metadata design that enhance the reusability of data by computers and humans (Wilkinson et al., 2016).
The CARE (collective benefit, authority to control, responsibility, and ethics) Principles for Indigenous Data Governancea recognize that FAIR data principles ignore the historical contexts of data and power differentials in advancing Indigenous innovation and self-determination. The data of Indigenous Peoples’ comprise:
“(1) information and knowledge about the environment, lands, skies, resources, and non-humans with which they have relations; (2) information about Indigenous persons such as administrative, census, health, social, commercial, and corporate and, (3) information and knowledge about Indigenous Peoples as collectives, including traditional and cultural information, oral histories, ancestral and clan knowledge, cultural sites, and stories, belongings (Carroll et al., 2020)”
The CARE Principles consider self-determination by Native Americans and other Indigenous groups through standards to be applied in conjunction with FAIR data guidelines (e.g., Jennings et al., 2023). The principles are established on the rights of Indigenous Peoples to create value from data related to them in ways that are based on their own world views.
__________________
a See https://www.gida-global.org/careaSee https://www.gida-global.org/care (accessed May 14, 2024).
with construct and content validity. Simplicity and affordability are perhaps the most straightforward criteria: how understandable is the indicator, and how reasonable are the data acquisition costs in money and time? Credibility is the believability and salience of the indicator for scientific and technical applications, as well as for the public. This is also referred to as community validation and buy-in. Involving community members and other interested and affected parties throughout the indicator selection process can be crucial for building credibility, not only to ensure that it represents people’s lived experiences but also to engender trust. This is discussed in more detail in Chapter 7.
Relevance is determined based on alignment between potential indicators and the tool’s objectives. As with all other factors of tool development, indicator relevance needs to be determined through a community partnership and transparent process.
With many potential indicators that meet the criteria described above, relevance can also reflect prioritization among the indicators to ensure that each indicator efficiently achieves its objective without accruing unnecessary costs from data identification, storage, and computation. California’s CalEnviroScreen4 is an example of a tool for which indicator relevance is based on community input. Chapter 7 contains information on including community input while also utilizing tools with scientific rigor.
According to the Technical Support Document for CEJST 1.0 (CEQ, 2022a, p. 17), the indicators and data included in CEJST were selected based on the following parameters:
- The indicator is “[relevant] to the goals of Executive Order 14008 and the Justice40 Initiative”; datasets are “related to climate, environmental, energy, and economic justice”;
- The indicator data are publicly available (not private or proprietary);
- The indicator data cover all 50 states and the District of Columbia at a minimum, and where possible, the five U.S. territories of Puerto Rico, American Samoa, the Northern Mariana Islands, Guam, and the U.S. Virgin Islands; and
- The indicator data are available at the census-tract scale or finer.
CEJST utilizes 30 indicators across eight categories of burden that meet the above criteria. However, there are many other existing potential indicators that meet their criteria that are not included in the tool. For example, the Environmental Defense Fund’s Climate Vulnerability Index includes 184 indicators (Tee Lewis et al., 2023), most of which also meet CEJST criteria for inclusion. In addition, EPA’s EJScreen5 tool uses similar criteria for indicator selection. CEJST documentation (CEQ, 2022a) does not include a rationale for why some EJScreen indicators are included in CEJST, and some are not. That said, more indicators do not indicate a better tool if indicator quality is questionable or if indicators are repetitive or contradictory. At a public workshop organized by the study committee as part of its information gathering for this report (see Appendix B for the workshop agenda), workshop participants commented that using a national scale could be a limitation and that regional, state, municipal, or otherwise non-national data could provide valuable additional information (NASEM, 2023a).
Temporal Changes in Data
Current geospatial screening tools such as CEJST provide only a static or snapshot-in-time approach for exploring the environmental and social characteristics of neighborhoods and evaluating related burdens. There are two limitations of a snapshot approach that do not allow the incorporation of temporal effects in the tool. First, how long vulnerable communities have been exposed to polluted water, air, or other environmental hazards is important and is not considered in estimating risk burdens. Time
___________________
4See https://oehha.ca.gov/calenviroscreen (accessed March 4, 2024).
5See https://www.epa.gov/ejscreen (accessed March 4, 2024).
can be used as a weighting variable for an indicator whose value would be greater, for example, if a pollution source has existed in its present location longer, thus enabling the tool to capture more severe impacts of legacy pollution.
A second limitation of this approach is that it does not allow exploration of how a designation of disadvantage changes over time, for example, whether a tract currently categorized as disadvantaged (or not disadvantaged) was classified similarly in the past. Adding this capability of tracking changes over time could be useful in determining whether investments in disadvantaged communities (DACs) resulted in a reduction of specific climate or socioeconomic burdens or a change in the designation of disadvantage. It may also be useful to examine how spatial patterns and geographic locations of DACs are changing over time in a specific urban area, state, region, or nationwide. Assessing changes over time for specific burdens and overall designation of disadvantage, however, could be problematic and challenging because indicator datasets come from many different time frames and years and are not updated at the same time. If the tool is updated annually, an option could be added for the user to explore whether a particular tract was designated as DAC in previous years or previous versions of the tool. This may require thorough documentation of the updated processes and datasets as well as the resulting changes in the tool output and interpretation. A change in designation can occur for a variety of reasons and may not reflect a change in lived experience in a community. In some cases, a change in designation might be the result of updated data. However, if the data in the previous tool version were old and outdated, then it might not be obvious when changes in the community occurred. In other cases, an update in status might be the result of a change in the data integration approach rather than a change in data.
Temporal Coverage and Frequency of Data
An important consideration when selecting datasets is their temporal coverage and frequency of updating. Datasets are typically available for specific years or sets of years. Datasets are updated at different intervals (e.g., annually), whereas others are updated less frequently (e.g., every 3 years) or have no process for being updated. Additionally, for indicators with high interannual variability (e.g., wildfires and other climate-sensitive indicators), datasets that average over a multiyear period (e.g., 5 years, 10 years) can provide more stable and interpretable estimates. Temporal coverage and updating frequency can, therefore, be driving factors when selecting datasets. Selecting datasets that represent the most recent years, that account for interannual variability (for indicators where interannual variability is high), and are updated frequently can ensure that the screening tool is as current as possible, although some temporal misalignment between indicators is inevitable. Box 5.2 provides a practical example of the potential affects of the frequency of dataset updating on data uncertainty.
IDENTIFYING AND ANALYZING THE DATASETS TO BE USED
Different datasets available for measuring a particular indicator may use different methodological approaches in their development. In some cases, there may be a
BOX 5.2
U.S. Census and American Community Survey Data in CEJST
Socioeconomic data used as burden indicators in CEJST are based on 5-year estimates derived from the American Community Survey (ACS). These estimates include uncertainties that the tool quantifies through margins of error (MOE). Previous sociodemographic research on the ACS illustrates how the 5-year average estimates can have substantial MOEs at subcounty scales (e.g., census tracts) when compared to the decennial U.S. Census data (Bazuin and Fraser, 2013; Folch et al., 2016). To mitigate such measurement errors, researchers have suggested the removal of all census units with small population counts or the use of census units where MOEs of the point estimate are less than half of the point-estimate value (Folch et al., 2016). Since CEJST uses census tracts as the basic analytical unit, it is important to keep in mind that the MOE magnitude generally is considerable for tract-level ACS estimates, particularly in rural areas with lower populations. If the percentage of people living at or below 200 percent of the federal poverty line (i.e., the definition of “low income” in CEJST) in two tracts are compared, the differences between the two may be similar but smaller than the corresponding MOEs. This would seem to indicate no significant difference in the percentage of low-income people in the two tracts, suggesting that the percentiles for the two tracts should be identical and not different. This would be the conclusion if only the ACS point estimates of the percentages of people in the tract at or below 200 percent of the federal poverty line were utilized and the MOE values were not considered. This could result in potentially erroneous estimation of low-income burdens and, consequently, misclassification of community disadvantage. In the case of CEJST, burden calculations rely on data from the ACS 5-year estimates that do not acknowledge or account for uncertainty in the ACS variables. Other national public health and environmental health data products (e.g., National Health and Nutrition Examination Survey [NHANES]) add 95th confidence intervals to the percentiles, an approach that allows incorporation of uncertainty in the raw data and communicates the uncertainty in the percentile values themselves that are linked to the raw data.
“gold standard” methodological approach, but in other cases, multiple approaches may be used and accepted by researchers and practitioners without one approach standing out as most closely representing truth. Many of the same principles for selecting and evaluating indicators also apply to selecting and evaluating datasets used to represent those indicators. Often, datasets that are based on observations are considered of higher quality when compared with estimation approaches. However, when observations are sparse in space or time, combining observations with estimation techniques (e.g., statistical models, process-based models) can provide spatially complete datasets that are informed by observations. Another important consideration is how well the dataset performs upon evaluation against observed quantities (statistical evaluation metrics
such as correlation coefficients, bias, and uncertainty). However, multiple datasets can have similar performance against observations while differing in magnitude and spatial distribution of the estimated quantities. The degree to which the dataset is adopted and used by federal agencies or the scientific community, or accepted by communities, can provide additional confidence in the dataset’s validity.
Analyzing and comparing different available datasets can reveal insights as to the limitations and implications of the use of the datasets—for example, determining if certain communities are more likely to be missed when using one dataset over another (see Box 5.3). Analyzing indicators and datasets can also ensure that, barring specific stakeholder concerns about representation, the indicators and datasets selected for inclusion are independent of each other, reflect the state of the science, and are trusted by technical experts and validated by lived-experience data of community members. See Chapter 6 for details on integrating multiple indicators and possible correlation between indicators.
Rigorously documenting the process for selecting and analyzing datasets can enhance transparency and highlight areas for further research. Results such as spatial maps, tracts in the top percentile, correlations with other relevant indicators and datasets, and evaluation statistics are important information for agencies, community groups, researchers, and other users with which to understand the rationale and implications of each indicator and dataset selection. The process for obtaining those results, including community engagement, is also relevant for enhancing transparency.
BOX 5.3
Selecting Datasets to Represent Indicators: PM2.5 Example
The PM2.5 indicator illustrates the challenge of selecting among multiple high-quality datasets that could be used to define the indicator. CEJST currently uses a 12-km gridded annual average PM2.5 concentration dataset that was developed by EPA and is also used within EJScreen. A recent comparison of the CEJST dataset with two more highly spatially resolved datasets from the scientific community found that the three datasets differ substantially regarding which tracts are most overburdened within individual urban areas (Carter et al., 2023). As a result, the study identified 335 tracts (representing ~1.5 million people) as disadvantaged (>65th percentile for poverty and >90th percentile PM2.5) using both high-resolution datasets but not the 12-km dataset used by CEJST, and 695 tracts (representing ~2.7 million people) as disadvantaged in the 12-km dataset but not the high-resolution datasets. This analysis underscores the challenge of identifying and selecting a single dataset to represent the indicators in the tool. Each dataset also carries uncertainties, which are discussed in Chapter 6 of this report.
CATEGORIES OF BURDEN IN CEJST
CEJST includes eight categories of what CEQ labels burdens—climate change, energy, health, housing, legacy pollution, transportation, water and wastewater, and workforce development. These categories align and expand on the priorities in President Biden’s Executive Order (E.O.) 14008 (although E.O. 14008 does not include health in its list of priorities; EOP, 2021). The categories are used in combination with relevant socioeconomic burdens (low income and high school education) to identify DACs. Although the rationale for the E.O. 14008 categories is unstated, the committee did not identify any obvious omissions, given the committee’s understanding of the objectives of the tool. The rationale for the inclusion or exclusion of specific indicators within each burden category in CEJST is not provided in the CEJST technical documentation, either in terms of why certain indicators but not others were included or in terms of the categorization of individual indicators in specific burden categories (e.g., the inclusion of PM2.5, which has many emission sources, in the energy burden category).
Each of the eight burden categories includes multiple indicators—a different number of indicators for each category—as outlined in Table 5.2. The tool identifies a community as disadvantaged if it is in a census tract that is (1) at or above the threshold for one or more indicators in any burden category and (2) at or above the threshold for an associated socioeconomic burden. For example, the climate change burden category includes five indicators. If a tract meets a threshold for one or more of these indicators, as well as the threshold for the low-income indicator, it is identified as disadvantaged. Census tracts that do not meet any burden thresholds but are at or above the 50th percentile for low income and surrounded by other census tracts that do meet the thresholds for disadvantage are also designated as DACs. Finally, all land within the boundaries of federally recognized Tribes is designated as disadvantaged.
Using this formulation, neither the number of burden categories nor the groupings of indicators within them affect the tool’s binary identification of disadvantaged status. However, the tool does have some implicit weighting reflected in the number of indicators included in each burden category. Burden categories with more indicators (e.g., climate, housing, and legacy pollution, each with five indicators) have more chances of triggering the disadvantage identification compared with burden categories with fewer indicators (e.g., energy and water and wastewater, each with only two indicators). Burden categories with more indicators are thus implicitly weighted more heavily than burden categories with fewer indicators. As a result, some categories could be overrepresented and others underrepresented in the tool. In addition, indicator groupings could become important in future iterations of the tool, especially if integration approaches for assessing cumulative impacts are implemented (discussed further in Chapter 6). In addition, community engagement, validation, and transparency in selecting and including burden categories and indicators can help evaluate how well the tool captures burdens that align with the lived experience of communities (discussed further in Chapter 7; Larsen, Gunnarsson-Östling, and Westholm, 2011).
TABLE 5.2 CEJST Burden Categories and Indicators
| Burden Categories | Indicators | Socioeconomic Indicator |
|---|---|---|
| Climate change | 1. Expected agriculture loss rate ≥ 90th percentile OR | Low income* |
2. Expected building loss rate ≥ 90th percentile OR | ||
3. Expected population loss rate ≥ 90th percentile OR | ||
4. Projected flood risk ≥ 90th percentile (NEW) OR | ||
5. Projected wildfire risk ≥ 90th percentile (NEW) | ||
| Energy | 1. Energy cost ≥ 90th percentile OR | Low income* |
2. PM2.5 in the air ≥ 90th percentile | ||
| Health | 1. Asthma ≥ 90th percentile OR | Low income* |
2. Diabetes ≥ 90th percentile OR | ||
3. Heart disease ≥ 90th percentile OR | ||
4. Low life expectancy ≥ 90th percentile | ||
| Housing | 1. Historic underinvestment = Yes (NEW) | Low income* |
2. Housing cost ≥ 90th percentile OR | ||
3. Lack of green space ≥ 90th percentile (NEW) OR | ||
4. Lack of indoor plumbing ≥ 90th percentile (NEW) OR | ||
5. Lead paint ≥ 90th percentile | ||
| Legacy pollution | 1. Abandoned mine land present = Yes (NEW) OR | Low income* |
2. Formerly used defense site present = Yes (NEW) OR | ||
3. Proximity to hazardous waste facilities ≥ 90th percentile OR | ||
4. Proximity to Superfund or National Priorities List (NPL) sites ≥ 90th percentile OR | ||
5. Proximity to Risk Management Plan sites ≥ 90th percentile | ||
| Transportation | 1. Diesel particulate matter ≥ 90th percentile OR | Low income* |
2. Transportation barriers ≥ 90th percentile (NEW) OR | ||
3. Traffic proximity and volume ≥ 90th percentile | ||
| Water and wastewater | 1. Underground storage tanks and releases ≥ 90th percentile (NEW) OR | Low income* |
2. Wastewater discharge ≥ 90th percentile | ||
| Workforce development | 1. Linguistic isolation ≥ 90th percentile OR 2. Low median income ≥ 90th percentile OR 3. Poverty ≥ 90th percentile OR 4. Unemployment ≥ 90th percentile | Less than high school education > 10% |
NOTE: * = percent of a census tract’s population in households where household income is at or below 200 percent of the federal poverty level, not including students enrolled in higher education.
SOURCE: Adapted from CEQ, 2022a.
The ensuing subsections expound upon each of the CEJST burden categories with a description of the indicators included in each burden;6 additional indicators that could be incorporated to meet CEJST’s objectives; current data availability, quality, and spatial and temporal resolutions for those indicators; and key data gaps. The text is intended to provide a realistic and practical description of data that could be included in the tool in consideration of those data that meet CEJST’s criteria described above. It is not intended to be a comprehensive review of all available indicators and datasets but rather highlights those that the committee considered to be a high priority for relevance based on subject-matter expertise, information gathering (including a public workshop; NASEM, 2023a), and which datasets meet all technical and practical characteristics for inclusion. Potential changes to the burden categories themselves are not addressed; as previously mentioned, categorizations of the indicators only affect the identification of disadvantage to the extent that the number of indicators in each burden category differs, although these categorizations could become important in future iterations of the tool, particularly if an integration approach such as a composite indicator is used.
Climate Change
CEJST includes five indicators in the climate change burden category: expected agriculture loss rate, expected building loss rate, expected population loss rate, projected flood risk, and projected wildfire risk. Agricultural and building loss rate from those natural hazards are economic terms (agricultural value at risk and building value at risk), while population loss rate reports the number of fatalities and injuries caused by the hazard. Flood and wildfire risks are considered within these agricultural, building, and population loss indicators, and are also considered as individual indicators.
Expected agricultural, building, and population loss rates come from FEMA’s National Risk Index (NRI)7 and cover all U.S. states, the District of Columbia, and the five U.S. territories (American Samoa, Commonwealth of the Northern Mariana Islands, Guam, Puerto Rico, and the U.S. Virgin Islands). The NRI includes 18 different natural hazards. CEJST considers 14 of those 18 hazards to be climate-related: avalanche, coastal flooding, cold wave, drought, hail, heat wave, hurricane, ice storm, landslide, riverine flooding, strong wind, tornado, wildfire, and winter weather. A limitation of these composite indicators is that the risk of specific natural hazards varies from location to location. Thus, even when a census tract is identified as being disadvantaged based on a high agricultural, building, or population loss rate due to natural hazards, it is not clear which natural hazard(s) is driving the risk to be high in a specific location.
Projected flood and wildfire risk data originate from the nonprofit First Street Foundation.8 The flood risk dataset (at the census-tract level) represents how many properties are at risk of floods occurring in the next 30 years from tides, rain, and riverine and
___________________
6Information about which datasets were used for the CEJST indicators can be found in the CEJST Technical Support Documentation (CEQ, 2022a).
7See https://hazards.fema.gov/nri/ (accessed February 12, 2024).
8See https://firststreet.org/ (accessed February 15, 2024).
storm surges, without considering property values. The wildfire risk dataset (with a 30-meter resolution) represents the chance over 30 years of property in the area burning, considering factors such as fire fuels, weather, human influence, and fire movement. Both indicators are specific to property damage and are insufficient to capture broader impacts on health and livelihoods. For example, floods are associated with population displacement and mental health impacts, disruption in access to medication and health care, water quality issues, and other impacts. Wildfires are similarly associated with population displacement, mental health impacts, and disruption in access to medication and health care, and can cause deterioration of air quality at regional and continental scales, with respiratory, cardiovascular, and other health impacts.
The indicators used within CEJST to address climate change cover multiple relevant community hazards, but they provide a limited view of which communities are most vulnerable to the many impacts of climate change and through which pathways. Community resilience to climate change includes, for example, the impacts of increased heat, disease vectors, mental health, air pollution from sources other than wildfires, water quality, extreme weather events, and drought (USGCRP, 2023). Each of these can have serious downstream consequences for human health and livelihoods. For example, extreme weather events can lead to coastal inundation and inland flooding, leading to contamination of waterways with sewage, animal waste, and chemicals (Cushing et al., 2023b; Erickson et al., 2019), as well as the risk of chemical disasters at industrial facilities (Anenberg and Kalman, 2019). Many climate damage pathways have not yet been well quantified or detailed through qualitative data, and inclusion within CEJST is challenged by the lack of availability of nationwide, high-resolution datasets for each pathway.
Heat, however, is a climate damage pathway for which datasets appropriate for CEJST already exist. Heat is the leading cause of weather-related mortality in the United States over the last several decades (Luber and McGeehin, 2008) and may be under-reported (Weinberger et al., 2020). Unless additional measures to protect public health are taken, the frequency and intensity of extreme heat events will increase mortality and morbidity in the future (Shindell et al., 2020). Studies using surface temperature and other heat-related measures have found that heat is inequitably distributed within U.S. urban areas (Mitchell and Chakraborty, 2019; Renteria et al., 2022) and is related to historical redlining and marginalization (Hoffman Shandas, and Pendleton, 2020; Hsu et al., 2021). While surface temperature studies often do not account for humidity, which can modulate the heterogeneity of heat exposure within cities (Chakraborty, T. C., et al., 2022; Keith, Meerow, and Wagner, 2019), communities of color and with lower income levels disproportionately experience moist heat (Chakraborty et al., 2023) as well as heat vulnerability (Manware et al., 2022). Residential air-conditioning prevalence, which can mitigate the health effects of heat exposure, is also inequitable across 115 metropolitan areas (Romitti et al., 2022). Additionally, outdoor workers in many industries across the country, such as agriculture and construction, will still be exposed to extreme heat, even in areas with a high prevalence of residential air-conditioning (Licker, Dahl, and Abatzoglou, 2022).
Future climate risks are another set of potential indicators for which there are datasets appropriate for CEJST. As the geographic area and population affected by climate
change are expected to grow, the communities most affected by climate change in the future may be different than those most affected today. Two indicators used within CEJST consider future changes: flood risk and wildfire risk. However, as mentioned above, they capture a limited portion of human health damages. Potentially important indicators to represent community risks from climate change include future changes in extreme temperature, future changes in climate-sensitive natural disasters (only present-day natural disasters are currently included), and wildfire smoke. Further, the future projections for the datasets currently used within CEJST are limited to 30-year time horizons, though projections are available through 2100 from federal agencies. Rather than taking a deterministic approach for projecting future climate changes, which are inherently unknown and therefore uncertain, CEJST could consider a range of possible climate futures. Examples of other federal efforts that use a probabilistic approach considering multiple climate change scenarios include the National Oceanic and Atmospheric Administration’s (NOAA) Climate Mapping for Resilience & Adaptation (CMRA) tool9 and its Fifth National Climate Assessment (USGCRP, 2023), and other efforts across the federal government, such as the U.S. EPA’s Climate Change Impacts and Risk Analysis (CIRA) project.10
The U.S. government provides a wealth of high-quality national data on climatic conditions, both historical data and future predictions and models. CEJST could take advantage of these extensive resources to provide a more comprehensive set of climate-relevant indicators that are also more transparent and consistent with datasets, tools, and reports from other parts of the federal government. For example, the USGCRP’s CMRA tool includes several future climate burden categories that are not included in CEJST: extreme heat, drought, and coastal inundation. The Localized Construct Analogs (LOCA) version 2 dataset,11 downscaled from the CMIP6 dataset, is available at a 6-km grid resolution and is used in the Fifth National Climate Assessment (USGCRP, 2023). CDC’s Environmental Public Health Tracking Network uses two different datasets. The North American Land Data Assimilation System (NLDAS-2)12 is available at approximately 14-km grid resolution, and the National Oceanic and Atmospheric Administration (NOAA) NCLIMGRID dataset13 has a 5-km grid resolution. Additional datasets available within the research community have higher spatial resolutions and could be more appropriate for this application (e.g., Funk et al., 2015, 2019, Verdin et al., 2020). The First Street Foundation, which produced the datasets used for the projected flood risk and projected wildfire risk datasets used in CEJST, also provides national-scale data for extreme heat in their Climate Risk dataset. The dataset is at 4-km spatial resolution and covers 2023 to 2053 using the Intergovernmental Panel on Climate Change CMIP5 RCP4.5 greenhouse gas scenario. Available climate datasets are continually advancing
___________________
9See https://resilience.climate.gov/ (accessed January 29, 2024).
10See https://www.epa.gov/cira (accessed January 29, 2024).
11See LOCA’s website to view details on the dataset: https://loca.ucsd.edu/. (accessed February 15, 2024).
12See https://ldas.gsfc.nasa.gov/nldas/v2/forcing (accessed February 15, 2024).
13See https://www.ncei.noaa.gov/access/metadata/landing-page/bin/iso?id=gov.noaa.ncdc:C00332 (accessed February 25, 2024).
to higher spatial resolutions and improved accuracy, and reviewing the available datasets regularly would ensure that the datasets used reflect the state of the science.
In the coming years, the USGCRP is expected to develop a new program to provide climate services, including to the rest of the federal government and to the public. Climate services are defined by the Office of Science and Technology Policy as “scientifically-based, usable information and products that enhance knowledge and understanding about the impacts of climate change on potential decisions and actions” (Fast Track Action Committee on Climate Services, 2023). As USGCRP develops its approach for providing climate services, CEQ could be a client for these data, and CEQ and USGCRP could work together to ensure that the climate services data are responsive to the needs of CEJST for future incorporation into the tool.
Potentially important indicators and datasets that could be considered for inclusion in future versions of CEJST are heat and future climate risks. Compared with CEJST’s current approach, which uses datasets that assume a single climate projection and 30-year time horizon, using a probabilistic approach and longer time horizons can provide a more holistic view of potential future climate risks. Working with other federal agencies, such as NOAA and USGCRP, to produce and access relevant climate data can ensure that the datasets used in the tool are robust and consistent with other federal efforts.
Energy
The energy burden category includes two indicators: energy cost and PM2.5. Energy cost is measured as the average proportion of annual household income spent on energy. Energy cost data come from the Department of Energy’s Low-Income Energy Affordability Data (LEAD) Tool14 and is provided at the census-tract level for all 50 states, the District of Columbia, and Puerto Rico (excluding Pacific Island territories). LEAD Tool estimates of energy cost are modeled from the U.S. Census Bureau’s ACS 2020 Public Use Microdata Samples and U.S. Census housing data from the 2016 5-year ACS.15
PM2.5 is a commonly used metric for air pollution. The PM2.5 data are represented as annual average concentrations for 2019, derived from a model-monitor fusion approach implemented by EPA. The data are also used in the EPA’s EJScreen tool and are available for all 50 states, the District of Columbia, and Puerto Rico, but not other island territories. PM2.5 is a criterion air pollutant that is regulated by the EPA through annual average and 24-hour average National Ambient Air Quality Standards.16 PM2.5 itself is a mixture of chemical components that exist in both solid and liquid form. A small fraction of PM2.5 is emitted directly (“primary PM2.5“), and a larger fraction is formed in the atmosphere through chemical interactions (“secondary PM2.5“), although the specific sources, chemical composition, and fraction that is primary versus secondary
___________________
14See https://www.energy.gov/scep/slsc/low-income-energy-affordability-data-lead-tool (accessed February 15, 2024).
15See https://www.census.gov/programs-surveys/acs (accessed February 15, 2024).
16For more on National Ambient Air Quality Standards, see https://www.epa.gov/criteria-air-pollutants/naaqs-table (accessed February 15, 2024).
depend on geographic location, nearby and upwind emissions, and atmospheric conditions. CEJST documentation does not explain why PM2.5 is listed under the Energy burden category, given that PM2.5 originates from a variety of sources beyond energy generation. Other major emission source sectors for PM2.5 and precursor emissions include transportation, agriculture, industry, wildfires, and dust. A portion of PM2.5, diesel PM, is included in the Transportation burden category in CEJST. As stated previously, the committee does not focus on indicator placement under specific burden categories because the indicator groupings are irrelevant to the identification of DACs in the CEJST’s current formulation.
The rationale for including PM2.5 but not other major air pollutants (e.g., ozone, nitrogen dioxide) is not discussed in CEJST technical support documentation (CEQ, 2022a), therefore preventing the committee from understanding this decision and underscoring the need for clear and thorough documentation. While PM2.5 is the largest contributor to the burden of disease from ambient air pollution, ambient ozone is another criterion air pollutant linked with premature mortality that is of interest to community members (NASEM, 2023a). National-scale, spatially complete datasets on ozone concentrations are available. For example, EPA’s EJScreen tool includes ozone, using the “peak concentration metric” of the annual mean of the 10 highest maximum daily 8-hour concentrations. The ozone concentration data are from the same model-monitor fusion approach used for the PM2.5 dataset that is currently included in CEJST. Nitrogen dioxide (NO2) is another important air pollutant that contributes to ozone formation and is associated with poor health outcomes. As NO2 is often considered a marker of traffic-related air pollution, this pollutant is discussed in the Transportation burden category section below.
The major sources of PM2.5 and the spatial distribution of PM2.5 are in a period of flux due to a variety of factors. Stringent emission standards are bringing emissions down within the energy generation (Henneman et al., 2023) and transportation sectors (Anenberg and Kalman, 2019), while climate change is fueling longer, more intense wildfire smoke seasons (Burke et al., 2021; O’Dell et al., 2019) and more airborne soil dust (Achakulwisut, Mickley, and Anenberg, 2018), leading to high interannual variability and, potentially, stagnation of PM2.5 declines (Wei et al., 2023). The high interannual variability in PM2.5 driven by wildfire severity can change spatial and demographic patterns of exposure. It may be important to use multiyear average PM2.5 concentrations to account for this interannual variability. In addition to annual (or multiyear) averages, including an indicator for poor air quality days can capture wildfire smoke episodes.
The dataset used for PM2.5 in CEJST has approximately 12-km grid resolution and is too coarse to capture intraurban concentration gradients that might lead to exposure disparities. In addition, newer datasets from the scientific community have advanced beyond the approach used to develop the CEJST dataset by incorporating satellite measurements of aerosol optical depth (e.g., van Donkelaar et al., 2021) and, in some cases, many other data types in a machine learning process (e.g., Amini et al., 2023). These more advanced and higher-resolution exposure assessment approaches (~1-km grid resolution) are increasingly used within the scientific community, including for air pollution epidemiology (Di et al., 2019). As previously mentioned in Box
5.3, a comparison of the CEJST dataset with two higher-resolution datasets from the scientific community found that the three datasets differ substantially regarding which tracts are most overburdened within individual urban areas, though nationwide PM2.5 disparities were more consistent between the datasets (Carter et al., 2023). This analysis underscores the importance of analyzing datasets and evaluating them both technically and with community partners to identify the most appropriate dataset to represent the indicator. As satellite-based and community-collected datasets will improve over time with hourly atmospheric composition data from geostationary satellites, such as the TEMPO instrument launched by NASA in April 2023, PM2.5 concentrations derived using satellite data as an input are likely to play an increasingly important role in tracking air pollution and associated disparities across federal governmental activities.
Considering other indicators of air pollution beyond annual average PM2.5—including ozone and poor air quality days—would capture additional spatial and temporal patterns of exposure to health-harmful air pollution, especially as these pollutants worsen under climate change. The energy burden index used within the DOE’s Energy Justice Mapping Tool provides an opportunity to include additional aspects of disadvantage, including the percent of households not connected to gas or electric grids and the number and average duration of power outages.
Other indicators that could be considered in the Energy burden category include those used by the Department of Energy (DOE) in its own Energy Justice Mapping Tool—Disadvantaged Communities Reporter.17 These include indicators for the percentage of households that use a fuel other than grid-connected gas or electricity, or solar energy as their main heat source (data from DOE LEAD); average duration of power outage events (in minutes) that occurred for all census tracts in each county from 2017 to 2020 (data from DOE Office of Electricity); number of power outage events that occurred for all census tracts in each county from 2017 to 2020 (data from DOE Office of Electricity); and transportation costs as percentage of income for a typical household in the region (data from Center for Neighborhood Technology).
Health
The health burden category currently includes four indicators: asthma, diabetes, heart disease, and life expectancy at birth. Asthma, diabetes (among people ages 18 years and older), and heart disease (among people ages 18 years and older) data come from the CDC’s PLACES: Local Data for Better Health project (PLACES) data18 for 2016–2019. PLACES provides model-based, population-level analysis and community estimates of health measures down to the census tract across all 50 states and the District of Columbia (but not U.S. territories, i.e., American Samoa, the Commonwealth of the Northern Mariana Islands, Guam, Puerto Rico, and the U.S. Virgin Islands). Life expectancy data come from the CDC’s U.S. Small-Area Life Expectancy Estimates Project
___________________
17See https://energyjustice.egs.anl.gov/ (accessed January 10, 2024).
18See https://www.cdc.gov/places/index.html (accessed February 15, 2024).
(USALEEP)19 from 2010 to 2015. The USALEEP project produced estimates for most U.S. census tracts. The rationale for selecting the four measures currently included in the tool is not reflected in the CEJST Technical Documentation (CEQ, 2022a).
E.O. 14008 did not specifically include health burden as a driving factor for focused investments under the Justice40 Initiative. However, poor health makes communities more vulnerable to the health outcomes associated with climate change, pollution, and other CEJST burden categories. Currently, health data and exposure data are separate burden categories in CEJST and are not integrated. Burden disparities can be amplified when considering health risks associated with exposures (as opposed to considering only the exposure itself) since exposure data alone do not adequately indicate who is adversely affected by that exposure and to what degree. For example, many studies have found that air pollution is inequitably distributed, with communities of color experiencing higher exposure levels compared with the national average or the white population. When these higher exposures for communities of color are combined with information on vulnerability to those exposures—driven by higher rates of preexisting disease, lack of access to high-quality health care, and less ability to take action to reduce exposure—disparities are further amplified (e.g., Kerr et al., 2023; Southerland et al., 2021). The converse of adverse effects from simultaneous disproportionate exposure and vulnerability is that the communities with both high exposure and vulnerability are those who benefit most from reducing exposure and vulnerability—the goal of the Justice40 program. While this report does not address methods for determining which communities will benefit from government programs under the Justice40 Initiative and by how much, the report does discuss how consideration of cumulative impacts could be incorporated into CEJST in Chapter 6.
As of December 2023, PLACES has estimates of 36 health measures—13 for health outcomes, 9 for preventive services use, 4 for chronic disease–related health risk behaviors, 7 for disabilities, and 3 for health status.20 Among those 36, two stand out for their potential to provide unique information compared with the other health outcomes currently included in CEJST. These are cancer among adults 18 years and older and access to health insurance among those 18–64 years. Other health outcomes from PLACES may be less relevant (e.g., all teeth lost, arthritis) or overlap with those currently included in CEJST in terms of biological systems (e.g., chronic obstructive pulmonary disease, stroke, coronary heart disease) and spatial patterns. Cancer is both relevant—it is affected by climate change, legacy pollution, and other indicators in CEJST (Winstead, 2023)—and is unlikely to be spatially aligned with the other CEJST indicators. The lack of health insurance among adults ages 18–64 years is a measure within the PLACES Prevention category. According to the latest PLACES data based on 2020 and 2021 Behavioral Risk Factor Surveillance System data,21 approximately 11.7 percent of U.S. residents did not have health insurance. However, since lack of health
___________________
19See USALEEP data at https://www.cdc.gov/nchs/nvss/usaleep/usaleep.html (accessed February 15, 2024).
20See the full list of PLACES health measures at https://www.cdc.gov/places/measure-definitions/health-outcomes/index.html (accessed February 15, 2024).
21See https://www.cdc.gov/brfss/index.html (accessed February 15, 2024).
insurance varies substantially with citizenship status, ethnicity, income, geography, age, and race (Keisler-Starkey, Bunch, and Lindstrom, 2023), analyzing and understanding spatial correlations with other CEJST socioeconomic indicators would be informative.
It is not clear from technical documentation whether the asthma prevalence dataset used in CEJST includes data on individuals of all ages or only adults. The CEJST Technical Support Document (CEQ, 2022a) does not mention age for the asthma indicator, but the PLACES documentation indicates that the asthma prevalence data is for 18 years of age and older. Pediatric asthma prevalence has been shown to be inequitably distributed in major cities across the United States (Kane, 2022; Roberts et al., 2006). In addition, while some of the indicators in CEJST raise the risk of asthma onset, asthma exacerbation may be more greatly affected by differences in the degree of asthma management in different neighborhoods. To date, data on pediatric asthma prevalence and asthma exacerbation are not available at the tract level nationally, but such datasets may be developed in the coming years.
Access to healthcare would be another appropriate indicator since rural communities tend to have far fewer doctors, specialists, and hospitals in their neighborhoods than urban communities. Systemic discrimination within the healthcare system also leads to disparities in healthcare and health outcomes (Williams and Rucker, 2000). The Centers for Medicare and Medicaid Services (CMS) produces nationally available data on the geography of hospital and nonhospital healthcare facilities,22 as well as clinicians, down to individual street addresses.23
In terms of data quality, it is important to note that the PLACES data are modeled using small-area estimation, a multilevel statistical modeling technique, and do not represent observational data. As such, these data are subject to uncertainties but are not restricted for privacy protections as administrative data often are. PLACES provides 95 percent confidence intervals of modeled estimates generated using a Monte Carlo simulation. In addition, the CDC cautions users against using these estimates for program or policy evaluations because the small-area model cannot detect the effects of local interventions.24 The annual estimates provide a sufficient temporal resolution, and higher-temporal-resolution (e.g., daily, monthly, seasonal) data are not necessary for CEJST’s purposes.
Documentation of the rationale for including the four indicators included in CEJST would provide useful information for end users of the tool and other tool developers and enhance tool transparency. Including additional indicators, such as cancer and lack of health insurance, that are distinct from the four already included can capture additional communities who are experiencing disproportionate health burdens. Although no such data currently exist to the committee’s knowledge, considering pediatric asthma onset
___________________
22See CMS’s Provider of Services File—Hospital & Non-Hospital Facilities at https://data.cms.gov/provider-characteristics/hospitals-and-other-facilities/provider-of-services-file-hospital-non-hospital-facilities (accessed February 15, 2024).
23See CMS’s National Downloadable File at https://data.cms.gov/provider-data/dataset/mj5m-pzi6 (accessed February 15, 2024).
24Read CDC’s full description of its PLACES 2023 data release at https://data.cdc.gov/500-Cities-Places/PLACES-Local-Data-for-Better-Health-County-Data-20/swc5-untb/about_data (accessed February 16, 2024).
and asthma exacerbation, two outcomes that are highly heterogeneous between neighborhoods and broader geographic areas, would complement the adult asthma prevalence indicator that is currently used in CEJST. Integrating health burdens with other burden categories and indicators to identify DACs could more closely align with the goal of the Justice40 program to benefit underserved communities.
Housing
The housing burden category includes five indicators: experienced historic underinvestment, housing cost, lack of green space, lack of indoor plumbing, and lead paint. Historic underinvestment is represented by redlining maps created by the federal government’s Home Owners’ Loan Corporation (HOLC) between 1935 and 1940.25 The boundaries in the HOLC maps were converted to census tracts by the National Community Reinvestment Coalition. Within CEJST, census tracts that have National Community Reinvestment Coalition scores of 3.25 or more out of 4 are considered to have experienced historic underinvestment. This indicator is only available for tracts that were included in the original HOLC maps in certain metro areas across the United States. Housing cost is represented by the share of households that are earning less than 80 percent of Housing and Urban Development’s (HUD’s) Area Median Family Income and are spending more than 30 percent of their income on housing costs. Data are from the Comprehensive Housing Affordability Strategy dataset from 2014 to 2018 and are available for all U.S. states, the District of Columbia, and Puerto Rico. This dataset is also used for the lack of indoor plumbing indicator. Lack of green space is represented by the share of land with developed surfaces covered with artificial materials such as concrete or pavement, excluding cropland used for agricultural purposes. Data are from the Multi-Resolution Land Characteristics Consortium’s Percent Developed Imperviousness dataset for 201926 and are available for all contiguous U.S. states and the District of Columbia. The lead paint indicator is represented by the share of homes built before 1960, which, according to the CEJST documentation, indicates potential lead paint exposures (CEQ, 2022a). Tracts with median home values above the 90th percentile are excluded as they are considered less likely to face health risks from lead paint exposure. Data on lead paint are from the ACS for 2015 to 2019 and cover all U.S. states, the District of Columbia, and Puerto Rico. The tool does not currently include other important exposures to lead, including lead in drinking water (see Box 5.4) and childhood exposure to contaminated soil, which remains a legacy pollutant due to historic use of leaded gasoline and industrial activity, such as battery incineration (Laidlaw et al., 2017; Laidlaw, Mielke, and Filippelli, 2023; Zartarian et al., 2023).
___________________
25See Chapter 2, Box 2.1 for more on redlining.
26See https://www.mrlc.gov/data/nlcd-2019-percent-developed-imperviousness-conus (accessed February 15, 2024).
BOX 5.4
Lead in Drinking Water
An infamous recent drinking water emergency was the result of a poorly maintained drinking water infrastructure—the lead-contaminated public drinking water in Flint, Michigan. Water was contaminated as a result of a change in the source water, increased corrosion of leaded pipes, and chronic inadequacies in maintenance, monitoring, and reporting (Denchak, 2018; MCRC, 2017; Mohai, 2018). Residents had adverse health effects and were advised not to drink the water. Flint is not alone. Other studies show that chronic lead exposure from old, leaded water service lines across the country (Olson and Stubblefield, 2021), as well as breakdowns in urban public water systems resulting in chronic boil water alerts, have disproportionate impacts on lower-income children and communities of color (Greenfield, 2023; Kim, M. et al., 2023). For at least the last decade, researchers have found that poor and, more often, minority communities were more consistently and disproportionately exposed to drinking water contamination (Balazs and Ray, 2014; Balazs et al., 2011; Berberian et al., 2023; Konisky, Reenock, and Conley, 2021; Martinez-Morata et al., 2022; Pullen Fedinick, Taylor, and Roberts, 2019; Ravalli et al., 2022; Schaider et al., 2019; Stillo and MacDonald Gibson, 2017).
Although lead drinking water pipes in community water systems are the primary source of lead in drinking water (EPA, 2016b), there is relatively little data on leaded pipes at a national scale. EPA was mandated by America’s Water Infrastructure Act of 2018 to evaluate and report on the cost of replacing lead service lines in its quadrennial Drinking Water Infrastructure Needs Survey and Assessment (DWINSA). In 2021, EPA collected service-line-material information for the seventh DWINSA. That report estimated that there were 9.2 million lead service lines across the country, primarily concentrated in the eastern half of the country, and especially in states in the South, Midwest, and Northeast. However, these data are only available at the state level.a EPA is implementing the Lead and Copper Rule Improvements (LCRI), which require water systems to identify and make public the locations of lead service lines,b and issued Guidance for Developing and Maintaining a Service Line Inventory in 2022. The number of lead water lines will remain until there are complete inventories of service lines (EPA, 2023c).
__________________
a See EPA’s 7th Drinking Water Infrastructure Needs Survey and Assessment dashboard at https://www.epa.gov/dwsrf/epas-7th-drinking-water-infrastructure-needs-survey-and-assessment.
b See proposed Lead and Copper Rule Improvements (LCRI) at https://www.epa.gov/ground-water-and-drinking-water/proposed-lead-and-copper-rule-improvements (accessed February 26, 2024).
Legacy Pollution
The Legacy Pollution burden category includes five indicators: abandoned mine land, formerly used defense sites, proximity to hazardous waste facilities, proximity to Superfund sites (National Priorities List),27 and proximity to Risk Management Plan (RMP) facilities. The abandoned mine land indicator is represented by the presence of an abandoned mine left by legacy coal mining operations, identified using data from the Abandoned Mine Land Inventory System (e-AMLIS) from the Department of the Interior for 2017. The data cover all U.S. states and the District of Columbia. Formerly used defense sites are from the U.S. Army Corps of Engineers for 2019 and cover all U.S. states and the District of Columbia. Proximity to hazardous waste facilities, Superfund sites, and RMP facilities use data from various EPA databases (as compiled by EPA’s EJScreen) for 2020 for all U.S. states, the District of Columbia, and Puerto Rico, and all datasets use a 5-km boundary around facility sites as a measure of proximity. These three proximity indicators consider the number of facilities in each indicator category within 5 km divided by the distance in kilometers.
The EPA released a memorandum, “Strengthening Environmental Justice Through Criminal Enforcement” (EPA, 2021), on the need to strengthen tools for detecting environmental crimes28 in overburdened communities. Information from the EPA’s criminal enforcement program might be useful in strengthening EJ tools, including CEQ tools. EPA’s ECHO (Enforcement and Compliance History Online)29 database provides data on enforcement actions for all EPA-regulated facilities, including permit data, inspection/compliance evaluation dates and findings, violations of environmental regulations, enforcement actions, and penalties assessed. However, these data are not easily accessible or interpretable because the violation codes are unclear and often nonspecific, and the specific circumstances underpinning the rationale for violations are often not made public. Other information may be needed to represent the pollution activities.
Transportation
The transportation burden category includes three indicators: diesel particulate matter (PM) exposure, transportation barriers, and traffic proximity and volume. The dataset used for the diesel PM indicator comes from the EPA EJScreen tool and, according to the CEJST documentation (CEQ, 2022a), is originally sourced from the National Air Toxics Assessment from 2014 (EJScreen documentation indicates the source as the 2017 Air Toxics Update).30 It is available for all 50 states, the District of Columbia,
___________________
27Learn more about the National Priorities List (NPL) on EPA’s website at https://www.epa.gov/superfund/superfund-national-priorities-list-npl (accessed February 16, 2024).
28Environmental crimes are carried out by “individuals and corporations that have violated laws designed to protect the environment, worker safety, and animal welfare,” according to the Environmental Crimes Section of the U.S. Department of Justice: https://www.justice.gov/enrd/environmental-crimes-section/ (accessed February 26, 2024).
29See https://echo.epa.gov/ (accessed February 16, 2024).
30See EPA Air Toxics Screening Assessment, 2017 Results: https://www.epa.gov/AirToxScreen/2017-airtoxscreen-assessment-results (accessed February 16, 2024).
and Puerto Rico. Transportation barriers represent the average relative cost and time spent on transportation relative to all other tracts and only applies to census tracts with populations greater than 20 people. The source of the transportation barriers dataset is the U.S. Department of Transportation (DOT) Transportation Access Disadvantage category utilized in the DOT Equitable Transportation Community Explorer (ETCE).31 Traffic proximity and volume are defined as the number of vehicles (average annual daily traffic) at major roads within 500 meters, divided by distance in meters. The data are sourced from EPA’s EJScreen tool and are for the year 2017 and all 50 states, the District of Columbia, and Puerto Rico.
While the committee was not tasked with evaluating the DOT ETCE, participants of the committee’s public workshop did suggest that transportation metrics be considered for use in CEJST (NASEM, 2023a). The DOT ETCE User Guide suggests that CEJST be used to identify DACs and then the DOT tool be used to better understand the transportation disadvantage component of CEJST and the ETCE’s Transportation Insecurity component—which could ensure that DOT’s investments address transportation-related causes of disadvantage.32 Since DOT is using additional indicators beyond those included in CEJST, the committee does not suggest additional transportation access and volume indicators. However, there are two areas that might be considered by CEQ: (1) a closer proxy for transportation-related air pollution than diesel PM, and (2) noise pollution.
There are several limitations with the diesel PM metric when characterizing the impact of transportation on air quality, including that vehicles using other fuels besides diesel are also polluting and diesel PM is difficult to observe on a nationwide basis, requiring reliance on estimation approaches. Compared with diesel PM, NO2 may be a more appropriate indicator of traffic-related air pollution and is more directly observable using space-based Earth-observing satellites. NO2 is linked with respiratory effects, asthma development, and premature mortality (HEI, 2022) and reacts with other chemicals in the atmosphere to form both PM2.5 and ozone, the two largest contributors to the burden of disease from air pollution in the United States. NO2 is more spatially heterogeneous and inequitably distributed than PM2.5 (Kerr, Goldberg, and Anenberg, 2021; Kerr et al., 2023) since NO2 has a shorter atmospheric lifetime (i.e., hours compared with days) and more limited influence from regional pollution sources (e.g., agriculture, wildfire smoke, dust). Heavy-duty vehicles are a leading source of NO2 in urban areas of the United States and contribute to disproportionate NO2 exposure among communities of color and with lower income and educational attainment levels (Demetillo et al., 2021; Kerr, Goldberg, and Anenberg, 2021).
Since the diesel PM dataset used in CEJST is derived through modeling rather than observation, the time needed to update these datasets introduces a time lag of several years. Furthermore, the spatial pattern of truck traffic and resulting diesel PM2.5
___________________
31See DOT’s ETCE and its user guide at https://experience.arcgis.com/experience/0920984aa80a4362b8778d779b090723 (accessed February 12, 2024).
32See DOT’s webpage on the Justice40 Initiative at https://www.transportation.gov/equity-Justice40 (accessed February 16, 2024).
emissions and concentrations are changing rapidly: warehousing associated with the booming e-commerce industry is increasing truck trips, truck idling, noise, and traffic-related air pollution in some places, which are increasingly nearer to population centers (e.g., Jaller and Pahwa, 2020). Additionally, oil and gas development results in heavy truck traffic (e.g., Adgate, Goldstein, and McKenzie, 2014) in new locations, such as the Permian Basin in Western Texas and the Bakken field in North Dakota. Neither of these rapidly evolving industries would show up in a diesel PM2.5 dataset that is several years old. However, these changes are captured by satellite-based NO2 datasets. A more observational dataset, such as satellite NO2, could be a valuable metric for CEQ to consider in future CEJST versions, especially as new geostationary satellites, such as TEMPO launched by NASA in 2023,33 will produce hourly measurements over the United States in the coming years.
It may also be useful to have an indicator for assessing transportation-related noise pollution, which is associated with cardiovascular morbidity and mortality (Münzel, Sørensen, and Daiber, 2021), mental health outcomes (Gong et al., 2022), and other health effects. Transportation-related noise data are available from the DOT Bureau of Transportation Statistics’ National Transportation Noise Map and are available for the United States at the tract level (Seto and Huang, 2023). The estimates include noise levels related to aviation, roadway, and rail traffic. These data may meet the criteria for inclusion in CEJST if CEQ and community partners consider them to be relevant for the purposes of CEJST.
Water and Wastewater
The water and wastewater burden category includes two indicators: underground storage tanks (USTs) and releases and wastewater discharge. Both USTs and releases and wastewater discharge indicators use datasets compiled by EPA’s EJScreen tool and are available for all U.S. states, the District of Columbia, and Puerto Rico. The UST indicator is drawn from the EPA’s UST Finder for 2021,34 which includes any UST and “any underground piping connected to the tank that has at least 10 percent of its combined volume underground” (EPA, 2024). Federal UST regulations apply only to UST systems above specific thresholds storing either petroleum (e.g., gasoline, diesel, fuel oil) or certain hazardous substances (e.g., ammonia, asbestos, benzene, chromium). More than 99 percent of federally regulated USTs contain petroleum, and most of those are owned or managed by service stations and convenience stores, or by vehicle fleet service operators and local governments. The greatest potential hazard from USTs is the leakage of hazardous substances into the surrounding soil and contamination of groundwater. UST releases are the most common source of groundwater contamination; petroleum is the most common contaminant (EPA, 2023a). This is notable given that nearly one-half of all Americans get their drinking water from groundwater (EPA, 2024). Underground storage tanks and releases are represented by a weighted formula of the
___________________
33See https://science.nasa.gov/mission/tempo/ (accessed March 8, 2024).
34See https://www.epa.gov/ust/ust-finder (accessed February 26, 2024).
density of leaking underground storage tanks and the number of all active underground storage tanks within 1,500 feet of the census tract boundaries.
The wastewater discharge indicator utilizes information from the EPA’s Discharge Monitoring Report (DMR) Loading Tool35 along with the EPA’s Risk-Screening Environmental Indicators (RSEI) model36 to estimate the relative risk to a census-block group from exposure to pollutants in downstream water bodies (EPA, 2023b). The DMR Loading Tool includes data on industrial and municipal point-source wastewater dischargers that are subject to a subset of permits under the National Pollutant Discharge Elimination System (NPDES),37 as well as wastewater pollutant discharge data from EPA’s Toxic Release Inventory (TRI). Wastewater discharge is represented by the RSEI-modeled toxic concentrations at stream segments within 500 meters, divided by the distance in kilometers. The data are for 2020. Both USTs and releases and wastewater discharge indicators use datasets compiled by EPA’s EJScreen tool and are available for all U.S. states, the District of Columbia, and Puerto Rico.
Data on USTs and wastewater discharge do not capture the universe of potential pollutant releases to groundwater or surface water. Rather, they include data only on facilities or activities subject to federal regulation, specific reporting requirements that often focus on larger sources and limited ranges of pollutant categories. Federal regulations and data collection around USTs do not apply to smaller, noncommercial farm and residential tanks; heating oil tanks on premises where fuel is used; tanks in underground spaces such as basements or tunnels; septic tanks and storm and wastewater collection systems; flow-through process tanks; tanks small than 110 gallons; and emergency spill and overfill tanks. Several states and local regulatory authorities have more stringent rules around USTs than the federal government and may collect data on a wider range of USTs, but state-specific data may not be included in the UST Finder dataset.
The DMR Loading Tool38 includes information on discharges for more than 60,000 facilities across the United States. Not all facility, permit, or discharge monitoring data are uploaded to the NPDES database, and data may be reported differently. Pollutants for which discharge permits are not required are not required to be reported, and data related to many regulated sources of wastewater discharge are not available. These include wastewater releases from industrial facilities connected to public treatment works sewerage systems regulated through the Clean Water Act (CWA); CWA Biosolids Program–related biosolid monitoring data; releases related to wet-weather events; construction activity–related discharges; combined and sanitary sewer overflows; and discharges related to concentrated animal feeding operations.
TRI wastewater discharge data mentioned above are limited to industrial facilities with more than 10 employees, and not all industry sectors are included. Reporting emphasizes toxic pollutant discharges. Common wastewater pollutants such as total
___________________
35For more information on the DMR Loading Tool data, see https://echo.epa.gov/trends/loading-tool/resources/about-the-data (accessed February 26, 2024).
36See https://www.epa.gov/rsei (accessed February 26, 2024).
37See https://www.epa.gov/npdes (accessed February 26, 2024).
38See https://echo.epa.gov/trends/loading-tool/resources/about-the-data#:~:text=The%20Loading%20Tool%20contains%20information,under%20the%20Clean%20Water%20Act (accessed March 6, 2024).
suspended solids and biochemical oxygen demand are not included. Data reported are often derived statistically rather than directly measured. Some chemicals are reported as classes rather than individual compounds, the result being that the potential toxicity of releases could be estimated inaccurately given the variation in toxicity of individual compounds in a class (EPA, 2022b).
Drinking water burdens vary geographically and by community and can disproportionately affect poor communities and people of color (see Box 5.5 for examples demonstrating observed relationships). Although USTs and wastewater dischargers are nearly ubiquitous across the country—implying a widespread risk of groundwater and surface water contamination—not all communities are equally dependent on or even exposed to their local ground or surface waters. Many communities, especially urban communities, rely on piped water that may come from sources distant from the community. Their water is often treated but also subject to potential contamination from a distant source or by inadequately maintained infrastructure, treatment, or conveyance (see Box 5.4 on lead in drinking water). Pollution of water sources is not the only way in which communities experience burdens or unequal treatment regarding water. These burdens include water access, water system services, and infrastructure.
Studies of problems and disparities in drinking water systems have relied on data from the EPA Safe Drinking Water Information System (SDWIS) database, which records SDWA violations and provides data for all U.S. states and territories.39 However, SDWIS does not capture all sources of drinking water, and reporting may be uneven. Although states are required to report drinking water system information to the SDWIS, audits of the system show that states often fail to report many violations. For example, the SDWIS did not include lead violations for Flint, Michigan’s lead crisis from 2014 to 2017 (Pullen Fedinick, Taylor, and Roberts, 2019). SDWIS covers a large part of the population, but it is only consistently available at the county level, and it only applies to community drinking water systems that serve at least 25 people or have more than 15 connections. Furthermore, the SDWA does not cover private wells or other noncommunity sources of drinking water (e.g., water taken directly from rivers, streams, or creeks). Private wells supply water for roughly 16 percent of all housing units in the United States (EPA, 2023d). There is no nationwide testing required for those wells, and less testing is done, generally, for private wells than for public wells (Murray et al., 2021). The EPA has developed a mapping system to identify the density of private wells down to the census block group across the country.40 Dependence on private wells is highest in rural communities, on Tribal lands, in unincorporated places, and for farmworkers living in fields or labor camps. The latter has been shown to be especially susceptible to contamination by chemical and biological hazards from pesticides, fertilizers, and animal and human waste (Balazs et al., 2011; Bischoff et al., 2012; Lohan, 2017). Some communities, such as colonias along the southwestern border and unin-
___________________
39See https://health.gov/healthypeople/objectives-and-data/data-sources-and-methods/data-sources/safe-drinking-water-information-system-sdwis#:~:text=The%20Safe%20Drinking%20Water%20Information.approximately%20156%2C000%20public%20water%20systems (accessed March 6, 2024).
40See EPA Private Domestic Well Map at https://experience.arcgis.com/experience/be9006c30a2148f595693066441fb8eb (accessed March 6, 2024).
BOX 5.5
Relationship Between Race and Clean Water Compliance
In a nationwide study of violations of the Clean Water Act requirement for drinking water quality reports to communities, Bae and Kang (2022) found a statistical relationship between rule violation occurrence and the proportion of Hispanic residents and the poverty rate of host counties. Although these patterns occurred across the country, violations were concentrated in Texas, Oklahoma, and Louisiana. Systematic lack of information on the quality of drinking water sources compromises the ability of residents to understand or respond to risks to their health and reduces the opportunity for holding community water systems accountable, potentially exacerbating other forms of environmental inequities. Bae, Kang, and Lynch (2023) examined the length of time that community water systems across the country were out of compliance with Safe Drinking Water Act (SDWA) regulations from 2015 to 2019 (e.g., mandated treatment techniques or violations of any maximum contaminant levels) and the racial composition of those communities. They found that noncompliant water systems in counties with higher proportions of both Black and Hispanic residents took longer to be returned to compliance than water systems serving a larger percentage of white residents. In general, as the percentage of white residents in an area increased, the time to compliance decreased. Racial differences in noncompliance durations were not explained by differences in the income level or poverty rates of those same communities. The implication is that Black and Hispanic residents systematically experience longer periods of noncompliance for their drinking water systems, and that enforcement of these regulations is unequal. Their findings complement a previous nationwide study conducted by the Natural Resources Defense Council (Pullen Fedinick, Taylor, and Roberts, 2019), which found that SDWA violations were more likely in counties with racial, ethnic, and language vulnerability, lower-quality housing conditions, and less transportation access. Racial, ethnic, and language vulnerability were most strongly related to the length of time out of compliance. More generally, the NRDC analysis observed that community water systems serving fewer than 3,300 people—those more likely to serve low-income, vulnerable populations, face disproportionate hazards and lack resources to address the issues (EPA, 2016a)—account for greater than 80 percent of violations generally and specifically of health-based violations.
corporated communities, lack basic drinking water infrastructure and reliable access to potable water. An estimated 471,000 households—or 1.1 million people—lack a piped water connection, and unplumbed households in cities are more likely to be headed by people of color, earn lower incomes, and live in mobile homes (Meehan et al., 2020).
Workforce Development
A stated goal of E.O. 14008 is to address the economic challenges faced by DACs resulting from disproportionate negative impacts of climate change, pollution, and other burdens (including economic shifts) experienced by these communities. An important focus is on job creation in these communities through federal investment—in workforce development and in building a cleaner and more equitable economy that can offer well-paying jobs and opportunities for equitable economic growth. The workforce development burden category is aimed specifically at identifying communities where these kinds of investments might be beneficial (CEQ, 2022a).
The workforce development burden category in CEJST includes four direct indicators (linguistic isolation, low median income, poverty, and unemployment) plus a socioeconomic indicator specifically associated with indicators in this burden category. The datasets used for all five indicators within this burden category come from the ACS for 2015–2019 (or the 2010 Decennial Census41 in some island geographies). Two of the direct indicators are income related (median income as a share of area median income and share of people in households where income is at or below 100 percent of the federal poverty level), one measures linguistic isolation (share of households where no one over age 14 speaks English very well) and another directly measures unemployment (number of unemployed people as a part of the labor force).
Several aspects of the workforce development category differ from the other burden categories in CEJST. Firstly, the income-related indicators are treated as direct indicators of the need for workforce-related investment rather than serving as socioeconomic indicators. The socioeconomic indicator used for the workforce development burden category is instead a measure of educational attainment, namely, the percent of people ages 25 years or older whose highest level of education is less than a high school diploma (i.e., low educational attainment). Using low educational attainment as the socioeconomic indicator for workforce development implies that it is a necessary condition for a community to qualify as disadvantaged based on this burden category. To be classified as disadvantaged, a tract needs to be above 10 percent for this socioeconomic indicator (in addition to being at or above the 90th percentile for one of the other four indicators). The CEJST technical documentation does not include a rationale for the different threshold for this socioeconomic indicator (CEQ, 2022a).
Low income is still considered in this burden category, but the low-income indicators differ from the low-income indicator used for the other burden categories. One difference is in the threshold used to define low income—the federal poverty level. For
___________________
41See https://www.census.gov/programs-surveys/decennial-census/decade.html (accessed February 16, 2024).
the poverty indicator used in the workforce development burden category, the threshold is 100 percent of the federal poverty level, whereas the threshold is 200 percent of the federal poverty level for the socioeconomic indicator in the other burden categories. Thus, the definition of disadvantaged is narrower under the poverty indicator used in the workforce development category than in other burden categories. Again, a rationale for this difference is not clearly stated in the CEJST technical documentation (CEQ, 2022a).
Another difference is the inclusion of a second measure of low income through a measure of median income relative to median income in the area. Unlike the measures of income relative to the federal poverty level, this income measure allows for some differentiation across regions, which could capture, for example, differences in the cost of living. Thus, a community with low educational attainment could qualify as disadvantaged based on the workforce development burden even with an income level that is high relative to the nation as a whole, as long as it is low relative to its area. In this sense, the use of the relative measure can expand the definition of disadvantaged under the workforce development burden category. Again, the CEJST Technical Documentation does not provide a rationale for why a relative (area-specific) measure of low income is used here but not in defining low income through the socioeconomic indicator used for the other burden categories (CEQ, 2022a). Most of the EJ tools described in Chapter 4, including some of the state-level tools, only measure income based on federal poverty levels and therefore do not include area-specific measures that can account for differences in cost of living. However, some state-level tools do provide more localized income measures. For example, the Massachusetts Department of Public Health Environmental Justice Tool (MA-DPH-EJT)42 includes an indicator of whether the annual median household income in a community is 65 percent or less of the statewide annual median household income.
As noted above, the workforce development indicator is based on information about income, linguistic isolation, unemployment, and educational attainment. While these are possible proxies for measuring where federal and other investments could improve workforce outcomes for DACs, other possible proxies exist as well. For example, in addition to overall unemployment measures, which are based on questions related to employment status in the ACS, the survey also reports information on work status, which includes data on the median earnings for full-time, year-round male and female workers. Given the E.O. 14008 goal of fostering employment in well-paying jobs in DACs, measures of median earnings for full-time workers could provide useful information about the quality of jobs held by residents of a given community.
Another possible indicator of job quality based on the ACS is the percentage of working-age adults (ages 19–64 years) with employer-based health insurance. Employer-based health insurance benefits can constitute a substantial component of overall employee compensation (BLS, 2023), and access can vary by race and other worker characteristics (Lee et al., 2019). Thus, measures of the prevalence of employer-based health insurance for residents of a community can be another indicator of job
___________________
42See https://matracking.ehs.state.ma.us/Environmental-Data/ej-vulnerable-health/environmental-justice.html (accessed/February 17, 2024).
quality within the community. Notably, several of the EJ tools scanned in Chapter 4 use ACS-based indicators of lack of health insurance coverage (of any form, rather than simply employer-based) as socioeconomic indicators—including Centers for Disease Control and Prevention and Agency for Toxic Substances and Disease Registry Social Vulnerability Index, the FEMA NRI, the Department of Health and Human Services Environmental Justice Index, the DOE’s Energy Justice Mapping Tool, the Census Community Resilience Estimates, and the DOT ETCE. Although lack of health insurance coverage from any source can be a significant stressor, especially among disadvantaged populations (Brown et al., 2000), looking specifically at the lack of employer-based health insurance provides different information about the quality of jobs held by residents of a given community.
Some other EJ tools include burden indicators of workforce-related impacts of transitioning away from fossil fuels toward renewable energy. For example, the DOE’s Energy Justice Mapping Tool has a burden category for Fossil Dependence, which includes two workforce-related indicators (both from the U.S. Bureau of Labor Statistics): percent of total civilian jobs in the coal sector and percent of total civilian jobs in the fossil energy sector. However, the Workforce Development indicators currently in CEJST do not incorporate any measure of vulnerability or disadvantage related to fossil fuel dependency, except to the extent that employment losses that have already occurred (e.g., from reductions in coal mining or closure of coal-fired power plants) are reflected in the community’s unemployment rate.
More direct and inclusive measures of fossil-fuel dependency could be incorporated into CEJST. One example is the designation of “energy communities,” a concept used in the Inflation Reduction Act (IRA)43 to determine eligibility for increased tax credits under the law. This concept is broader than simply the fossil fuel dependency included in DOE’s Energy Justice Mapping Tool (coal and fossil energy employment). The IRA includes in the definition of an energy community: (1) any brownfield site, (2) any metropolitan or non-metropolitan statistical areas that have both high fossil fuel employment or tax revenue and an unemployment rate that is above the U.S. national average, and (3) any census tract (or directly adjoining census tract) with a coal mine closed after 1999 or a coal-fired power plant retired after 2009 (Interagency Working Group on Coal & Power Plant Communities & Economic Revitalization, 2023). Satisfying one of these conditions gives a binary classification of a community as either being an energy community or not.44 With an alignment of geographical scale (for brownfields and statistical areas), this designation could be included in CEJST.
However, as a recent study by Graham and Knittel (2024) points out, the definition of fossil-fuel dependency used in the IRA considers only fossil-fuel extraction and processing sectors and does not consider other sectors where production or consumption is fossil-fuel dependent (like manufacturing). In addition, it does not include fossil-fuel
___________________
43For more information on the IRA, see https://www.whitehouse.gov/cleanenergy/inflation-reduction-act-guidebook/ (accessed February 27, 2024).
44See this classification reflected in DOE’s map of Energy Community Tax Credit Bonus at https://arcgis.netl.doe.gov/portal/apps/experiencebuilder/experience/?data_id=dataSource_3-188bf476e26-layer-6%3A1494&id=a2ce47d4721a477a8701bd0e08495e1d (accessed February 27, 2024).
power generation. Moreover, its reliance on the current relative unemployment rate to determine eligibility makes it backward-looking rather than forward-looking in terms of impacts. Graham and Knittel (2024) propose an alternative measure of fossil fuel– related employment vulnerability, termed an employment carbon footprint (ECF), which incorporates both production and consumption channels of vulnerability. The ECF is a continuous index that is calculated at the county level using mostly publicly and nationally available data (Graham and Knittel, 2024). Because the ECF is a continuous index, percentiles can be used to define the counties that are most vulnerable to employment shocks from the transition away from fossil fuels. They compare the results of their analysis to the classification based on the IRA definition of energy communities and show that the IRA definition leads to significant false positives and false negatives, suggesting that the ECF provides a better indicator of fossil fuel–related employment vulnerability. Since the data sources used to calculate the ECF mostly meet the criteria for indicator inclusion in CEJST and the ECF’s calculated by Graham and Knittel (2024) are publicly available, it represents an alternative and potentially superior way to incorporate this type of vulnerability as an indicator in the workforce development burden category in CEJST.
Socioeconomic
As described relative to the burden categories above, CEJST combines two socioeconomic indicators with other indicators within these burden categories to determine whether a tract is identified as disadvantaged within CEJST: low income (seven of the eight burden categories) and high school education (workforce development category). Low income is defined as the 65th percentile or above for census tracts that have people in households whose income is less than or equal to twice the federal poverty level, excluding students enrolled in higher education. The indicator for high school education is based on fewer than 10 percent of people ages 25 years or older with a high school education (i.e., graduated with a high school diploma) (CEQ, 2022a). Based on the current formulation of CEJST, no variable is as important as the socioeconomic variable in identifying DACs since socioeconomic status is part of all 30 indicators under the categories of burden (see Box 5.6).
These socioeconomic indicators (as is true for other indicators in CEJST) do not capture heterogeneity within the tract (see Chapter 7 for more discussion on scale). For example, a participant in the committee’s information-gathering workshop provided an example of a tract that contained both expensive waterfront housing and low-income housing (NASEM, 2023a). A tract with a wide degree of socioeconomic heterogeneity may not be identified as disadvantaged within the tool because the indicators use tract-level averages. An indicator of socioeconomic inequality within the tract could be used to address this issue. Data on socioeconomic inequality are available at the tract level from the U.S. ACS 5-year estimates: the Gini Index of Income Equality.45 The Gini
___________________
45See https://www.census.gov/topics/income-poverty/income-inequality/about/metrics/gini-index.html (accessed February 28, 2024).
BOX 5.6
Low Income as a Socioeconomic Burden Indicator
Since seven of the eight burden categories (i.e., all except workforce development) in CEJST apply the low-income indicator (the percentage of the population in a census tract with income that is less than or equal to twice the federal poverty level) as the key socioeconomic burden indicator, it is important to explore its limitations.a First, the CEJST technical documentation does not explain why the 65th percentile for this variable was selected as the threshold value and how this influences the selection of disadvantaged tracts. A sensitivity analysis would be helpful to examine the effects of changing this cutoff threshold to a higher or lower percentile (see Chapter 7). Second and more importantly, there are inherent problems with using the federal poverty level in a national-scale tool. Although the federal poverty level measure is adjusted every year, the value applies to the entire country (except Alaska and Hawaii). Using a single value for all the United States in the tool may result in the characterization of income that is too high or too low because the cost of living across and within regions is not uniform. Changing the socioeconomic burden indicator in CEJST would affect which census tracts are designated as disadvantaged.
__________________
a While this section focuses mostly on the low-income indictor, the high school education indicator is discussed in more detail in the workforce development section above.
index is a summary measure of income inequality whose values range from 0 (perfect equality with all households in a tract having equal incomes) to 1 (perfect inequality with only one household having an income). This Gini index has been utilized as a measure of neighborhood-level coping capacity and socioeconomic vulnerability in previous environmental justice studies (Chakraborty et al., 2014).
Historically impoverished states may have more DACs than wealthier states. However, the current binary designation does not allow for further characterization of workforce development and education. Another situation not captured well by the indicators is the loss of resources resulting from absentee landowners living outside the tract (resources from the landowner do not circulate back into the tract; NASEM, 2023a).
Using a single, uniform low-income measure in a tool such as CEJST may not accurately reflect lived experiences even after doubling the standard poverty level and accounting for the cost of living. Other indicators have been suggested to inform income measurements. For example, the EPA Science Advisory Board (SAB), in their review of EJScreen, suggested using the criteria of the HUD’s Public Housing/Section 8 Income limits for low income,46 which is 80 percent of the area median income (SAB,
___________________
46See HUD’s FY 2023 methodology for determining Section 8 limits at https://www.huduser.gov/portal/datasets/il//il23/IncomeLimitsMethodology-FY23.pdf (accessed March 8, 2024).
2023). The SAB also suggested an indicator of wealth such as homeownership rate, median home value, or a weighted income metric, acknowledging that income-based measures deserve scrutiny because of the effects of income on all aspects of a person’s or household’s quality of life (e.g., nutrition, health care, and education).
A related issue is that metrics of income do not necessarily measure wealth. Wealth is a significant reflection of economic security or capacity and is impacted through generational economic movement and the ability to distribute wealth to descendants. As noted by the Horowitz, Igielnik, and Kochhar (2020), income measures the sum of earnings from employment, Social Security, business, or other sources, whereas wealth measures the value of owned assets (e.g., home, savings account) minus outstanding debts (e.g., loans, mortgage). The wealth gap between high-income and low-income households is larger than the income gap and is growing more rapidly (Horowitz, Igielnik, and Kochhar, 2020). One metric of wealth suggested by workshop participants is homeownership or the percentage of homeowners in a community (NASEM, 2023a).
Racism
CEJST does not include indicators of race or ethnicity in its determination of DACs, even though racism is a key driver of climate and economic injustice within the United States. Historical race-based policies in housing, transportation, and other urban development have had lasting impacts on environmental inequality today (see e.g., Ahmed, Scretching, and Lane, 2023; Bonilla-Silva, 1997; Bravo et al., 2022; Bullard, 2001; Bullard et al., 2007; Callahan et al., 2021; Chakraborty, J., et al., 2022; Collins, Nadybal, and Grineski, 2020; Commission on Social Determinants of Health, 2009; Dean and Thorpe, 2022; Dennis et al., 2021; Kodros et al. 2022; Konisky, Reenock, and Conley, 2021; Lane et al., 2022; Martinez-Morata et al., 2022; Mohai and Saha, 2007; O’Shea et al., 2021; Paradies et al., 2015; Trudeau, King, and Guastavino, 2023). Chapter 2 describes how race and ethnicity have been shown to be consistent and statistically independent predictors of a range of social, economic, health, and environmental inequities and are often more significant than economic indicators of socioeconomic status (Bullard et al., 2007; Liu et al., 2021; Mohai and Saha, 2007; Tessum et al., 2021) and provides empirical evidence of racism as a relevant factor in unequal exposures and outcomes. Socioeconomic status is not a substitute for measures of racial or ethnic differences. Although race and ethnicity are often strong predictors of inequity, scholars increasingly recognize that the problem is racism, not race or ethnicity (e.g., Adkins-Jackson et al., 2022; Bailey et al., 2017; Boyd et al., 2020; Braveman et al., 2022; Chadha et al., 2020; Gannon, 2016; Lett et al., 2022; NASEM, 2023b; Payne-Sturges, Gee, and Cory-Slechta, 2021; Smedley and Smedley, 2005).
Advocates and scholars of environmental justice and health inequities argue that measures of racism are necessary to identify and understand inequity or disadvantage. Measures of racism and its relationship to inequity need to be supported by the collection and reporting of disaggregated data on race and ethnicity to monitor the state of racial or ethnic disparities, to properly identify differences in population experiences of racism and inequity, and to avoid perpetuating or exacerbating structural racism
through the erasure of real differences between and within population groups (Adkins-Jackson et al., 2022; Braveman et al., 2022; Kauh, Read, and Scheitler, 2021; Polonik et al., 2023; Wang et al., 2022). Disaggregated data on race and ethnicity are readily available through the U.S. Census, and there is a large and growing range of indicators or measures of racism.
Measures of segregation or racism are listed in Appendix D, along with other measures for consideration in EJ tools that have come to the attention of the committee through its scan of tools, experience, and its workshop. Scholars of health inequities and racism increasingly recommend that structural racism is more properly measured through an index approach that better reflects its multidimensional nature (Adkins-Jackson et al., 2022; Dean and Thorpe, 2022; Furtado et al., 2023). Among the various indexes used by health researchers to capture structural racism, Furtado and others (2023) highlight three strategies that use geographic approaches to measure structural racism and which they argue are especially useful at quantifying the magnitude of its impacts: measures of residential segregation, racialized economic segregation, and indexes of disproportionality.
Measures of residential segregation are the most familiar and well-understood metrics of structural racism. A commonly used dataset is redlining data (see Box 2.1), which scholars have shown to be associated with a range of persistent environmental, health, and social inequities (Berberian et al., 2023; Blatt et al., 2024; Bompoti, Coelho, and Pawlowski, 2024; Hoffman, Shandas, and Pendleton, 2020; Kephart, 2022; Lane et al., 2022). CEJST 1.0 incorporates redlining maps as an indicator of “historic underinvestment” in the housing category. However, data on historic federally defined redlining maps are only available for a little over 200 of the largest cities across the country.47 There are no data for most communities and none for rural areas. There are numerous alternative measures of residential racial segregation and structural racism that are available nationally. Other measures of residential segregation can be calculated using Census data at various geographic scales. They include the Dissimilarity Index and the Isolation Index (housing segregation), the Gini coefficient (income segregation), the Index of Contemporary Mortgage Discrimination (Mendez, Hogan, and Culhane, 2011), the Index of Historical Redlining (Beyer et al., 2016), and dozens of others. The U.S. Census guidance appendix on housing segregation reviews the most common segregation indexes and their calculation (Iceland, Weinberg, and Steinmetz, 2002).
Measures of racialized economic segregation include the Index of Concentration at the Extremes (ICE) (Massey, 2001), which simultaneously evaluates the concentration of deprivation and privilege. Krieger and others (2017) created a modified version of ICE that measures spatial polarizations of race and income by comparing the number of people in the most privileged extreme (i.e., white residents above the 80th income percentile) to the number of people in the most deprived extreme (i.e., Black residents below the 20th income percentile). Unlike unidimensional measures of segregation,
___________________
47Read more about HOLC redlining maps in the University of Richmond project “Mapping Inequality: Redlining in New Deal America” at https://dsl.richmond.edu/panorama/redlining (accessed February 28, 2024).
measures of racialized economic segregation measure the intersection of both racial concentration and income concentration, which is more aligned theoretically with the multidimensional concept of structural racism and has the benefit of avoiding multicollinearity48 that occurs when using income and race as two separate indicators.
The Index of Disproportionality refers to a group of related approaches that use racial disparity indicators across an array of domains—political participation, employment and job status, educational attainment, judicial treatment, housing, income, and health care (Furtado et al., 2023). The original approach by Lukachko and others (2014) calculated the Black versus white rate or prevalence ratios for multiple indicators within the domains of political participation, employment and job status, educational attainment, and judicial treatment. The indicators were then input individually into generalized estimating equation models and stratified by race. Since then, researchers have built on this approach to combine multiple indicators of disproportionality into one measure of structural racism using latent variable methods (e.g., factor analysis, cluster analysis, latent class analysis). Dougherty and others (2020) used confirmatory factor analysis to combine Black–white indicators (i.e., prevalence ratios) of differential treatment across the domains of education, housing, employment, criminal justice, and health care into a single metric of structural racism exposure to predict BMI at the county level. Chantarat, Van Riper, and Hardeman (2022) calculated measures of Black–white residential segregation and inequities in education, employment, income, and homeownership at the metropolitan area scales (i.e., Public Use Microdata Areas) and then used latent class modeling to reduce them into one multidimensional measure of structural racism to predict birth outcomes. Similar to measures of racialized economic segregation, latent variable approaches to the Index of Disproportionality have the benefit of operationalizing structural racism as a multidimensional phenomenon and avoiding problems of multicollinearity. These latter approaches have the added advantage of capturing the otherwise invisible intersection of structural racism across multiple domains, although this may come at the cost of easier interpretability.
CHAPTER HIGHLIGHTS
Selecting indicators and datasets to represent them is a critical step in the iterative process for developing screening tools. (See the committee’s conceptual framework for indicator construction, Figure 3.2). Indicators in a tool are quantitative proxies for abstract concepts (such as “disadvantage” in the case of CEJST), and the selection of indicators requires consideration of their technical characteristics (validity, sensitivity, robustness, reproducibility, and scale) and practical characteristics (measurability, availability, simplicity, affordability, credibility, and relevance). Engaging community members and other interested and affected parties iteratively throughout the indicator selection and integration process is an essential aspect of building the credibility of
___________________
48Multicollinearity occurs when two or more independent variables in a model are highly correlated. This can violate the assumptions of statistical models such as linear regression; it can also be an issue when constructing a composite index since it implies the overcounting of a concept.
an EJ tool and engendering trust. The CEQ’s indicator selection criteria limit data to those that are publicly available and relevant to E.O. 14088 and Justice40; that cover all 50 states, the District of Columbia, and U.S. territories; and that are available at the census-tract scale or finer. The census-tract scale may not provide the granularity needed to adequately define communities.
The categories of burden selected for CEJST could be used to represent disadvantage. Each burden category includes a different number of indicators, and each indicator is assigned a threshold value. The technical documentation for CEJST (CEQ, 2022a) does not provide the rationale for the choice, number, or thresholds of many of its indicators. These indicators are not explicitly weighted, although the socioeconomic burden category is more heavily weighted because that threshold must be met in addition to the threshold in any other indicator. Indicator interactions and cumulative impacts are not considered in the tool. In the current construction of CEJST, the number of indicators and their categorization under specific burdens do not affect the identification of disadvantage because any single indicator can trigger disadvantage status if the threshold value is met (in addition to the socioeconomic indicator). Using a single, uniform low-income measure in a tool such as CEJST may not accurately reflect lived experiences even after doubling the standard poverty level and accounting for the cost of living.
As currently formulated, CEJST relies on data from existing sources, in some cases using the same data that are also employed within other screening tools available from the federal government and others to map environmental justice and climate vulnerability. Numerous other indicators and datasets are available that could be used instead of or in addition to the indicators now used in CEJST. These meet CEQs criteria and may be able to reflect lived experiences in communities more accurately. Several potential indicators and datasets are described in this chapter and in Appendix D that might be considered, but their inclusion by CEQ would require careful analysis. Community engagement, validation, and transparency in selecting and including burden categories and indicators can help evaluate how well the tool captures burdens that align with the lived experience of communities. Indicator groupings could become important in future iterations of the tool, especially if integration approaches for assessing cumulative impacts are implemented (discussed further in Chapter 6). CEQ could also foster the development of new, fit-for-purpose datasets with various agencies, organization, research groups, and private firms.
The next chapters will broaden this chapter’s focus on specific indicators and data gaps in CEJST and return to the process of developing EJ tools. Chapter 6 addresses approaches for integrating indicators and developing composite indicators to align with the concept being measured by the tool. Chapter 7 describes the iterative techniques for validating the robustness and output of the tool.
This page intentionally left blank.


