Incorporating Climate Change and Climate Policy into Macroeconomic Modeling: Proceedings of a Workshop (2024)
Chapter: 5 Projecting Economic and Financial Impacts of a Transition to a Low-Greenhouse Gas Economy
5
Projecting Economic and Financial Impacts of a Transition to a Low-Greenhouse Gas Economy
The fifth session focused on a more practical matter: how to evaluate complex policies implemented today, such as the Inflation Reduction Act (IRA) policy (Box 5-1). The session took a closer look at how policy evaluations can fit from both a macroeconomic perspective and a carbon emissions reduction perspective.
BOX 5-1
The Inflation Reduction Act of 2022
The Inflation Reduction Act (IRA) was released in August 2022 by the Biden administration to put into effect a 10-year plan to commit to a clean energy economy and act on climate change. This act will implement tax provisions that aim to lower costs for consumers and invest in clean energy solutions via a $370 billion investment. The IRA was set forward to help achieve the Biden’s administration’s commitment to reduce greenhouse gas emissions in the United States by 50 percent of 2005 levels by 2030.
SOURCE: White House, 2023.
INFLUENCE OF TRANSITION-RELATED EXPECTATIONS ON POLICY SUCCESS
Emanuele Campiglio, University of Bologna and RFF-CMCC European Institute on Economics and Environment, discussed how transition-related expectations may influence policy effectiveness and their integration into macroeconomic models of low-carbon transitions. These expectations encompass various aspects of the transition, including future policy implementation, technology development, and stranded physical and financial assets. He said that all these influence investment choices and potential transition-related disruptions.
Campiglio highlighted that climate-related market crises (Minsky moments6 or green swans) often result from the mismatch of expectations compared to reality. He said that the
___________________
6 A Minsky moment is the tipping point when speculative activity becomes unsustainable, resulting in rapid price deflation and unavoidable market collapse (Investopedia.com).
complexity of expectations is difficult to capture due to their volatility, heterogeneity, susceptibility to cognitive bias, forward-looking nature, and influence of recent events. Campiglio said that expectations are traditionally represented either in a neoclassical approach (rational, homogenous, forward-looking) or in a complex macroeconomic manner (heterogeneous but relying on adaptive expectations). However, he explained that new economic approaches provide new avenues to incorporate more accurate, heterogeneous expectations into transition modeling to provide new insights.
Campiglio used a dynamic modeling approach to explore historical examples of climate policy reversals, such as the Australian Carbon Tax and the U.S. withdrawal from the Paris Agreement. He said that many policy reversals stem from concerns around the perceived costs of a low-carbon transition, leading to uncertainty in policymaker commitments and possibly resulting in varied expectations. Campiglio shared Refinitiv’s 2021 survey data, showing that as the time horizon increases, expectations about the European Union Emissions Trading System carbon price became more heterogeneous, despite an overall increasing trend in carbon prices (Figure 5-1).
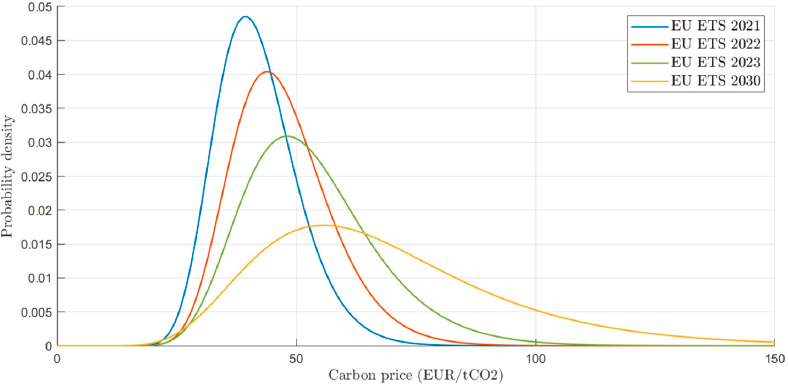
SOURCE: Cahen-Fourot et al. (2022).
To further explore the relationship between policy performance and expectations, Campiglio developed a dynamic model. It included low- and high-carbon technologies, and firms decide on how much to invest in each technology based on their expectations of future cost differentials. In turn, carbon price expectations influence the cost expectations. In his model, firms make decisions based on their reactions to various factors, such as inferring the optimal carbon price from the policymaker’s announced net zero date and
evaluating the credibility of these announcements based on the policymaker’s track record of fulfilling policy goals. This analysis divided the firms into believers and skeptics, and firms can switch between these two at any time.
Campiglio said that policymakers determine their commitment to the announced policy based on the perceived transition risks. High perceived risks may result in policymakers defaulting on goals, leading to a discrepancy between the tax implemented and the announced goal. A fully committed government honors policy promises, whereas a less committed government gives greater weight to the transition cost concerns. Campiglio’s dynamic model includes these two choices as key “responsiveness” parameters: (1) belief responsiveness to policymaker track record and (2) investment responsiveness to perceived cost differentials. Ultimately, these are linked to the dispersion of expectations, shifting from homogeneous expectations in a neoclassical approach to dynamic and heterogeneous expectations across firms.
Campiglio shared two steady-state analyses using this model (Figure 5-2). In the first case, he set these parameters to infinity, simulating homogeneous expectations and beliefs across firms. In the second case, he set the parameters to zero, representing an extreme case where firm decisions are random (though this is not realistic). Campiglio said that the results suggested that even with homogeneous expectations and beliefs, multiple equilibria

SOURCE: Campiglio et al. (2023).
can occur, representing the case where policymakers are highly ambitious but weakly committed. For example, if a policymaker tries to push decarbonization with a public announcement, it can sometimes succeed under certain conditions, but it can also lead to a failed transition if it does not work. In contrast, when using heterogeneous expectations, there is a larger variety of outcomes, including partial decarbonization from an unambitious but committed policymaker or no transition due to an ambitious but weakly committed policymaker.
Campiglio concluded by emphasizing the importance of accurately capturing and understanding expectations for the utility and performance of such dynamic models. He said that improving the representation of expectations is possible with complementary methods and data, including financial markets, econometrics, surveys, natural-language processing, or experiments. He also said that these models need to be calibrated and tuned for specific economies and governments (e.g., in the United States, electoral cycles may play an important role). Finally, the overarching goal of this work is to not only understand expectations and their influence on policy outcomes, but also to inform how to manage these expectations. Campiglio suggested aligning expectations to the policymakers, which in turn are aligned to climate science, leveraging central banks’ experience in expectations management (Campiglio et al., forthcoming).
EVALUATING THE INFLATION REDUCTION ACT
Rhodium Group NEMS-Based Model
John Larsen, Rhodium Group, spoke about the interaction between macroeconomic assumptions and U.S. greenhouse gas (GHG) emissions using the IRA as an example (Box 5-1). His team uses a U.S.-focused energy system model based on the National Energy Modeling System (NEMS), enhanced to better represent clean technologies and their role in the energy system and include updated assumptions on markets, policy, and macroeconomic outlook. Larsen showed his team’s 2022 policy forecast, released before the IRA. They created different emission pathway scenarios using a range of assumptions to explore future uncertainty. One significant source of uncertainty is the U.S. macroeconomic growth rate at different time horizons, which compounds into larger uncertainties over time.
Larsen discussed two scenarios: (1) central emissions pathway assuming 1.9 percent annual gross domestic product (GDP) growth rate from 2023 to 2035, consistent with the Congressional Budget Office (CBO) projections, and (2) high emissions pathway with a 2.3 percent GDP growth rate, consistent with the Energy Information Administration’s central case. Larsen showed that higher economic growth rate was correlated with higher emissions. The 2.3 percent growth scenario resulted in 2.5 billion tons more GHG emissions (Figure 5-3a), primarily driven by energy demand. He explained that a faster-growing economy has (1) a higher-producing industrial sector, requiring more energy for production; (2) a busier transportation sector owing to increased commuting and transportation of goods, and (3) wealthier consumers who spend more money on energy services (Figure 5-3b).
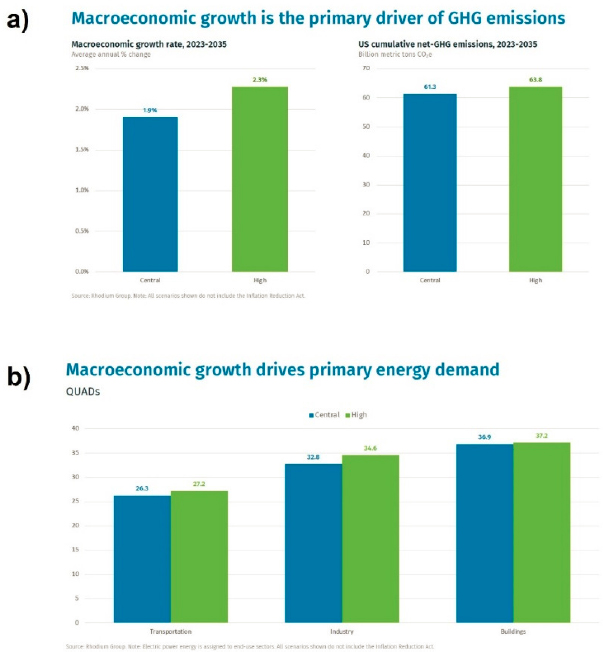
SOURCE: Presented by John Larsen on June 15, 2023.
Next, Larsen and his team assessed the impact of the IRA on three emissions scenarios: low, central, and high emissions. These scenarios were driven by varying assumptions about fossil fuel prices, clean technology costs, and economic growth, summarized in Figure 5-4a. Larsen showed that the IRA is largely effective in reducing net GHG emissions for all three emission pathway scenarios (Figure 5-4b), achieving nearly 10 percent more reduction relative to 2005 emission reductions in the United States. Even in the high-economic-growth scenario, the IRA lowered net emissions. Larsen noted that although the IRA shows a huge effort in emissions reductions, it falls short of the current administration’s 50–52 percent emissions reduction target. However, he emphasized that the IRA is a major step forward.
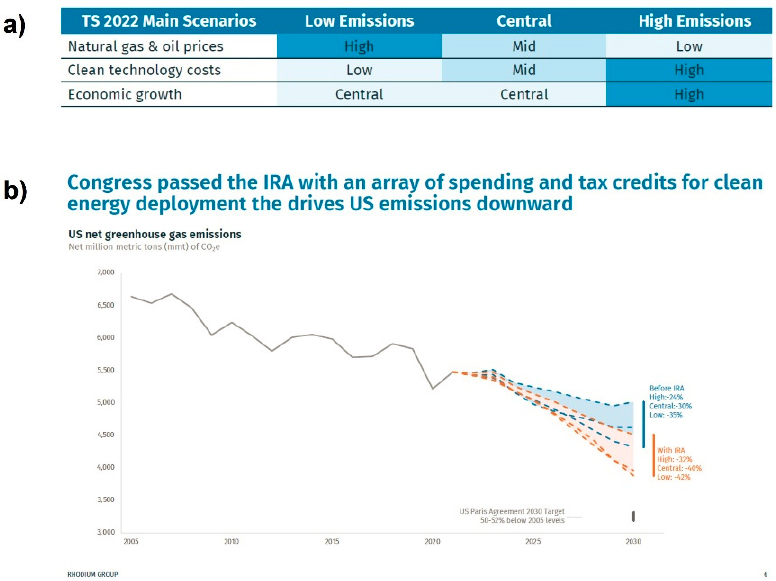
SOURCE: Rhodium Group (2022).
Furthermore, Larsen showed a detailed analysis of the central scenario to elucidate the sources of the emission reductions, which suggested that the largest emission reductions occur in the electric power sector (Figure 5-5). He said that this is mainly due to lucrative tax credits and strong responsiveness to climate policy. Other sectors also experience some reductions (e.g., the industry and transportation sectors), though not as substantial. This analysis showed that the IRA effectively redirects investment in power generation, shifting the balance of capital and variable costs into the electric power sector. With the IRA, fuel costs are reduced by nearly $100 billion, shifting toward system investments and operations and maintenance, while cumulative costs remain relatively stable. By the early 2030s, the electric power CO2 intensity is reduced by nearly 0.15 metric tons per megawatt hour with the IRA compared to without it.
Larsen concluded with two key takeaways. First, their model showed that the IRA, by encouraging shifts in investment across the electric power sector, resulted in emission reductions without large macroeconomic shifts. Their work showed that between 2023 and 2035, net investments of less than $100 billion per year would be enough to successfully
reduce emissions, a minor portion compared to a $25 trillion economy. Second, the macroeconomic conditions and assumptions about future growth rate are the primary drivers in GHG emission trends in U.S. energy modeling over the analyzed time frame. Larsen ended on an optimistic note, highlighting the potential to address the decarbonization needs of the country using policy and investment actions to influence behavior and shift incentives. Instead of focusing on the impending macroeconomic implications of climate change, he encouraged the Roundtable to focus on the macroeconomic trajectory.

SOURCE: Presented by John Larsen on June 15, 2023.
Federal Reserve Bank of Minneapolis REGEN Model
Neil Mehrotra, Federal Reserve Bank of Minneapolis, similarly discussed the IRA and its economic implications. The IRA aims to reduce GHG emissions by providing subsidies for clean energy investment, including tax credits for clean power generation. These subsidies are unlimited and continue until emission targets are met. As such, evaluating the extent to which these tax credits are utilized can be important for assessing the fiscal and macroeconomic implications of the IRA. In collaboration with Catherine Wolfram and John Bistline, Mehrotra’s work focused on two key questions: (1) what are the IRA implications for energy markets and (2) what are the macroeconomic consequences of these provisions?
Addressing the first question, Mehrotra’s group’s work showed that the IRA will significantly affect power investment, resulting in a 50 percent increase in clean power investment and significant reductions in CO2 emissions. This increased investment may
lead to very low or even negative wholesale electricity prices. As a result of higher investment in renewable power, there is a significantly higher fiscal cost, estimated at $900 billion over the next 10 decades, compared to the estimates from CBO and the Joint Committee on Taxation (JCT).
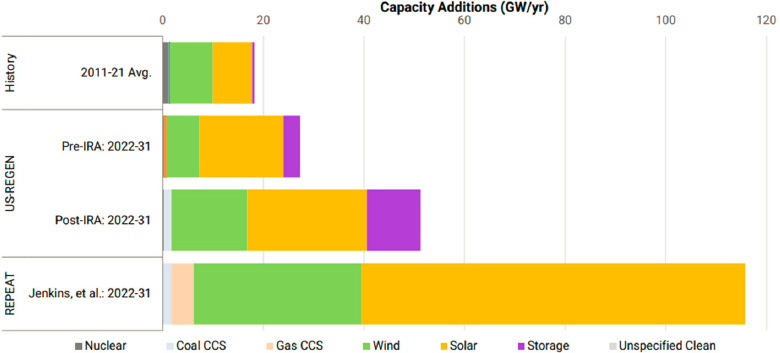
Mehrotra’s group used the U.S. Regional Economy, Greenhouse Gas, and Energy (US-REGEN) model7 to assess future energy investments. They applied the IRA’s tax credits to the model, comparing a historical average (2011–2021 mean) to projected investment in the next decade (2022–2031) with and without the IRA (Figure 5-6). This analysis showed a 50 percent increase in clean energy investment relative to baseline. Even before the IRA, the model predicts a significant increase in renewable energy investments due to declining wind and solar costs. Mehrotra’s analysis showed that the IRA further amplified this trend, increasing new capacity additions by another 50 percent. Altogether, his results showed a doubling of investment in solar, wind, and battery energy compared to the prior decade (Figure 5-6), which Mehrotra noted is still on the conservative side relative to other studies (i.e., Jenkins et al., 2022).
Mehrotra showed that the IRA’s increases in renewable power investment lead to a 7 percent reduction in GHG emissions relative to baseline (Figure 5-7). Echoing Larsen, Mehrotra noted that the reduction aligns with the Biden administration’s goals but it falls short of their target. However, the IRA may continue to be effective into the next decade because the tax credits do not necessarily expire by 2030.
SOURCE: Presented by Neil Mehrotra on June 15, 2023.
___________________
7 The US-REGEN Model is an energy industry equilibrium model developed at the Edison Power Research Institute.

SOURCE: Presented by Neil Mehrotra on June 15, 2023.
Secondly, Mehrotra’s modeling suggested that the IRA will significantly affect electricity prices and could potentially lead to very low or possibly negative wholesale electricity prices. He said that this can occur because renewable power generates electricity intermittently and may produce surplus energy during times of lower demand, driving down the price. However, Mehrotra said that the IRA’s subsidies for renewable power investments may counteract this affect, because producers can still benefit from the production tax credit even when prices are low or negative. This incentive encourages continued production despite low prices.
Mehrotra speculated that these subsidies could lead to changes in electricity demand as people attempt to take advantage of the low prices. Their modeling suggested that take-up of these tax credits will be higher than originally scored by CBO and JCT, resulting in a higher fiscal cost. Addressing the large range of uncertainty of these projections, Mehrotra and his coauthors ran the model under alternative macroeconomic, regulatory, and technology scenarios and found that the CBO/JCT score was closest to the low scenario with relatively unfavorable conditions for clean energy investments and pessimistic macroeconomic assumptions. The central and higher scenarios resulted in around $400 billion and $800 billion higher fiscal costs.
Mehrotra then discussed the macroeconomic implications of the climate provisions of the IRA. His team’s modeling revealed three main macroeconomic implications. In the
long run, the IRA will deliver supply-side benefits that increase output, wages, and productivity by reducing electricity prices, which play a crucial role in production. In the short term, the IRA will stimulate demand for nonresidential investment, possibly leading to increased interest rates or inflation. Lastly, post-pandemic, the macroeconomic environment may be less favorable to climate-related investment.
Mehrotra noted that this boost in investment demand resulting from the IRA is relatively small compared to the overall size of the economy. Moreover, the macroeconomic environment, particularly factors such as interest rates, strongly influences the success of the IRA by affecting incentives for clean energy investments, given their capital-intensive nature. In closing, Mehrotra noted the limitations of their work in that their model does not include potentially important macroeconomic effects such as the upstream investments or combined effects of the IRA and the CHIPS Act, so the full macroeconomic effects of the IRA may not be fully captured.
DISCUSSION
During the panel discussion, James Stock and Heather Boushey raised questions about how the current evaluation of the IRA and various models could inform policy and identify potential tools missing in the models. Mehrotra pointed out one important area not captured in both his sequential approach and Larsen’s NEMS model, which is the consideration of commodity prices. Mehrotra explained that the absence of commodity prices may lead to unaccounted spillover effects, because these prices interact with the investments represented in the models. Currently, the models use prices of different power technologies as inputs but do not consider potential feedback to commodity prices.
Larsen added that other factors, such as device and electric vehicle prices, may similarly interact with and affect investments but are missing from models. He suggested that improving the granularity of the models in terms of sectors and time frames could improve these representations. Mehrotra emphasized that the models also do not adequately capture supply constraints and bottlenecks, which have important implications for macroeconomic outcomes, such as inflation and may impact the investments more frequently in the future.
Boushey noted that there are other nuances to consider, such as the travel patterns of electricians for work or increased construction costs associated with the transition, although these may be short term and temporary. Larsen posited on the impact of expectations and loss aversion, which could have large impacts; however, it remains unclear whether this translates to the macroeconomic side and whether the models are able to capture the impacts of sectoral-related disruptions. Similarly, the models have room for improvement on capturing the behavioral side of the transition. For example, Larsen explained that the labor community has been more inclined to save existing assets and retrofit for decarbonization than to build new things in order to leverage the labor union members on the existing assets.
Mehrotra and Larsen highlighted that existing climate policies are falling short of their targets based on their modeling outcomes. They noted that work to use the models to determine what policies are actually needed to reach targets is being explored to improve
the policy efficacy of these models. They reiterated, however, that insights from the models suggest that even with an enhanced IRA, since the electric power sector is relatively small compared to the economy, substantial increases in investment in this sector will always have limited effects on the macroeconomy.
Tim Lenton, University of Exeter, asked about the models’ ability to capture reinforcing feedbacks between sectors, which may accelerate the low-carbon transition. For instance, the expansion of renewable electricity may necessitate improved and cheaper grid storage, which could expand the battery and electric vehicle markets to bring battery prices down. Consequently, this may incentivize the adoption of renewable electricity. Larsen explained that these feedbacks are not fully captured in the models discussed. He noted that feedback between fossil fuel and clean energy is captured, but not feedback between clean energy and its impact. Campiglio suggested that a network approach could improve the representation of these feedbacks; however, he said that this would require capturing domestic and international sectoral linkages where data are limited. Larsen also suggested that incorporating real-time rates into the energy modeling framework could address this issue.


