Reforming the Coast Guard's Certificate of Compliance Program for Liquefied Gas Carriers: Promoting Efficient Implementation and Safety Effectiveness (2024)
Chapter: Appendix C: Certificate of Compliance Exam Projection Methodology
Appendix C
Certificate of Compliance Exam Projection Methodology
The committee produced the projection of Certificate of Compliance (COC) exams for liquefied natural gas (LNG) and liquefied petroleum gas (LPG) carriers for 2024–2040, which is also included in Chapter 3, Figure 3-9 and Table 3-5, using the following methodology.
The committee developed separate projections for LNG carrier COC exams and LPG carrier COC exams. For each liquefied gas, the committee developed an export projection and an import projection. Imports were held constant for 2024–2040. The annual increases in exports, by volume, were assigned to specific types of gas carriers, which generated the increased number of vessel visits per year to U.S. ports. Finally, a percentage of annual gas carrier visits was assigned a COC exam. Because the COC exam is a required calendar-based annual exam, one gas carrier may visit a U.S. port one time in 12 months and receive one exam, while another gas carrier may visit U.S. ports multiple times in 12 months and receive one exam. The percentage of annual gas carrier visits receiving COC exams was developed using a regression analysis described in more detail below. The regression analysis produced percentages of LNG and LPG carrier visits that require COC exams, 13.4% and 14.2%, respectively, that are lower than the 25% used by the U.S. Coast Guard in workforce planning.
LNG CARRIER COC EXAM PROJECTION
For LNG, the committee used the Poten & Partners LNG export projection published in April 2023, as represented in Figure 2-16, which stabilizes
during the 2030s a bit above 140 million tons per year (MMT/year).1 Because the Poten & Partners export projection is by weight, the projection was converted to billion cubic meters (BCM) of LNG. LNG imports for 2024–2040 were held constant at 2.3 BCM per year, which represents imports to Puerto Rico. (Imports to New England are not expected after May 2024 with the closure of the Everett, Massachusetts, power plant and associated LNG import facility.)
To convert the annual LNG export volumes to annual LNG carrier visits, the analysis made two assumptions: (1) going forward, 2023’s LNG carrier visits will cover the current volume of exports (i.e., the range of vessel sizes for current LNG export facilities will continue); and (2) export volumes above current export volumes (i.e., the increase in exports) will be carried on 174,000 cubic meter (CBM) LNG carriers, the “workhorses” of the LNG carrier trade. The 174,000 CBM LNG carriers’ average cargo load at U.S. ports in 2022 was 168,000 CBM. The rationale is that current LNG import and export production facilities are likely to have infrastructure or be part of LNG markets that affect the size (i.e., carrying capacity) of the LNG carriers that visit their ports. New LNG export facilities, both those under construction and approved, will be designed to accommodate the 174,000 CBM LNG carrier.
The annual increment in exports above the 2023 baseline is then divided by 168,000 to produce the additional vessel visits above the 2023 baseline.
The forecast assigns COC exams to 13.4% of LNG carrier visits per year for 2024–2040. The 13.4% LNG carrier COC exam rate was developed by examining the actual COC exams performed each year from 2013 through 2023 and comparing that to the number of LNG carrier calls in the corresponding year. Linear regression was used to find the slope (COC exam rate) of the best fit line (minimizing the differences between the actual data and the predicted data using the least squares method). Table C-1 includes the imports, exports, LNG carrier visits, and LNG COC exams that occurred during 2013–2023 and the projections for 2024–2040.
LIQUEFIED PETROLEUM GAS CARRIER CERTIFICATE OF COMPLIANCE EXAM PROJECTION
For LPG, the committee used the export forecast from RBN Energy LLC, as shown previously in Figure 2-19. LPG imports are held constant at 60,000 thousand-barrels (Kbbl) per year. To convert LPG volumes to vessel visits, the committee took into consideration that LPG carriers vary more in size than LNG carriers and examined the ratio of LPG transported volume to LPG carrier visits from 2013 to 2023. However, LPG carriers are also
___________________
1Poten & Partners, presentation to the committee, January 25, 2023.
TABLE C-1 LNG Carrier COC Exams, Actuals and Projections for 2013–2040
| Year | Imports, BCM | Exports, BCM | Total | LNG Carrier Visits | LNG Carrier COC Exams |
|---|---|---|---|---|---|
| 2013 | 4.3 | 0.0 | 4.3 | 76 | 45 |
| 2014 | 3.3 | 0.4 | 3.7 | 64 | 24 |
| 2015 | 4.2 | 0.5 | 4.6 | 77 | 31 |
| 2016 | 4.2 | 5.2 | 9.4 | 151 | 53 |
| 2017 | 3.5 | 20.0 | 23.5 | 306 | 97 |
| 2018 | 3.9 | 30.7 | 34.5 | 437 | 131 |
| 2019 | 3.4 | 51.5 | 54.9 | 702 | 176 |
| 2020 | 2.8 | 67.6 | 70.3 | 975 | 205 |
| 2021 | 2.6 | 100.8 | 103.4 | 1,382 | 275 |
| 2022 | 2.1 | 109.4 | 111.5 | 1,529 | 238 |
| 2023 | 2.8 | 118.2 | 121.0 | 1,582 | 235 |
| 2024 | 2.3 | 129.5 | 131.8 | 1,648 | 267 |
| 2025 | 2.3 | 140.7 | 143.0 | 1,715 | 276 |
| 2026 | 2.3 | 150.6 | 152.9 | 1,774 | 284 |
| 2027 | 2.3 | 160.5 | 162.8 | 1,833 | 292 |
| 2028 | 2.3 | 170.4 | 172.8 | 1,892 | 300 |
| 2029 | 2.3 | 180.4 | 182.7 | 1,951 | 308 |
| 2030 | 2.3 | 190.3 | 192.6 | 2,010 | 315 |
| 2031 | 2.3 | 191.4 | 193.7 | 2,017 | 316 |
| 2032 | 2.3 | 192.5 | 194.8 | 2,024 | 317 |
| 2033 | 2.3 | 193.6 | 195.9 | 2,030 | 318 |
| 2034 | 2.3 | 194.7 | 197.0 | 2,037 | 319 |
| 2035 | 2.3 | 195.8 | 198.2 | 2,043 | 320 |
| 2036 | 2.3 | 196.9 | 199.3 | 2,050 | 321 |
| 2037 | 2.3 | 198.0 | 200.4 | 2,056 | 322 |
| 2038 | 2.3 | 199.1 | 201.5 | 2,063 | 323 |
| 2039 | 2.3 | 200.2 | 202.6 | 2,070 | 323 |
| 2040 | 2.3 | 201.3 | 203.7 | 2,076 | 324 |
NOTE: BCM = billion cubic meters.
SOURCE: Coast Guard data (provided to the committee), 2023. Poten & Partners, Global LNG Outlook, April 2023; Poten & Partners, presentation to the committee, January 25, 2023.
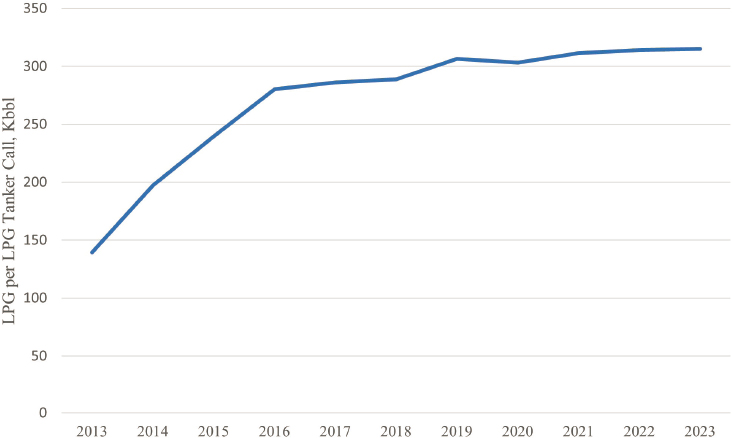
getting larger. Instead of using the average of annual LPG volume/annual LPG visits from 2013 to 2023, the analysis uses the trend for 2018–2023 of 315,000 barrels per LPG carrier visit for 2024–2040, as shown in Figure C-1.
The forecast assigns COC exams to 14.2% of LPG carrier visits per year for 2024–2040. The 14.2% COC exam rate was developed by examining the actual COC exams performed each year from 2013 through 2023 and comparing that to the number of LPG carrier calls in the corresponding year. Linear regression was used to find the slope (COC exam rate) of the best fit line (minimizing the differences between the actual data and the predicted data using the least squares method). Table C-2 includes the imports, exports, LPG carrier visits, and LPG COC exams that occurred during 2013–2023 and the projections for 2024–2040.
LIQUEFIED NATURAL GAS CARRIER AND LIQUEFIED PETROLEUM GAS CARRIER CERTIFICATE OF COMPLIANCE EXAM PROJECTIONS COMBINED
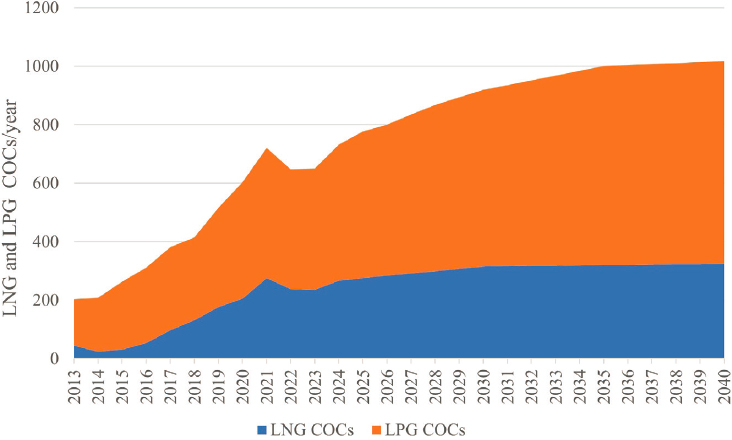
Figure C-2 depicts the combined projections of COC exams for LNG and LPG carriers, with corresponding data and indexing found in Table C-3. The total number of COC exams for LNG and LPG carriers is projected to increase 42% between 2023 and 2030 and 57% by 2040. The current
SOURCE: Coast Guard data (provided to the committee), 2023.
TABLE C-2 LPG Carrier COC Exams, Actuals and Projections for 2013–2040
| Imports | Exports | Total | LPG Carrier Visits | LPG Carrier COC Exams | |
| 2013 | 43,242 | 121,058 | 164,300 | 1,177 | 158 |
| 2014 | 37,742 | 196,054 | 233,796 | 1,186 | 183 |
| 2015 | 44,256 | 285,976 | 330,232 | 1,379 | 232 |
| 2016 | 51,684 | 369,604 | 421,288 | 1,503 | 258 |
| 2017 | 57,845 | 449,255 | 507,100 | 1,773 | 284 |
| 2018 | 63,303 | 517,909 | 581,212 | 2,013 | 283 |
| 2019 | 67,595 | 605,476 | 673,071 | 2,197 | 339 |
| 2020 | 52,656 | 691,355 | 744,011 | 2,455 | 398 |
| 2021 | 57,178 | 771,065 | 828,243 | 2,661 | 446 |
| 2022 | 57,755 | 810,820 | 868,575 | 2,765 | 409 |
| 2023 | 60,000 | 911,184 | 971,184 | 3,083 | 414 |
| 2024 | 60,000 | 975,087 | 1,035,087 | 3,286 | 466 |
| 2025 | 60,000 | 1,055,035 | 1,115,035 | 3,540 | 502 |
| 2026 | 60,000 | 1,087,707 | 1,147,707 | 3,644 | 516 |
| 2027 | 60,000 | 1,147,202 | 1,207,202 | 3,832 | 543 |
| 2028 | 60,000 | 1,202,244 | 1,262,244 | 4,007 | 568 |
| 2029 | 60,000 | 1,241,961 | 1,301,961 | 4,133 | 586 |
| 2030 | 60,000 | 1,281,737 | 1,341,737 | 4,259 | 604 |
| 2031 | 60,000 | 1,316,023 | 1,376,023 | 4,368 | 619 |
| 2032 | 60,000 | 1,350,310 | 1,410,310 | 4,477 | 635 |
| 2033 | 60,000 | 1,384,596 | 1,444,596 | 4,586 | 650 |
| 2034 | 60,000 | 1,418,883 | 1,478,883 | 4,695 | 665 |
| 2035 | 60,000 | 1,453,169 | 1,513,169 | 4,804 | 681 |
| 2036 | 60,000 | 1,458,356 | 1,518,356 | 4,820 | 683 |
| 2037 | 60,000 | 1,463,543 | 1,523,543 | 4,837 | 686 |
| 2038 | 60,000 | 1,468,730 | 1,528,730 | 4,853 | 688 |
| 2039 | 60,000 | 1,473,917 | 1,533,917 | 4,870 | 690 |
| 2040 | 60,000 | 1,479,104 | 1,539,104 | 4,886 | 693 |
SOURCE: Coast Guard data (provided to the committee), 2023. RBN Energy LLC, RBN Energy NGL Voyager, September 17, 2023. https://rbnenergy.com/products/voyager.
SOURCE: Coast Guard data (provided to the committee), 2023. RBN Energy LLC, RBN Energy NGL Voyager, September 17, 2023. https://rbnenergy.com/products/voyager.
number of COC exams for LPG carriers is larger than for LNG carriers (414 versus 235, respectively, in 2023) and will rise more rapidly, increasing 46% between 2023 and 2030 and 67% by 2040. The number of COC exams for LNG carriers is projected to increase 34% between 2023 and 2030 and 38% by 2040.
TABLE C-3 Actual and Projected COC Exams for LNG and LPG Carriers, 2013–2040
| LNG COCs | LPG COCs | Total COCs | Index COCs (2023 = 100) | |
| 2013 | 45 | 158 | 203 | 31 |
| 2014 | 24 | 183 | 207 | 32 |
| 2015 | 31 | 232 | 263 | 41 |
| 2016 | 53 | 258 | 311 | 48 |
| 2017 | 97 | 284 | 381 | 59 |
| 2018 | 131 | 283 | 414 | 64 |
| 2019 | 176 | 339 | 515 | 79 |
| 2020 | 205 | 398 | 603 | 93 |
| 2021 | 275 | 446 | 721 | 111 |
| 2022 | 238 | 409 | 647 | 100 |
| 2023 | 235 | 414 | 649 | 100 |
| 2024 | 267 | 466 | 733 | 113 |
| 2025 | 276 | 502 | 777 | 120 |
| 2026 | 284 | 516 | 800 | 123 |
| 2027 | 292 | 543 | 835 | 129 |
| 2028 | 300 | 568 | 868 | 134 |
| 2029 | 308 | 586 | 893 | 138 |
| 2030 | 315 | 604 | 919 | 142 |
| 2031 | 316 | 619 | 935 | 144 |
| 2032 | 317 | 635 | 952 | 147 |
| 2033 | 318 | 650 | 968 | 149 |
| 2034 | 319 | 665 | 984 | 152 |
| 2035 | 320 | 681 | 1,001 | 154 |
| 2036 | 321 | 683 | 1,004 | 155 |
| 2037 | 322 | 686 | 1,007 | 155 |
| 2038 | 323 | 688 | 1,010 | 156 |
| 2039 | 323 | 690 | 1,014 | 156 |
| 2040 | 324 | 693 | 1,017 | 157 |
SOURCE: Coast Guard data (provided to the committee), 2023. RBN Energy LLC, RBN Energy NGL Voyager, September 17, 2023. https://rbnenergy.com/products/voyager.
This page intentionally left blank.


