Reforming the Coast Guard's Certificate of Compliance Program for Liquefied Gas Carriers: Promoting Efficient Implementation and Safety Effectiveness (2024)
Chapter: 2 Ocean Shipping of Liquefied Gases
2
Ocean Shipping of Liquefied Gases
International trade in liquefied gases, such as liquefied natural gas (LNG) and liquefied petroleum gas (LPG), on oceangoing ships is an important source of fuel for heating and electricity generation and raw materials for petrochemicals used in manufacturing. U.S. oil and natural gas extraction, driven by advances in hydraulic fracturing, began exceeding U.S. demand in the 2010s, and, as a result, the United States became a top global exporter of LNG and LPG. These exports are made possible by the associated expansions of port infrastructure and shipping capacity.
This chapter begins with an introduction to liquefied gases, their status as hazardous substances, and the liquefied gas carriers that transport them in international trade. The chapter then examines the recent growth of U.S. exports of LNG and LPG and the supply chains that use ocean transport. It concludes with forecasts for U.S. LNG and LPG exports through the 2030s and 2040s. In general, U.S. LNG and LPG exports are expected to continue to increase into the 2030s and maintain their high levels through the 2040s.
INTRODUCTION TO SHIPPING LIQUEFIED GASES
Liquefied gases are substances that are gases in ambient conditions and that are transformed through refrigeration or pressurization into liquids for transport. Liquefied gases are transported on vessels known as liquefied gas carriers, which are a type of tank ship. This section discusses the dominant gases shipped as liquids for oceangoing transport and the types of gas carriers in use. Table 2-1 provides a breakdown of gas carrier arrivals and cargo types relative to other types of tank ships.
TABLE 2-1 Gas Carrier Arrivals in U.S. Ports by Cargo Type and as a Percentage of All Tank Vessel Arrivals, 2018–2022
| Tank Vessel Type | 2018 | 2019 | 2020 | 2021 | 2022 |
|---|---|---|---|---|---|
| LPG | 2,013 | 2,197 | 2,455 | 2,661 | 2,765 |
| LNG | 437 | 702 | 975 | 1,382 | 1,529 |
| Anhydrous Ammonia | 30 | 11 | 8 | 13 | 9 |
| Other | 126 | 95 | 74 | 151 | 135 |
| Gas Carriers Total | 2,606 | 3,005 | 3,512 | 4,207 | 4,438 |
| Chemical Tankers | 11,769 | 11,670 | 10,580 | 11,350 | 11,106 |
| Oil Tankers | 8,873 | 8,119 | 6,949 | 6,608 | 7,243 |
| Total Arrivals | 23,248 | 22,794 | 21,041 | 22,165 | 22,787 |
| Gas Carriers, as a % of All Tank Vessel Arrivals | 11.2% | 13.2% | 16.7% | 19.0% | 19.5% |
SOURCE: Committee analysis of the Coast Guard’s Port State Control Annual Reports. See https://www.dco.uscg.mil/Our-Organization/Assistant-Commandant-for-Prevention-PolicyCG-5P/Inspections-Compliance-CG-5PC-/Commercial-Vessel-Compliance/Foreign-OffshoreCompliance-Division/Port-State-Control/Annual-Reports.
Overview of Liquefied Gases
LNG and LPG make up the bulk of liquefied gases exported from U.S. ports. Gas carriers also transport liquefied anhydrous ammonia and other liquefied gases, albeit in much lower volumes than LNG and LPG. Some newer gas carriers are being developed to transport liquid hydrogen and liquid carbon dioxide.1
LNG is natural gas that is cooled into a liquid. Natural gas is made up mostly of methane but may also have smaller amounts of heavier hydrocarbons, also known as natural gas liquids, that include ethane, propane, normal butanes, and natural (or condensate) gasoline. These natural gas liquids are typically removed before natural gas is transformed into LNG.2 Because natural gas is less dense than air, the most practicable way to transport natural gas across land is in its gaseous
___________________
1Hydrogen Council, “Toward a New Era of Hydrogen Energy: Suiso Frontier Built by Japan’s Kawasaki Heavy Industries,” October 4, 2022, https://hydrogencouncil.com/en/towarda-new-era-of-hydrogen-energy-suiso-frontier-built-by-japans-kawasaki-heavy-industries.
2U.S. Energy Information Administration (EIA), “Natural Gas Explained,” last updated December 27, 2022, https://www.eia.gov/energyexplained/natural-gas; EIA, “Natural Gas Liquids,” accessed February 12, 2024, https://www.eia.gov/tools/glossary/index.php?id=Natural%20Gas%20Liquids.
form by pipeline. Before transport by an oceangoing vessel, natural gas is cooled to its liquid form, which occurs at –260°F (–162°C) at ambient pressure. In its liquid form, natural gas takes up approximately 1/600th of the volume of its gaseous form. To maintain its liquefied state, LNG is transported in insulated cryogenic tanks. Because LNG has a consistency similar to water, specialized cryogenic pumps are used to move LNG into and out of large tanks.
LPG is derived from two sources, natural gas processing and petroleum refining, and is comprised of a group of substances that include propane, normal butane, and isobutane. Some industry data sources also include ethane in their LPG-related information.3 Propane makes up most of the LPG in U.S. import/export markets. For transportation, LPGs can be reduced to liquid form by pressurization, refrigeration, or a combination of both. In general, refrigeration is used by vessels over 15,000 m3. Very large gas carriers and very large ethane carriers (VLECs), usually above the 75,000 m3 capacity, are fully refrigerated.4 Box 2-1 lists several common units of measure used to describe liquefied gases.
Overview of Liquefied Gas Carriers
Gas carriers vary by cargo containment system, propulsion type, and the capacity of cargo tanks. To ensure safety and security, U.S. Coast Guard examination procedures must account for all of the designs. Oceangoing liquefied gas carriers constructed since 1986 must meet the standards found in the International Code for the Construction and Equipment of Ships Carrying Liquefied Gases in Bulk (IGC Code), as adopted by the International Maritime Organization (IMO). The IGC Code provides design, construction, material, and equipment standards that address the hazards associated with transporting liquefied gases. The IGC Code’s requirements are “intended to minimize these risks as far as is practicable, based upon present knowledge and technology.” The IGC Code is periodically updated and amended, and the most recent edition came into force on July 1, 2016.5
___________________
3Ethane is entrained in natural gas and is typically handled separately from LPG because at low ethane prices, ethane is left in natural gas when sold.
4EIA, “Glossary: Liquefied Petroleum Gases (LPG),” accessed April 18, 2024, https://www.eia.gov/tools/glossary/index.php?id=Liquefied%20petroleum%20gases%20%28LPG%29; EIA, “Hydrocarbon Gas Liquids Explained—Transporting and Storing Hydrocarbon Gas Liquids,” last updated December 26, 2023, https://www.eia.gov/energyexplained/hydrocarbon-gas-liquids/transporting-and-storing-hydrocarbon-gas-liquids.php.
5IMO, “IGC Code,” accessed February 14, 2024, https://www.imo.org/en/OurWork/Safety/Pages/IGC-Code.aspx.
BOX 2-1
Common Units of Measure for Liquefied Gasesa
- Volume of natural gas: trillion cubic feet (Tcf), billion cubic feet (Bcf), cubic meters (CBM and m3), billion cubic meters (BCM)
- Volume of LNG (ship capacity): cubic meters (CBM and m3), thousand cubic meters (kCBM and KM3)
- Weight of LNG: million tons (MMt)
- Production of LNG: trillion cubic meters/year (Tcm/y), trillion cubic feet/year (Tcf/y), trillion cubic meters/day (Tcm/d), trillion cubic feet/day (Tcf/d), billion cubic feet/year (Bcf/y), billion cubic feet/day (Bcf/d), million tons per year (mtpa and MMt/y)
- Volume of LPG: barrels (bbl), thousand barrels (Kbbl), thousand barrels (Mb), million barrels (MMb)
- Production of LPG: barrels per day (b/d), thousand barrels per day (Kb/d) or (mb/d), million barrels per day (MMb/d or mmb/d or Mb/d)
__________________
a Government of Canada, “Conversion Factors and Common Units to Be Used for North American Cooperation on Energy Information,” last updated February 18, 2020, https://natural-resources.canada.ca/energy/international/nacei/18057.
IMO’s Marine Safety Committee amended the IGC Code as recently as 2022.6 U.S. regulation of gas carriers is covered below in Chapter 3.
Tank Design
A gas carrier’s cargo containment system is defined by the type of tank that holds the liquefied gas. The tanks can accommodate gases liquefied through full pressurization, full refrigeration, or a combination of both pressurization and refrigeration. Tank types are divided mainly between those that are “independent [and] self-supporting” and those that use an “integrated membrane” technology.7
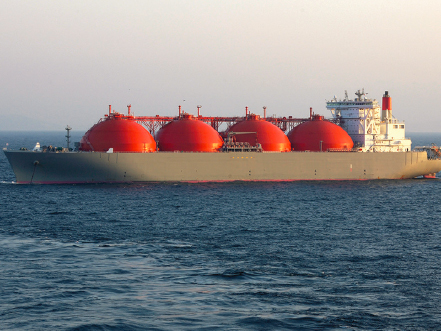
Independent, self-supporting tanks are not part of the ship’s hull, can be used for LPG, LNG, and other liquefied gases, and come in three types (see Figure 2-1). Type A tanks are prismatic and carry fully refrigerated cargoes at near atmospheric pressure. Type A tanks must have external insulation appropriate for the temperature, and a complete “secondary
___________________
6IMO, “Resolution MSC.523(106),” November 2022, https://wwwcdn.imo.org/localresources/en/KnowledgeCentre/IndexofIMOResolutions/MSCResolutions/MSC.523(106).pdf.
7Coast Guard, Foreign Gas Carrier Examiner (FGCE) Tactics, Techniques, and Procedures (TTP), February 2020, https://www.dco.uscg.mil/Portals/9/DCO%20Documents/5p/CG-5PC/CG-CVC/Guidance/CGTTP%203-72.6A_LGC-FGCE.pdf.
SOURCE: “Liquefied Natural Gas,” Office of Fossil Energy and Carbon Management, U.S. Department of Energy, accessed April 17, 2024, https://www.energy.gov/fecm/liquefied-natural-gas-lng.
barrier” to protect the hull in case of leakage. Type B tanks may be prismatic or spherical and are designed to leak before failure. A partial secondary barrier beneath Type B tanks captures any leaks. Type C tanks are designed to withstand specific pressures and come in cylindrical, bi-lobe, or tri-lobe shapes. Type B tanks are primarily found on mid-size and large LNG carriers, while Type C tanks are typically used for small-scale LNG carriers.8
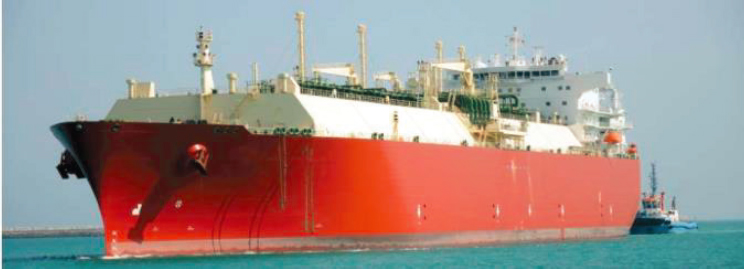
Membrane tanks designed specifically for LNG are now the preferred technology for most large LNG carriers (see Figure 2-2). Membrane tanks are integrated into the hull and are composed of two thin layers of membrane barrier supported by insulation. This type of design provides lighter weight construction and more efficient use of space that allows a greater cargo capacity than independent tanks. The inter-barrier area also insulates the cryogenic cargo and provides continuous leak detection through circulation of nitrogen in the barrier space.9 Currently, all LNG tankers under
___________________
8Coast Guard, Foreign Gas Carrier Examiner (FGCE) Tactics, Techniques, and Procedures (TTP), February 2020, https://www.dco.uscg.mil/Portals/9/DCO%20Documents/5p/CG-5PC/CG-CVC/Guidance/CGTTP%203-72.6A_LGC-FGCE.pdf; Bureau Veritas, “Choosing the Right Cargo Containment Systems,” February 2, 2021, https://marine-offshore.bureauveritas.com/insight/choosing-right-cargo-containment-systems.
9Bureau Veritas, “Choosing the Right Cargo Containment Systems,” February 2, 2021, https://marine-offshore.bureauveritas.com/insight/choosing-right-cargo-containment-systems.
SOURCE: Government Accountability Office, Maritime Transportation: Implications of Using U.S. Liquefied-Natural-Gas Carriers for Exports (2015), https://www.gao.gov/assets/gao-16-104.pdf.
construction are of the membrane type.10 Many VLECs also use membrane tanks.11
Technology for purpose-built gas carriers for other cargo, such as ammonia and volatile organic compounds, continues to develop.12
Propulsion Systems
LNG carriers use either diesel or steam power plants for propulsion, while LPG carriers are all diesel powered. For LNG carriers, the availability of LNG “boil-off” gas that could be used as fuel for the boiler allowed steam power plants to remain in use for much longer than for other vessels.13 However, all LNG carriers currently under construction use only diesel power plants. The last steam turbine–powered LNG carrier was delivered in 2019. In addition, improvements in LNG tank insulation have reduced LNG boil-off. Many new LNG carriers also have the ability to reliquefy LNG boil-off, which increases system complexity.
___________________
10Poten & Partners, presentation to the committee, January 25, 2023.
11EIA, “Natural Gas Weekly Update,” June 10, 2021, https://www.eia.gov/naturalgas/weekly/archivenew_ngwu/2021/06_10/#itn-tabs-1.
12American Bureau of Shipping, “Advancing the Next Generation of Gas Carriers,” accessed March 6, 2024, https://ww2.eagle.org/en/Products-and-Services/marine/gas-carriers.html.
13Boil-off gas is a product of the process of LNG unloading and storage when some parts of LNG evaporate into the gas phase. Boil-off gas can be used as fuel, compressed, reliquefied, and transported. See T. Wlodek, “Analysis of Boil-Off Rate in Liquefied Natural Gas (LNG) Receiving Terminals,” IOP Conference Series: Earth and Environmental Science 214(2019):012105.
LNG can also be used for fuel: marine diesel plants adapted for LNG were developed in the early 2000s. The oldest “tri-fuel” (LNG, marine diesel, and heavy fuel oil) diesel-powered LNG carrier (>100,000 CBM capacity) in the current fleet was delivered in 2007. LPG carriers may use single-fuel diesel power plants or dual-fuel diesel propulsion systems (e.g., marine diesel oil and LPG).
Hazards and Safety Management
Several significant hazards must be managed to transport LNG, LPG, and other liquefied gases safely. A leak or loss of cargo containment is the primary danger.
When LNG leaks, it first transitions to a vapor as its temperature rises. As the methane vapor mixes with oxygen, it moves through a phase that is highly flammable, and any contact with an ignition source will cause a fire. Large leaks of LNG can also lead to a rapid phase change—the methane gas suddenly takes up 600 times the space of the LNG—that can damage structures, vessels, and people in the blast radius. As a cryogenic liquid, LNG poses a frostbite danger to people. If LNG is allowed to come into contact with certain steels, the exposure can lead to brittle fracture, where the steel suddenly cracks or breaks.14
LPG vapor is also flammable. When pressurization is used to liquefy substances such as propane, loss of pressurization associated with a leak can lead to a large release in a much shorter period of time than with substances, such as LNG, that are transported at atmospheric pressure. Leaks of LNG, LPG, and other gases in enclosed spaces also pose an asphyxiation hazard. While LNG and LPG are not considered toxic, other gases, such as ammonia, are toxic and pose a significant health hazard.
To manage these safety hazards, the industry and government use four categories of safety requirements: primary containment, secondary containment, safeguard systems, and separation distance. Primary containment includes the equipment and tanks used to transfer and store the liquefied gases as well as their design, materials, and associated operating procedures. Secondary containment measures are built into the vessel to contain or isolate leaks. Safeguard systems include the sensors, warning systems, and automatic emergency actions that help a ship’s operators manage an
___________________
14Michelle Michot Foss, LNG Safety and Security, Bureau of Economic Geology, University of Texas at Austin, June 2012, https://www.beg.utexas.edu/files/cee/legacy/LNG_Safety_and_Security_Update_2012.pdf. See also U.S. Department of Energy (DOE), Liquefied Natural Gas Safety Research: Report to Congress, May 2012, https://www.energy.gov/sites/prod/files/2013/03/f0/DOE_LNG_Safety_Research_Report_To_Congre.pdf; Response Center for the Mediterranean Sea, “Guidelines on Risk of Gaseous Releases Resulting from Marine Accidents,” June 2018.
emerging safety issue. Separation distance creates safe zones around gas carriers when they are conducting cargo operations or are passing near other vessels.15
LIQUEFIED NATURAL GAS TRANSPORT TRENDS
Most natural gas transportation in the United States occurs via pipeline. Pipelines move natural gas from producing fields to liquefaction processing plants and then to domestic consumption for household use, electricity generation, and industrial use. Pipelines are used to import and export natural gas to or from Mexico and Canada. Pipelines also carry natural gas to ports for liquefaction and export as LNG.16 The international transportation of natural gas between countries other than Mexico and Canada involve oceangoing ships.
This section examines the LNG segment of the international supply chain for natural gas. It covers U.S. imports and exports, including export destinations and trends, and the characteristics of the LNG carrier fleet. It concludes with a discussion of LNG export terminals at U.S. ports. Because these terminals liquefy the natural gas for transport, they are a key factor in forecasting future exports.
Natural Gas Supply Chain Across Oceans
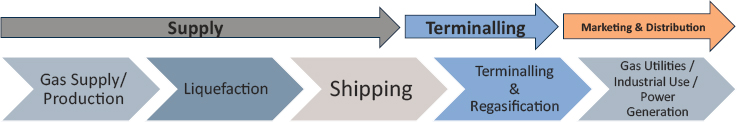
The supply chain for moving natural gas via oceangoing vessels begins with the extraction of natural gas from underground sources. The natural gas is then processed to remove non–natural gas substances and transported by pipeline to a liquefaction facility. At this facility, “liquefaction trains” convert the natural gas into LNG. The LNG is stored at the liquefaction site until pumped into the tanks on an LNG carrier. The LNG carrier then transports the gas to the receiving terminal. At the receiving terminal, the LNG is typically pumped to a “regasification” unit, where heat converts it to its gaseous state, and then it is injected into a gas pipeline. The receiving terminal may also store the carrier’s cargo as LNG. A few LNG carriers have regasification capability, which can be used in locations without shoreside regasification plants. The LNG supply chain is depicted in Figure 2-3.
___________________
15Michelle Michot Foss, LNG Safety and Security, Bureau of Economic Geology, University of Texas at Austin, June 2012, https://www.beg.utexas.edu/files/cee/legacy/LNG_Safety_and_Security_Update_2012.pdf.
16Small volumes of LNG are also moved via truck and in International Organization for Standardization tank containers.
LNG Economics
LNG liquefaction units and regasification units are capital-intensive to construct and energy-intensive to operate. Historically, the entire LNG supply chain was developed under a series of interconnected contracts covering the expected life of each component. LNG supply systems were developed as comprehensive systems defined by long-term contracts for supply, liquefaction, LNG carrier charters, and sales in the receiving market. Contracts, including for LNG carrier charters, were typically for 20 years or more.
The development of these long-term LNG systems continues to this day, driven largely by the requirements of the lenders that provide project financing. Lenders reduce the risk of default by demanding that each step of the supply chain be arranged contractually under long-term contracts. Therefore, natural gas supply contracts, carrier charters, receiving terminal contracts, and sales contracts must be arranged to cover a large portion, if not all, of the liquefaction capacity. However, over time there has been a reduction in the required duration of the supporting contracts. For example, initial vessel charters began shifting in the late 2010s from a duration of 15–25 years to 10 years or less.17
Beginning around 2000, a few companies in the industry built speculative LNG carriers that did not have prearranged charters. A spot market for LNG transport began to emerge, which coincided with the conclusion of some of the early long-term LNG system contracts. Growing steadily, in 2022 approximately 35% of LNG trade was done under short-term contracts of 4 years or less, up from about 3% in 2000.18 Although the spot LNG market has expanded, it still is not robust.
The perishability of LNG also impacts LNG economics. Under ambient conditions, LNG reverts to natural gas without intervention. “Boil-off” can occur while LNG is waiting to be transferred to a vessel, during transport, and before the regasification process commences. The industry addresses
___________________
17Clarksons’ Research Services, LNG Trade & Transport 2018, https://www.clarksons.com/research.
18Clarksons’ Research Services, LNG Trade & Transport 2023, https://www.clarksons.com/research.
perishability with insulation, reliquefaction, and a “just-in-time” approach to the supply chain that seeks to minimize the amount of time the natural gas is in its liquid state.
U.S. Exports and Imports of Natural Gas
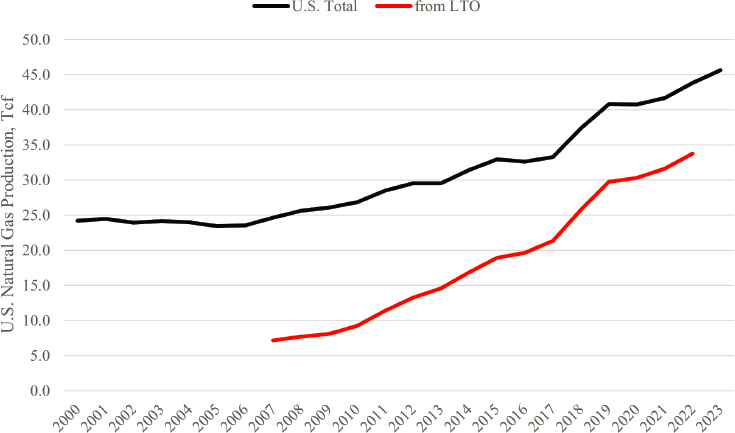
Driven by hydraulic fracturing in crude oil and natural gas extraction, natural gas production in the United States has expanded dramatically in the 21st century, as shown in Figure 2-4. Between 2000 and 2008, U.S. natural gas gross production held reasonably constant with an annual average of 24.2 Tcf/y, followed by a sharp increase in gross production in the 2010s. By 2023, natural gas gross production in the United States had reached 45.6 Tcf, an 88% increase over the 2000–2008 period.19 Hydraulic fracturing accounts for most of this increased production. Natural gas produced through hydraulic fracturing increased from 7.2 Tcf in 2007 to 33.8 Tcf in 2022, reaching 78% of total production.20
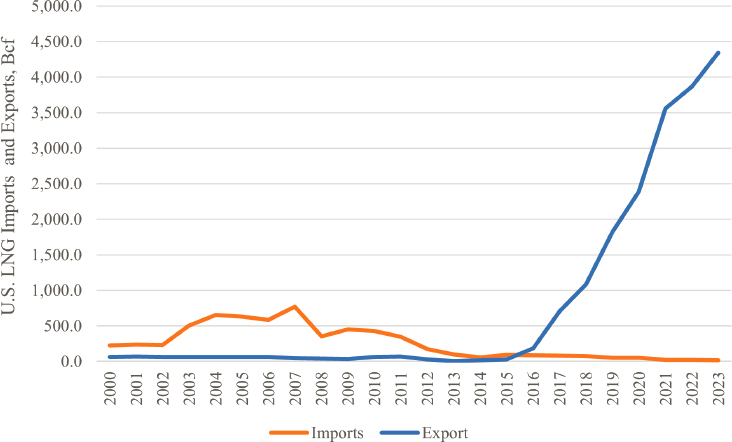
Natural gas exports and imports reflect this increased U.S. production. Annual exports of natural gas reached 6.9 Tcf in 2022—a record high. The United States exports substantial amounts of natural gas via pipeline to Canada and Mexico. Waterborne exports of natural gas as LNG began in 2016, and natural gas exported on LNG carriers exceeded exports via pipelines in 2021 and 2022.21 As shown in Figure 2-5, U.S. exports of LNG climbed rapidly from near zero before 2016 to 4,343 Bcf in 2023.
Annual imports of natural gas to the continental United States in all forms peaked at 4.6 Tcf in 2007 and have since fallen by roughly 1.6 Tcf. The United States imports natural gas via pipeline from Canada. Imports of LNG by gas carrier fell from 770.8 Bcf in 2007 to 15.24 Bcf in 2023. LNG is still imported to New England, primarily from Trinidad and Tobago, to meet power and heating demands during extreme cold or heat waves.22 The U.S. territories also import LNG.23 For Puerto Rico, the 82.2 Bcf of LNG imported in 2023 came from Nigeria, Trinidad and Tobago, and Spain.24
___________________
19See EIA, Natural Gas Database, https://www.eia.gov/naturalgas/data.php.
20EIA, Drilling Productivity Report, August 2023, https://www.eia.gov/petroleum/drilling.
21EIA, “Natural Gas Explained: Natural Gas Imports and Exports,” last updated June 30, 2023, https://www.eia.gov/energyexplained/natural-gas/imports-and-exports.php.
22EIA, “Natural Gas Explained: Liquefied Natural Gas,” last updated August 11, 2023, https://www.eia.gov/energyexplained/natural-gas/liquefied-natural-gas.php.
23Coast Guard, “Port State Control Annual Report Numbers” (provided to the committee), 2023.
24Puerto Rico’s import of LNG is tracked separately from imports into the United States. See DOE, U.S. Natural Gas Imports and Exports Monthly: December 2023, https://www.energy.gov/sites/default/files/2024-02/Natural%20Gas%20Imports%20and%20Exports%20Monthly%20December%202023_0.pdf.
NOTES: LTO = light tight oil, produced through hydraulic fracturing; Tcf = trillion cubic feet. The figure shows the total amount of natural gas produced and the amount of natural gas produced through hydraulic fracturing, shown as LTO.
SOURCE: Committee analysis of U.S. Energy Information Administration (EIA) data; see EIA, Natural Gas Database (accessed April 1, 2024), https://www.eia.gov/naturalgas/data.php.
Destinations for U.S. LNG Exports
U.S. ports exported LNG by vessel to 37 countries in 2023. The top 10 receiving countries in 2023 in order of decreasing volume were the Netherlands, France, the United Kingdom, Japan, South Korea, Spain, Germany, Italy, China, and India. Together, these countries received 72% of U.S. LNG exports by vessel.25
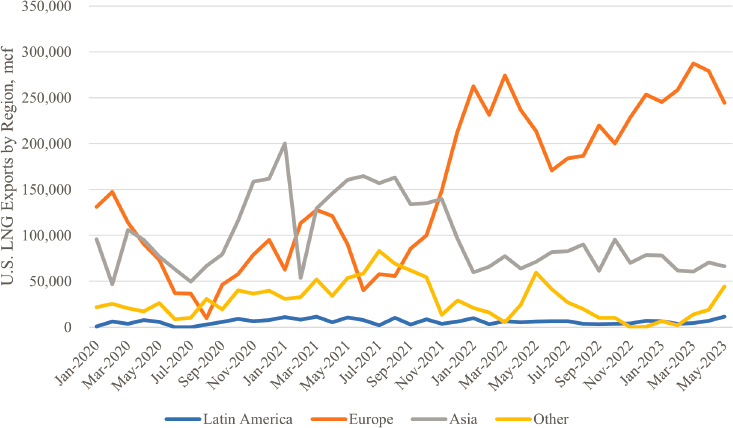
Despite the widespread use of long-term contracts, destinations for U.S. LNG exports can shift rapidly. In November 2021, U.S. LNG exports started to be redirected from Asia to Europe, as illustrated in Figure 2-6. With the Russian invasion of Ukraine on February 24, 2022, the shift in market preference for Europe continued, rising from 34% of exports in 2021 to 71% in 2022 (see Table 2-2). Shifts in the locations of LNG demand can have other effects on U.S. export markets. For example, shipping LNG to
___________________
25DOE, U.S. Natural Gas Imports and Exports Monthly: December 2023, https://www.energy.gov/sites/default/files/2024-02/Natural%20Gas%20Imports%20and%20Exports%20Monthly%20December%202023_0.pdf.
NOTE: Bcf = billion cubic feet.
SOURCE: Committee analysis of EIA data; see EIA, “Natural Gas Explained,” last updated June 30, 2023, https://www.eia.gov/energyexplained/natural-gas/importsand-exports.php.
NOTE: mcf = million cubic feet.
SOURCE: Committee analysis of EIA data, https://www.eia.gov/naturalgas/data.php.
TABLE 2-2 U.S. LNG Exports by Region, Annual Percentage, 2020–2022
| Latin America % | Europe % | Asia % | Other % | |
| 2020 | 2.4 | 38.4 | 46.8 | 12.4 |
| 2021 | 2.5 | 34.2 | 47.2 | 16.1 |
| 2022 | 1.8 | 70.6 | 21.9 | 5.7 |
SOURCE: Committee analysis of EIA data, https://www.eia.gov/naturalgas/data.php.
Asian markets typically requires using the Panama Canal, which requires advance scheduling. However, rising demand in Asia potentially could be met by exporting natural gas via pipeline to Mexican ports on the Pacific Coast or the Gulf of California.26
Global LNG Carrier Fleet
Cargo capacity is the major differentiator for LNG carriers. Because there are economies of scale in LNG ocean transport, assuming sufficient volumes, channels, and terminals, the larger the vessel, the lower the unit transport costs. However, LNG carriers may be subject to size constraints. Some older terminals may not be able to accommodate certain LNG carriers at their docks, and shipping channels and canals also limit ship size. As a consequence, the LNG carrier market is segmented by vessel size.
As the LNG market has evolved since its inception back in the 1960s, LNG carrier sizes (see Box 2-2) tended to develop around their specific uses. In the early days of transporting natural gas as LNG, all aspects of a proposed LNG trade, including the design and construction of the LNG carriers, were developed according to the needs of the specific trade. In general, the LNG carrier fleet has evolved from smaller steam-powered vessels (<130,000 CBM capacity) into larger diesel-powered vessels (>170,000 CBM). The current “workhorses” in the LNG carrier fleet have a capacity of 174,000 CBM.
Fleet Characteristics
To analyze the characteristics of the U.S.-trading segment of the global LNG carrier fleet, the committee developed a database of all LNG carriers in the world and all LNG carriers calling at U.S. ports in 2022. The analysis
___________________
26Max Bearak, “U.S. Gas Producers Are Racing to Sell to Asia. And Mexico Is the Key,” The New York Times, February 13, 2024, https://www.nytimes.com/2024/02/13/climate/mexico-natural-gas-biden.html.
BOX 2-2
LNG Carrier Sizes and Types
The LNG carrier industry describes cargo capacitya according to the following:
- <150,000 CBM—generally older steam-driven LNG tankers.
- 150,000–160,000 CBM—last steam orders plus early dual-fuel diesel (i.e., marine gasoil and LNG).
- 160,000–169,000 CBM—tri-fuel diesel electric (i.e., heavy fuel oil, marine gasoil, and LNG).
- 170,000–179,000 CBM—can be tri-fuel diesel electric or slow-speed diesel. These are the bulk of the large trading fleet and are still ordered today. The most-built size is about 174,000 CBM.
- 180,000–200,000 CBM—These carriers are designed to give a bit more cargo capacity and still fit through the Panama Canal’s Neopanamax Locks.
- Q-Flex (210,000–215,000 CBM)—Qatar trade and able to fit through the Panama Canal’s Neopanamax Locks.
- Q-Max (~260,000 CBM)—Qatar’s largest LNG carriers. These carriers can transit the Suez Canal but cannot fit through the Panama Canal’s Neopanamax Locks.
__________________
a Committee analysis of S&P Global’s IHS Sea-Web database. https://www.spglobal.com/marketintelligence/en.
used the S&P Global IHS Sea-Web ship database and the U.S. Department of Energy’s database of all LNG carrier export-loading voyages. Because the smallest LNG carrier visiting a U.S. port in 2022 had a gas capacity of 135,000 CBM, the analysis below is limited to the global LNG tanker fleet above a gas capacity of 130,000 CBM. The characteristics of the global LNG carrier fleet are shown in Table 2-3. The global and U.S.-trading fleets27 are compared in Tables 2-4 and 2-5.
Globally, there were 603 LNG carriers trading in 2022 with a gas capacity greater than 130,000 CBM.28 All currently trading LNG carriers above 130,000 CBM are too wide to fit through the original Panama Canal locks (32.31-meter maximum beam). However, all but the largest LNG carriers, the Q-Max, can fit through the new Panama Canal Neopanamax Locks (51.25-meter maximum beam). All LNG carriers can transit the Suez Canal.
___________________
27U.S.-trading fleet refers to the fleet of vessels that regularly trade in the United States.
28Not all ship databases designate ships in the same way. The S&P Global IHS Sea-Web database includes all LNG carriers that called at U.S. ports in 2022. See S&P Global IHS Sea-Web Database, https://www.spglobal.com/marketintelligence/en.
TABLE 2-3 Global In-Service LNG Carrier Fleet (>130,000 CBM) Characteristics, 2022
| Minimum | Maximum | Average | |
| Gas Capacity, CBM | 132,564 | 261,988 | 163,836 |
| Age, Years | <1 | 33 | 10.1 |
| Length, Meters | 275 | 345 | 294 |
| Beam, Meters | 42.5 | 55.0 | 46.3 |
| Draft, Meters | 11.1 | 17.8 | 12.4 |
| Gross Tonnage | 90,478 | 169,293 | 114,066 |
| Deadweight (DWT) | 66,695 | 155,159 | 89,947 |
NOTE: CBM = cubic meters; DWT = deadweight tonnage.
SOURCE: Committee analysis of S&P Global’s IHS Sea-Web database. https://www.spglobal.com/marketintelligence/en.
TABLE 2-4 Global Versus U.S.-Trading LNG Carrier Fleets (>130,000 CBM), 2022
| Global | U.S. Only | |
| Number of Tankers | 603 | 264 |
| Gas Capacity, Average CBM | 163,836 | 166,403 |
| Gas Capacity, Minimum CBM | 132,564 | 135,049 |
| Gas Capacity, Maximum CBM | 261,988 | 257,740 |
| Age, Average | 10.1 years | 6.7 years |
| Age, Minimum | 1 year | 1 years |
| Age, Maximum | 33 years | 21 years |
| Steam Percentage | 33 | 13 |
NOTES: CBM = cubic meters. The analysis is not weighted by U.S. vessel calls. U.S.-trading fleet refers to the fleet of vessels that regularly trade in the United States.
SOURCE: Committee analysis of S&P Global’s IHS Sea-Web database, https://www.spglobal.com/marketintelligence/en.
Comparing the U.S.-trading fleet in 2022 (264 vessels) to the global fleet of gas carriers (603 vessels) produced three key observations:
- The gas capacities of the LNG carriers are similar (after restricting the global fleet to >130,000 CBM) in average and range of sizes.
- The U.S.-trading fleet is younger than the global fleet as a whole. The average and maximum ages of the U.S.-trading fleet are
TABLE 2-5 Global Versus U.S.-Trading LNG Carrier Fleets by Flag State, 2022
| Flag State | Global Trading Fleet, Flag | U.S.-Trading Fleet, Flag | ||
|---|---|---|---|---|
| Number | Percent | Number | Percent | |
| Algeria | 2 | 0.3 | — | — |
| Bahamas | 81 | 13.4 | 21 | 8.0 |
| Bahrain | 1 | 0.2 | 1 | 0.4 |
| Belgium | 1 | 0.2 | — | — |
| Bermuda | 54 | 9.0 | 27 | 10.2 |
| Brunei | 4 | 0.7 | — | — |
| Cyprus | 9 | 1.5 | 1 | 0.4 |
| Denmark | 3 | 0.5 | 3 | 1.1 |
| France | 6 | 1.0 | 1 | 0.4 |
| France | 7 | 1.2 | 6 | 2.3 |
| Greece | 44 | 7.2 | 24 | 9.6 |
| Hong Kong, China | 30 | 5.0 | 2 | 0.8 |
| Indonesia | 4 | 0.7 | — | — |
| Isle of Man | 7 | 1.2 | 7 | 2.7 |
| Japan | 15 | 2.5 | 4 | 1.5 |
| Korea, South | 7 | 1.3 | — | — |
| Liberia | 28 | 4.8 | 11 | 4.2 |
| Malaysia | 19 | 3.2 | 2 | 0.8 |
| Malta | 60 | 10.0 | 45 | 17.0 |
| Marshall Islands | 112 | 18.5 | 43 | 16.3 |
| Norway | 9 | 1.5 | 5 | 1.9 |
| Panama | 45 | 7.5 | 23 | 8.7 |
| Russia | 1 | 0.2 | — | — |
| Singapore | 33 | 5.5 | 21 | 7.6 |
| Spain | 15 | 2.5 | 13 | 4.9 |
| United Kingdom | 3 | 0.5 | 3 | 1.1 |
| Total | 603 | 100 | 264 | 100 |
NOTE: U.S.-trading fleet refers to the fleet of vessels that regularly trade in the United States.
SOURCE: Committee analysis of S&P Global’s IHS Sea-Web database. https://www.spglobal.com/marketintelligence/en.
- 6.7 and 21 years, respectively, compared to 10.1 and 33 years for the global fleet.
- The U.S.-trading fleet has a lower percentage of steam-powered LNG carriers (13%) than the global fleet (33%). This also reflects the younger age of the U.S.-trading fleet.
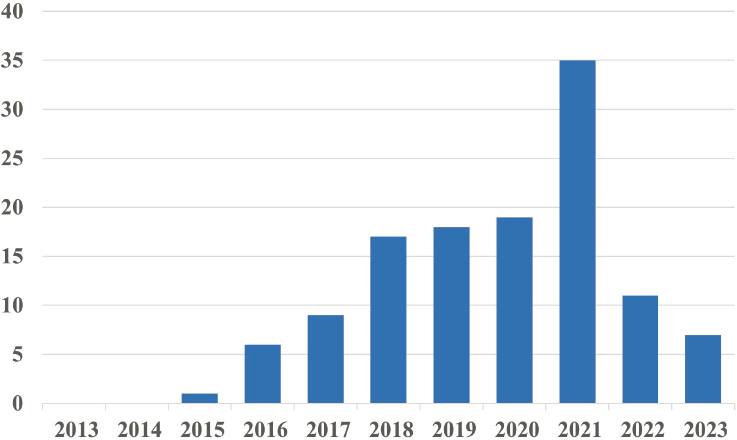
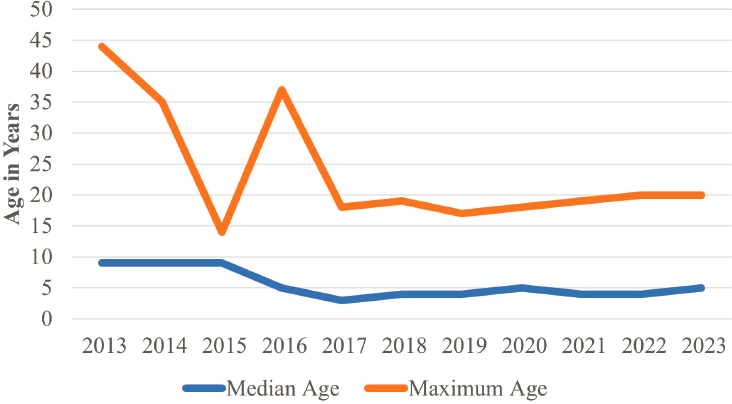
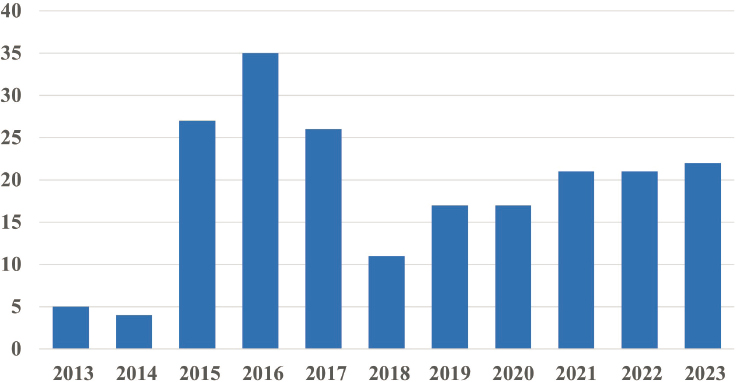
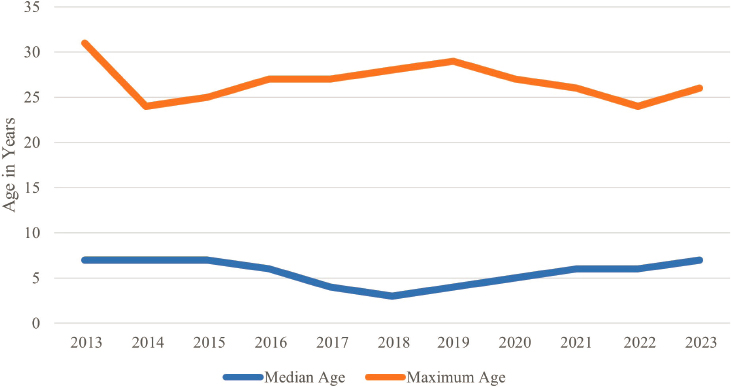
Examining the age of the U.S.-trading LNG carrier fleet over the period 2013–2023 reveals that as exports increased, the demand for vessels was met by building new or using younger LNG carriers instead of bringing more vessels of advanced age into the U.S. trade. There were no LNG carriers <1 year of age trading at U.S. ports in 2013 and 2014; the number of new LNG carriers began increasing in 2015, reaching a high of 35 in 2021. The median age of the U.S.-trading fleet began at age 9 in 2013, then dropped to age 3 by 2017, before settling into a median between age 4 and 5 for the rest of 2018–2023.29 Starting in 2017, no LNG carriers over age 20 were part of the U.S.-trading fleet.30 Figures 2-7 and 2-8 break down new LNG carriers and the median and maximum ages of the U.S.-trading fleet from 2013 to 2023.
The LNG carrier fleet has expanded successfully to meet global and U.S. export demand. From as few as 50 LNG carriers in 1980, the number of vessels in the fleet has grown more than 12-fold. In addition, the maximum capacity of an LNG carrier has doubled, increasing from 131,000 CBM in 1980 to 262,000 CBM in 2023.31
Fleets by Flag State
A commercial vessel’s flag state is the country with which the vessel is registered, administering safety and environmental regulations. In 2022, 20 flag states were represented among the U.S.-trading fleet of LNG carriers, compared to 26 globally. There are no U.S.-flag LNG carriers. The three most numerous flag states for U.S. LNG exports were Malta (17.0%), the Marshall Islands (16.3%), and Bermuda (10.2%), comprising 43.5% of the U.S.-trading fleet. Globally, the three most numerous LNG carrier flag states are the Marshall Islands (18.5%), the Bahamas (13.4%), and Malta (10.0%), making up 41.9% of the global fleet. The global and U.S.-trading fleets by flag state are provided in Table 2-5.
___________________
29The median is the middle point of a data set where half of the data points are above the middle point and the other half of the data points are below the middle point.
30Coast Guard, “Port State Control Annual Report Numbers” (provided to the committee), 2023.
31Clarksons’ Research Services, 1980 data, https://www.clarksons.com/research; S&P Global, 2023, https://www.spglobal.com/marketintelligence/en.
NOTE: Each vessel is counted once per year; includes imports and exports.
SOURCE: U.S. Coast Guard data (provided to the committee), 2023.
NOTE: Each vessel is counted once per year; includes imports and exports.
SOURCE: U.S. Coast Guard data (provided to the committee), 2023.
NOTES: Bcf/d = billion cubic feet per day. Terminal Location and Daily Capacity: 1. Kenai, AK (not shown) (0.2 Bcf/d); 2. Sabine Pass, LA (4.55 Bcf/d); 3. Cove Point, MD (0.79 Bcf/d); 4. Corpus Christi, TX (2.40 Bcf/d); 5. Hackberry, LA (2.06 Bcf/d); 6. Elba Island, GA (0.35 Bcf/d); 7. Freeport, TX (2.38 Bcf/d); 8. Cameron Parish, LA (1.70 Bcf/d).
SOURCE: Federal Energy Regulatory Commission, “U.S. LNG Export Terminals–Existing, Approved Not Yet Built, and Proposed,” February 2024, https://www.ferc.gov/media/us-lng-export-terminals-existing-approved-not-yet-built-and-proposed.
LNG Terminal Facilities
Liquefaction occurs at export terminals, whose capacity to liquefy LNG is a ceiling on how much LNG can be exported.
As of March 2024, seven LNG export terminals (see Figure 2-9) are operating in the United States, with an installed capacity of 14.43 Bcf/d.32 During the 1,038 LNG carrier visits in 2022, these seven terminals loaded 1,229 parcels of LNG lifted (i.e., pumped to a ship for export) under different sale and purchase agreements (SPAs).33 The seven operating U.S. LNG
___________________
32The Kenai, Alaska, LNG terminal (capacity of 0.2 Bcf/d) has not exported LNG since 2015.
33These figures include some exports from the Venture Global Calcasieu facility, which was operating in “precommercial” commissioning status from March 1, 2022 (when the first LNG cargo was lifted) through year-end 2022. The commissioning status continued into 2023, with commissioning cargoes continuing through June 2023 per a FERC data release. The continuing “precommercial” (i.e., under construction) status has caused disputes with its SPA counter parties. See DOE, LNG Monthly Through June 2023, August 2023, https://www.energy.gov/sites/default/files/2023-09/LNG%20Monthly%20June%202023_2.pdf.
terminals are listed in Table 2-6 along with their locations, capacities, and 2022 vessel calls.
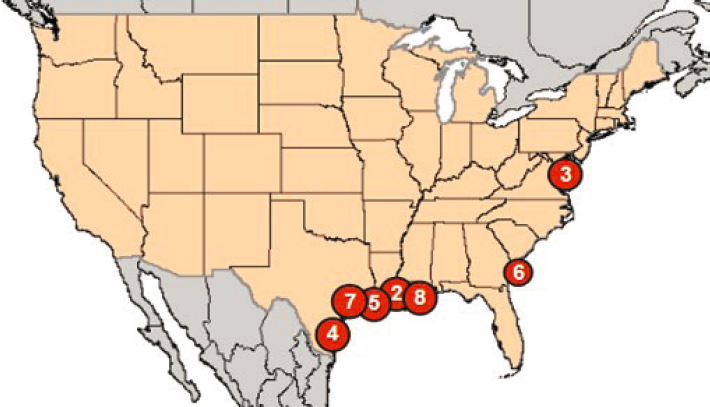
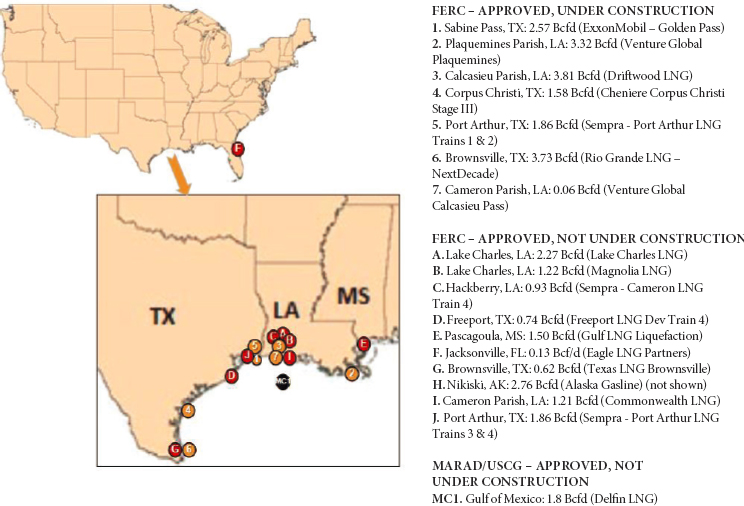
Significant amounts of additional export capacity are under construction or approved for construction. Seven LNG export terminals are under construction (total capacity of 16.93 Bcf/d), up from two under construction in 2022. Another 11 export terminals have received federal approval but are not yet under construction (total capacity of 15.04 Bcf/d). Total under construction or approved LNG export capacity is 31.97 Bcf/d, which is more than double the current installed capacity. Most of the approved but not yet operating export terminals are along the Gulf Coast in Texas and Louisiana (see Figure 2-10).34 The timeline from construction to LNG production for export is typically 3–5 years in the United States.35 In January 2024, the Biden administration placed a “pause” on the approval of additional LNG export facilities.36
LIQUEFIED PETROLEUM GAS TRANSPORT TRENDS
In general, the same trends driving LNG export growth are also influencing LPG export growth. This section provides background information on LPG markets, the fleet of LPG carriers, and the terminal facilities used for U.S. exports. Unless otherwise indicated, the analysis below includes all trading elements—propane, butane, isobutane, and ethane—of LPG.
U.S. Exports and Imports of LPG
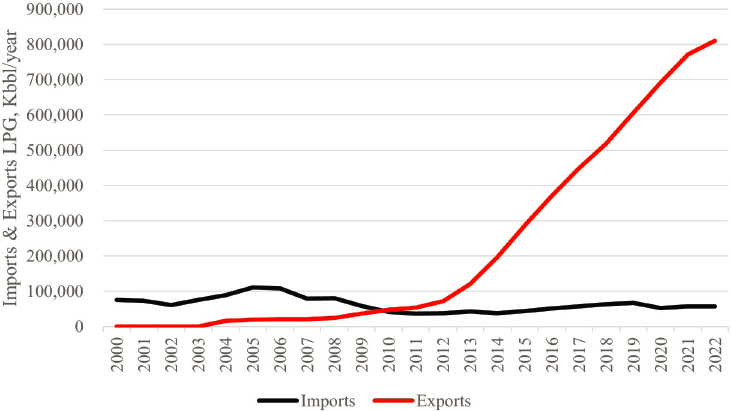
Before the U.S. hydraulic fracturing revolution, the United States was a net importer of LPG. Around 2010, exports began surpassing imports and were increasing rapidly by 2013. Annual LPG exports rose 570% between 2013 and 2022 to reach 810,820 Kbbl per year (see Figure 2-11). Measured by
___________________
34See FERC, “U.S. LNG Export Terminals–Existing, Approved Not Yet Built, and Proposed,” February 13, 2024, https://www.ferc.gov/media/us-lng-export-terminals-existing-approved-not-yet-built-and-proposed. The 11 export terminals approved but not yet under construction include the Delfin LNG project under the joint jurisdiction of the Maritime Administration (MARAD) and the Coast Guard. The eight in-process applications include two proposed projects under the jurisdiction of MARAD and the Coast Guard. See MARAD, “Pending Applications,” last updated February 1, 2023, https://www.maritime.dot.gov/ports/deepwater-ports-and-licensing/pending-applications.
35Global Energy Monitor, “How Long Does It Take to Build an LNG Export Terminal in the United States?” April 2022, https://globalenergymonitor.org/wp-content/uploads/2022/04/GEM-Briefing-LNG-Terminal-Development-Timelines.pdf.
36“Biden-Harris Administration Announces Temporary Pause on Pending Approvals of Liquefied Natural Gas Exports,” January 26, 2024, https://www.whitehouse.gov/briefing-room/statements-releases/2024/01/26/fact-sheet-biden-harris-administration-announces-temporary-pause-on-pending-approvals-of-liquefied-natural-gas-exports.
TABLE 2-6 Operating U.S. LNG Terminals
| Departure Terminal | Authorization Holder | Number of Calls in 2022 | Start-Up Year | Installed Operating Capacity (BCM/y) | Installed Operating Capacity (Bcf/d) | Poten & Partners Data of Operating Capacity |
|---|---|---|---|---|---|---|
| Hackberry, Louisiana | Cameron LNG, LLC (Sempra) | 194 | 2019 | 22.2 | 2.06 | 14.1 mtpa 1.86 Bcf/d |
| Corpus Christi, Texas | Cheniere Marketing, LLC and Corpus Christi Liquefaction, LLC | 215 | 2018–2021 | 24.8 | 2.40 | 14.1 mtpa 1.86 Bcf/d |
| Cove Point, Maryland | Cove Point LNG, LP (Dominion/Berkshire Hathaway) | 79 | 2018 | 8.5 | 0.79 | 4.7 mtpa 0.62 Bcf/d |
| Elba Island, Georgia | Southern LNG Company, LLC (Elba Island Terminal) | 36 | 2019 | 3.6 | 0.35 | 2.5 mtpa 0.33 Bcf/d |
| Freeport, Texas | Freeport LNG Expansion, L.P. and FLNG Liquefaction, LLC | 91 | 2019 | 22.0 | 2.38 | 14.1 mtpa 1.9 Bcf/d |
| Sabine Pass, Louisiana | Sabine Pass Liquefaction, LLC (Cheniere) | 423 | 2016–2021 | 47.0 | 4.55 | 28.2 mtpa 3.71 Bcf/d |
| Cameron Parish, Louisiana | Venture Global Calcasieu | — | 2022–2023 | — | 1.70 | — |
| Total | 1,038 | 128.1 | 14.23 | 77.7 mtpa 10.22 Bcf/d |
NOTES: Bcf/d = billion cubic feet per day; BCM = billion cubic meters; mtpa = million tons per year. Most U.S. terminals have a single-train size of 4.7 mtpa. Elba and Venture Global went a different route with smaller liquefaction units.
SOURCE: Committee analysis of FERC data, https://www.ferc.gov/media/us-lng-export-terminals-existing-approved-not-yet-built-and-proposed and Poten & Partners data, presentation to the committee, January 25, 2023.
NOTE: Bcfd = billion cubic feet per day.
SOURCE: Adapted from Federal Energy Regulatory Commission, “U.S. LNG Export Terminals–Existing, Approved Not Yet Built, and Proposed,” February 2024, https://www.ferc.gov/media/us-lng-export-terminals-existing-approved-notyet-built-and-proposed.
volume of liquid, most LPG exports are propane (62% in 2022), followed by ethane (20%) and butane (18%).
Global demand for U.S. propane and ethane reached record levels again in 2023. Export market growth for both propane and ethane is driven by their use as feedstocks to make propylene and ethylene, which are petrochemicals that go into a wide range of manufactured products.37
Most LPG imports to the United States come via rail from Canada. Only small amounts are imported via water, typically from African countries
___________________
37EIA, “Monthly U.S. Propane Exports in March 2023 Reach a Record High,” Today in Energy, June 6, 2023, https://www.eia.gov/todayinenergy/detail.php?id=56720; EIA, “U.S. Ethane Exports Set a Monthly Record in March 2023,” June 12, 2023, https://www.eia.gov/todayinenergy/detail.php?id=56780.
NOTE: Kbbl/year = thousand barrels per year; LPG = liquefied petroleum gas.
SOURCE: EIA data for propane, butane, isobutane, and ethane, https://www.eia.gov/petroleum/data.php.
delivering to New England. Puerto Rico and other U.S. territories also import LPG by vessel.38
Destinations of U.S. LPG Exports
The United States exports LPG all over the world. Top destinations in 2022 were Asia (46%), Europe (20%), and Mexico (9%), as shown in Table 2-7.
Global LPG Carrier Fleet
LPG carriers use several types of cargo containment systems, driven largely by the size of the LPG carrier. The cargo systems on the smallest LPG carriers use full pressurization, and the largest LPG carriers use full refrigeration. The dominant cargo systems and LPG carrier capacity categories are broadly defined as follows:
- Fully pressurized: less than 10,000 CBM capacity
- Semi-pressurized/semi-refrigerated: 2,500–30,000 CBM capacity
___________________
38EIA, “Petroleum Supply Annual,” Volume 1, released August 31, 2023, https://www.eia.gov/petroleum/supply/annual/volume1; RBN Energy LLC, RBN Energy NGL Voyager, September 17, 2023, https://rbnenergy.com/products/voyager.
TABLE 2-7 U.S. Liquefied Petroleum Gas, 2022 Exports by Region
| Destination | With Ethane | Excluding Ethane |
|---|---|---|
| Africa | 6.0% | 6.9% |
| Asia | 45.6% | 44.0% |
| Canada | 4.0% | 0.5% |
| Caribbean | 2.0% | 3.0% |
| Central America | 2.0% | 2.9% |
| Europe | 19.7% | 19.0% |
| Mexico | 8.9% | 9.6% |
| Middle East | 2.0% | 2.9% |
| Oceania | 4.0% | 4.5% |
| South America | 5.8% | 6.7% |
| Total | 100% | 100% |
SOURCE: Committee analysis of EIA data, https://www.eia.gov/petroleum/data.php.
- Fully refrigerated, large: 30,000–60,000 CBM capacity
- Fully refrigerated, very large gas carriers: greater than 75,000 CBM capacity
In addition, specialized ethylene/ethane carriers are semi-pressurized/fully refrigerated and can range in capacity up to 34,000 CBM. This size vessel is typically used for export markets in Latin America and Europe. VLECs of a capacity greater than 80,000 CBM began to be delivered in 2016. These VLECs are mostly the fully refrigerated type and serve on dedicated long-haul export routes between the United States and Asia.39
Fleet Characteristics
As of 2022, the cargo capacity of the global fleet of LPG carriers ranged from 99 CBM to 96,550 CBM, while LPG carriers calling at U.S. ports and used for export ranged from 3,430 CBM to 96,550 CBM. Because U.S. ports saw only foreign-flag vessels at or above 3,430 CBM, the discussion of the global fleet of LPG carriers is limited to those greater than 3,400 CBM.40 There are no U.S.-flag LPG carriers.
___________________
39EIA, “Natural Gas Weekly Update,” June 10, 2021. See also https://www.ineos.com/inch-magazine/articles/issue-10/enter-the-dragons.
40S&P Global’s IHS Vessel Database, https://www.spglobal.com/marketintelligence/en/mi/products/sea-web-vessel-search.html. The global fleet as defined here includes all liquefied gas carriers carrying ethane and identified as a “Combination Gas Tanker (LNG/LPG).”
There are 1,254 vessels in the global fleet of LPG carriers. The gas capacity, age, length, beam, draft, and deadweight characteristics of the global LPG carrier fleet are shown in Table 2-8. Given the wide range of LPG carrier sizes, Table 2-9 summarizes vessel characteristics by LPG carrier size ranges. Vessels with capacities greater than 60,000 CBM are the most numerous, making up 31% of the global LPG fleet.
As with the U.S.-trading LNG carrier fleet, examining the age of the U.S.-trading LPG carrier fleet over the period 2013–2023 reveals that as exports increased, the demand for vessels was met by building new or using younger LPG carriers instead of bringing more vessels of advanced age into the U.S. trade. The number of LPG carriers <1 year of age trading at U.S. ports increased dramatically from less than 5 in 2013 to 27 in 2015 and 35 in 2016. The first wave of new vessels ended in 2018; between 2019
TABLE 2-8 Characteristics of Global In-Service LPG Carrier Fleet (≥3,400 CBM), 2022
| Minimum | Maximum | Average | |
| Gas Capacity, CBM | 3,400 | 96,550 | 35,353 |
| Age, Years | <1 | 51 | 12.3 |
| Length, Meters | 86 | 232 | 160 |
| Beam, Meters | 14.0 | 38.4 | 25.6 |
| Draft, Meters | 4.2 | 16.8 | 9.1 |
| Deadweight (DWT) | 2,150 | 64,220 | 25,624 |
NOTE: CBM = cubic meters; DWT = deadweight tonnage; LPG = liquefied petroleum gas.
SOURCE: Committee analysis of S&P Global’s IHS Sea-Web database.
TABLE 2-9 Global LPG Carrier Fleet (≥3,400 CBM) by Size Range, 2022
| Size Range, CBM | 3,400–5,000 | 5,000–20,000 | 20,000–60,000 | >60,000 |
|---|---|---|---|---|
| Gas Capacity, Average, CBM | 4,076 | 8,962 | 32,269 | 82,143 |
| Number | 309 | 297 | 257 | 391 |
| Age, Average | 14.7 | 14.5 | 10.9 | 9.8 |
| Length Average, Meters | 99 | 124 | 173 | 228 |
| Beam Average, Meters | 16.5 | 19.4 | 27.6 | 36.1 |
| Draft Average, Meters | 5.7 | 7.8 | 10.4 | 11.9 |
| Deadweight (DWT) | 4,016 | 9,315 | 26,214 | 54,700 |
NOTE: CBM = cubic meters; DWT = deadweight tonnage; LPG = liquefied petroleum gas.
SOURCE: Committee analysis of S&P Global’s IHS Sea-Web database.
NOTES: Each vessel is counted once per year; includes imports and exports. U.S.trading fleet refers to the fleet of vessels that regularly trade in the United States.
SOURCE: U.S. Coast Guard data (provided to the committee), 2023.
and 2023, new LPG carriers numbered between 17 and 22 per year. The median age of the U.S.-trading fleet began at age 7 in 2013, then dropped to age 3 by 2018, before reaching age 7 again in 2023.41 Figures 2-12 and 2-13 break down new LPG carriers and the median and maximum ages of the U.S.-trading fleet from 2013 to 2023.
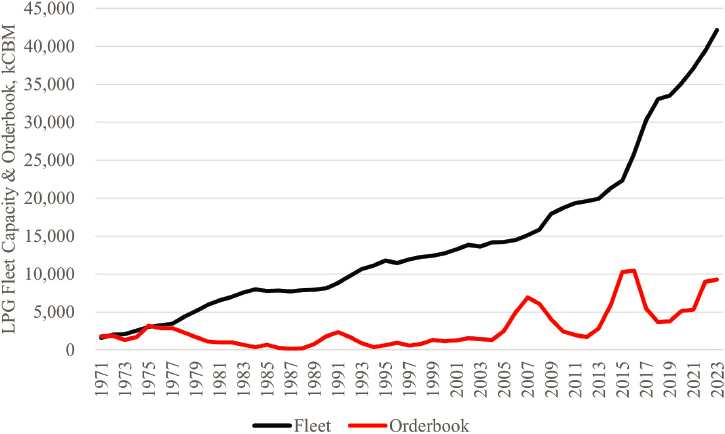
To meet the growing demand for international trade, the LPG carrier fleet has rapidly increased in total capacity. In 1978, the LPG tanker fleet had a total capacity of 1.6 million CBM. In 2023, the LPG tanker fleet had grown to a total capacity of 42.2 million CBM, 9.6 times its 1978 capacity. More than half of this increase has occurred since 2013.42 The increase in the capacity of the global LPG carrier fleet and orderbook (in vessel capacity, kCBM) from 1971 to 2023 is shown in Figure 2-14.
For the U.S.-trading LPG carrier fleet, 473 different foreign-flag LPG carriers called at U.S. ports in 2022.43 Compared to the global LPG carrier fleet, the size of the vessels in the U.S.-trading, foreign-flag LPG carrier fleet is larger, averaging 55,300 CBM versus 35,400 CBM; the U.S.-trading fleet
___________________
41U.S. Coast Guard data (provided to the committee), 2023.
42Committee analysis of data from Clarksons’ Shipping Review & Outlook 1999 and Autumn 2023, https://www.clarksons.com/research.
43LPG carriers calling at U.S. ports in 2022 were identified using Automatic Identification System data.
NOTE: Each vessel is counted once per year; includes imports and exports.
SOURCE: U.S. Coast Guard data (provided to the committee), 2023.
NOTES: kCBM = thousand cubic meters; LPG = liquefied petroleum gas. Order-book includes vessels where a confirmed contract has been reported.
SOURCE: Committee analysis of data from Clarksons’ Shipping Review & Outlook 1999 and Autumn 2023, https://www.clarksons.com/research.
TABLE 2-10 Global Versus U.S.-Trading LPG Tanker Fleets (>3,400 CBM), 2022
| Global Fleet | U.S.-Trading Fleet | |
| Number of LPG Tankers | 1,262 | 473 |
| Gas Capacity, Average (CBM) | 35,353 | 55,328 |
| Gas Capacity, Minimum (CBM) | 3,400 | 3,430 |
| Gas Capacity, Maximum (CBM) | 96,550 | 96,550 |
| Age, Average | 12.3 | 8.8 |
| Age, Minimum | 1 | 1 |
| Age, Maximum | 51 | 33 |
NOTES: CBM = cubic meters; LPG = liquefied petroleum gas. Averages are not weighted by port calls.
SOURCE: Committee analysis of S&P Global’s IHS Sea-Web database, https://www.spglobal.com/marketintelligence/en.
is also younger, averaging 8.8 years versus 12.3 years. The oldest vessel in the U.S.-trading fleet, age 33, was constructed after IMO’s adoption of the IGC Code in 1986. A comparison between the U.S.-trading LPG tank fleet that calls at U.S. ports and the foreign-flag LPG tanker fleet (≥3,400 CBM) is provided in Table 2-10.
Fleets by Flag State
Fifty-seven flag states are represented among the global LPG carrier fleet, while only 26 flag states participated in the U.S. LPG trade in 2022. Singapore, Panama, Liberia, and the Marshall Islands are the four flag states with the largest number of vessels in both the global (54.6%) and U.S.-trading LPG fleets (63.7%). Table 2-11 provides a comparison of the global versus U.S.-trading LPG carrier fleets by flag state.
U.S. LPG Terminal Facilities
The need for specialized terminals concentrates LPG export activity. The United States has nine LPG export terminals and an additional three terminals specialized in the export of ethane. Most of these export terminals are concentrated along the Texas coast.44 A listing and details of these terminals, including capacity, are provided in Table 2-12. Two LPG import
___________________
44For a map of U.S. LPG terminals, please see RBN Energy, LPG Voyage Report, 2023, https://rbnenergy.com/products/voyager.
TABLE 2-11 Global Versus U.S.-Trading LPG Carrier Fleets by Flag State, 2022
| Global Trading Fleet, by Flag | U.S.-Trading Fleet, by Flag | |||
| Number | Percent | Number | Percent | |
| Algeria | 6 | 0.5 | — | — |
| Antigua and Barbuda | 11 | 0.9 | 5 | 1.1 |
| Bahamas | 26 | 2.1 | 20 | 4.2 |
| Bangladesh | 3 | 0.2 | — | — |
| Barbados | 1 | 0.1 | — | — |
| Belgium | 21 | 1.7 | 11 | 2.3 |
| Belize | 5 | 0.4 | — | — |
| Bermuda | 1 | 0.1 | — | — |
| Brazil | 9 | 0.7 | — | — |
| Cameroon | 6 | 0.5 | 1 | 0.2 |
| China, People’s Republic of | 70 | 5.6 | 1 | 0.2 |
| Chinese Taipei | 3 | 0.2 | — | — |
| Comoros | 3 | 0.2 | — | — |
| Croatia | 3 | 0.2 | — | — |
| Cuba | 3 | 0.2 | — | — |
| Cyprus | 4 | 0.3 | — | — |
| Denmark | 18 | 1.4 | 14 | 3.0 |
| Djibouti | 1 | 0.1 | — | — |
| France | 1 | 0.1 | — | — |
| France | 3 | 0.2 | 3 | 0.6 |
| Gabon | 3 | 0.2 | — | — |
| Germany | 1 | 0.1 | — | — |
| Gibraltar | 1 | 0.1 | — | — |
| Greece | 9 | 0.7 | 3 | 0.6 |
| Guinea-Bissau | 1 | 0.1 | — | — |
| Hong Kong, China | 34 | 2.7 | 20 | 4.2 |
| India | 23 | 1.8 | 1 | 0.2 |
| Indonesia | 61 | 4.9 | 7 | 1.5 |
| Isle of Man | 19 | 1.5 | 15 | 3.2 |
| Italy | 13 | 1.0 | 3 | 0.6 |
| Japan | 3 | 0.2 | 3 | 0.6 |
| Global Trading Fleet, by Flag | U.S.-Trading Fleet, by Flag | |||
| Number | Percent | Number | Percent | |
| Korea, South | 18 | 1.4 | 2 | 0.4 |
| Kuwait | 5 | 0.4 | — | — |
| Liberia | 182 | 14.5 | 84 | 17.8 |
| Malaysia | 4 | 0.3 | — | — |
| Malta | 59 | 4.7 | 26 | 5.5 |
| Marshall Islands | 93 | 7.4 | 43 | 9.1 |
| Netherlands | 19 | 1.5 | — | — |
| Nigeria | 1 | 0.1 | — | — |
| Norway | 31 | 2.5 | 28 | 5.9 |
| Palau | 5 | 0.4 | 1 | 0.2 |
| Panama | 260 | 20.7 | 85 | 18.0 |
| Peru | 3 | 0.2 | — | — |
| Philippines | 1 | 0.1 | — | — |
| Portugal | 8 | 0.6 | 2 | 0.4 |
| Sao Tome and Principe | 3 | 0.2 | — | — |
| Saudi Arabia | 3 | 0.2 | — | — |
| Singapore | 150 | 12.0 | 89 | 18.8 |
| Sri Lanka | 3 | 0.2 | — | — |
| Saint Kitts and Nevis | 1 | 0.1 | — | — |
| Tanzania (Zanzibar) | 5 | 0.4 | — | — |
| Thailand | 18 | 1.4 | — | — |
| Togo | 1 | 0.1 | — | — |
| Turkey | 4 | 0.3 | 3 | 0.6 |
| United Kingdom | 3 | 0.2 | 2 | 0.4 |
| Unknown | 4 | 0.3 | — | — |
| Vietnam | 18 | 1.4 | 1 | 0.2 |
| Totals | 1,262 | 473 | ||
NOTES: LPG = liquefied petroleum gas. Global fleet includes only LPG carriers larger than 3,400 cubic meters.
SOURCE: Committee analysis of S&P Global’s IHS Sea-Web database, https://www.spglobal.com/marketintelligence/en.
TABLE 2-12 U.S. LPG Marine Export Terminals, 2023
| Company | Terminal | Products | Nameplate (Export) Capacity (Mb/d) |
|---|---|---|---|
| Enterprise Products | Houston, TX | LPG | 763 |
| Enterprise Products | Morgan’s Point, TX | Ethane | 240 |
| Targa Resources | Galena Park, TX | LPG | 490 |
| Energy Transfer | Nederland, TX | LPG | 490 |
| Ethane | 180 | ||
| Phillips 66 | Freeport, TX | LPG | 260 |
| Buckeye/Trafigura | Corpus Christi, TX | LPG | 33 |
| EnLink | Riverside, LA | LPG | 17 |
| Energy Transfer | Marcus Hook, PA | LPG | 300 |
| Ethane | 75 | ||
| NGL Energy Partners | Chesapeake, VA | LPG | 15 |
| AltaGas (Petrogas) | Ferndale, WA | LPG | 50 |
NOTES: LPG = liquefied petroleum gas; Mb/d = million barrels per day. Nameplate capacity specifies the amount of LNG produced in a given period under normal operating conditions, based on the engineering design of a facility.
SOURCE: Data from RBN Energy LPG Voyage Report, 2023, https://rbnenergy.com/products/voyager.
terminals are located in Rhode Island and New Hampshire, with additional import terminals in Hawaii, Puerto Rico, other U.S. territories.
As of 2023, the total U.S. export capacity for LPG was 2,418 Mb/d, with an additional 495 Mb/d from terminals specializing in ethane. Export capacity on the East Coast was 315 Mb/d of LPG, with an additional 75 Mb/d for ethane, while export capacity at Ferndale, Washington, on the West Coast was 50 Mb/d. The largest concentration of export capacity was 2,053 Mb/d in the Gulf Coast, with an additional 420 Mb/d for ethane.
The locations of LPG terminals and the economics of LPG exports lead to regional differences in export destinations. Analysis of waterborne LPG exports (excluding ethane) from April to August 2023 shows that exports from the U.S. West Coast are entirely to Asia. Asia is also the leading destination for Gulf Coast LPG exports. Europe is the leading destination for U.S. LPG waterborne exports from the East Coast.45 For routes to Asia, depending on conditions, travel from the Gulf Coast uses the Panama Canal
___________________
45RBN Energy LLC, RBN Energy NGL Voyager, September 17, 2023. https://rbnenergy.com/products/voyager.
TABLE 2-13 Waterborne LPG Export Destination by Coast, by Percentage, 2023
| Destination | East Coast | Gulf Coast | West Coast |
|---|---|---|---|
| Africa | 16.5 | 6 | — |
| Asia | 19.5 | 58 | 100 |
| Australia | — | 1 | — |
| Canada | 1 | — | — |
| Caribbean | 2 | 3 | — |
| Europe | 54.8 | 11 | — |
| Latin America | 6.2 | 20 | — |
| Middle East | — | 1 | — |
| Total | 100 | 100 | 100 |
NOTE: Excludes ethane.
SOURCE: Committee analysis of RBN Energy data, https://rbnenergy.com, accessed December 31, 2023.
while voyages from the East Coast may involve the Suez Canal. The breakdown of regional differences in export destinations is shown in Table 2-13.
FUTURE LIQUEFIED GAS EXPORTS
Whether the tremendous growth in U.S. exports of LNG and LPG since 2010 continues to increase, stabilizes at current levels, or declines depends on global demand and the ability of the U.S. export supply chain to meet this demand, in competition with other global suppliers. As will be discussed in Chapter 3, the Coast Guard and its safety assurance and environmental protection responsibilities are part of this supply chain. This section outlines expectations for future U.S. exports of liquefied gases through the 2030s and 2040s and highlights continued global demand, the importance of U.S. manufacturing capacity, and the potential impacts of national and international policies for decarbonization.
LNG Export Forecasts
The key factors affecting future U.S. LNG exports are global demand and U.S. LNG manufacturing capacity at the export terminals. The capacity of the LNG carrier fleet has successfully expanded to meet past demand and is not likely to be a limiting factor for future exports. In addition, natural gas pipeline capacity (existing and under construction) to the export terminals is likely to be more than adequate to meet future LNG manufacturing
capacity.46 Therefore, the discussion below focuses on U.S. LNG manufacturing capacity for export and global demand.
Global Demand
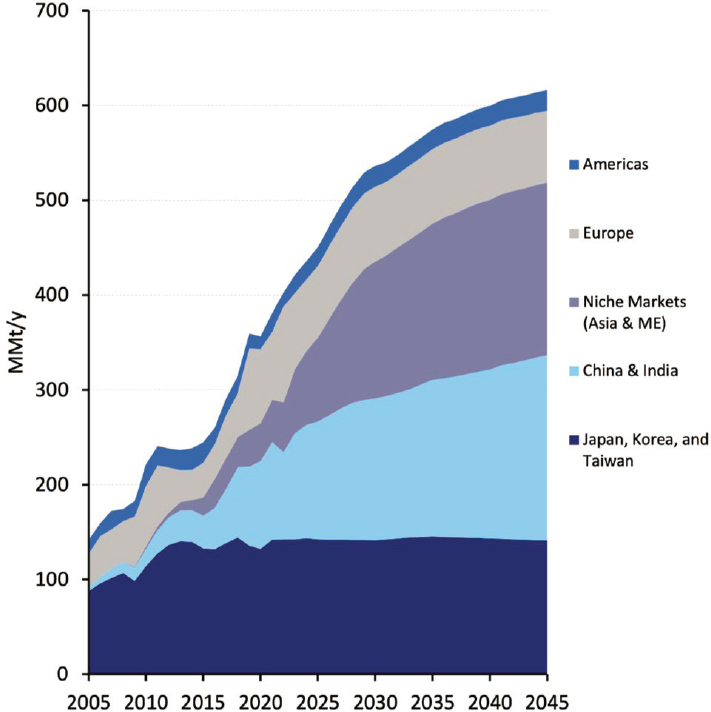
The increase in global demand for LNG is expected to continue through 2045. Poten & Partners, an international LNG carrier broker and research firm, projected in January 2023 that global demand for LNG will reach 450 MMt in 2025 and 616 MMt/y by 2045—a 37% increase. Demand in Europe; the Americas; and Japan, Korea, and Taiwan will mature and stabilize. The growth in demand is expected to come from China, India, and niche markets in other Asian countries and in the Middle East. Figure 2-15 is a graphic representation of the January 2023 forecast from Poten & Partners.
U.S. LNG Operating Capacity
As discussed earlier in this chapter, as of February 2024, 7 LNG export terminals are currently operating (capacity of 14.23 Bcf/d, 108.15 MMt/y), 7 export terminals are under construction (capacity of 16.93 Bcf/d, 126.89 MMt/y), and another 11 export terminals (capacity of 15.04 Bcf/d, 112.72 MMt/y) have received federal approval but have not commenced construction. In total, LNG manufacturing capacity is projected to reach 347.8 MMt/y, or more than 16.9 Tcf/y, once all terminals become operational.
The final investment decision (FID) process for LNG liquefaction facilities indicates a high level of probability that nearly all the manufacturing capacity of currently operating and under construction LNG facilities will be used. Development financing for liquefaction facilities depends on having SPAs in place for a large portion (typically more than 90%) of expected production before issuing the FID. The financing banks generally require that SPAs and other liquefaction-related contracts cover sufficient quantities of the product to ensure debt service coverage for the duration of the financing period. Therefore, even for LNG manufacturing facilities still under construction, future annual volumes sold are likely to be close to operating capacity.47
___________________
46EIA, “New Pipelines Will Bring Significant Volumes of Natural Gas to New LNG Export Terminals,” Today in Energy, December 12, 2023, https://www.eia.gov/todayinenergy/detail.php?id=61062.
47EIA, “LNG Sale and Purchase Agreements Signed in 2023 Support U.S. LNG Projects,” February 7, 2024, https://www.eia.gov/todayinenergy/detail.php?id=61384.
NOTE: MMt/y = million tons per year.
SOURCE: Poten & Partners, presentation to the committee, January 25, 2023.
U.S. LNG Export Forecasts
Two U.S. LNG export forecasts, produced by Poten & Partners and by the U.S. Energy Information Administration (EIA), agree that U.S. LNG exports will continue to increase through at least 2030 and maintain these high levels through 2050.
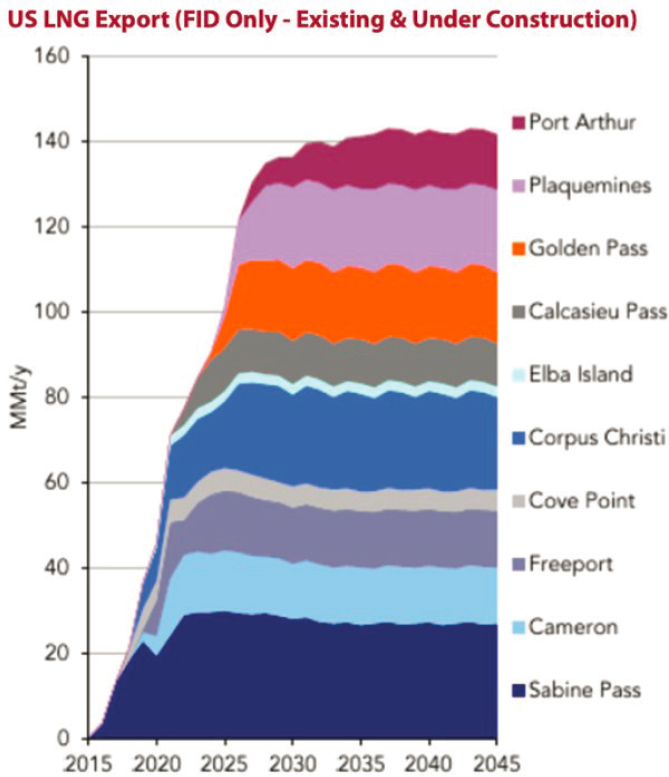
Poten & Partners bases its LNG export forecast on an assessment of likely facility production rather than “nameplate” capacities, which are the volumes approved by the federal government. As of April 2023, Poten & Partners estimated U.S. exports stabilizing just above 140 MMt/y in 2030, based on production from 10 export terminals. Figure 2-16 shows the LNG
NOTES: Includes existing terminals and those under construction. MMt/y = million tons per year.
SOURCE: Poten & Partners, Global LNG Outlook, April 2023.
export forecast from Poten & Partners as of April 2023. Since this estimate, another four export terminals have received their FID and begun construction. The Poten & Partners high scenario for U.S. LNG exports exceeds 190 MMT/y by 2030.48
___________________
48Poten & Partners, Global LNG Outlook, April 2023; Poten & Partners, presentation to the committee, January 25, 2023.
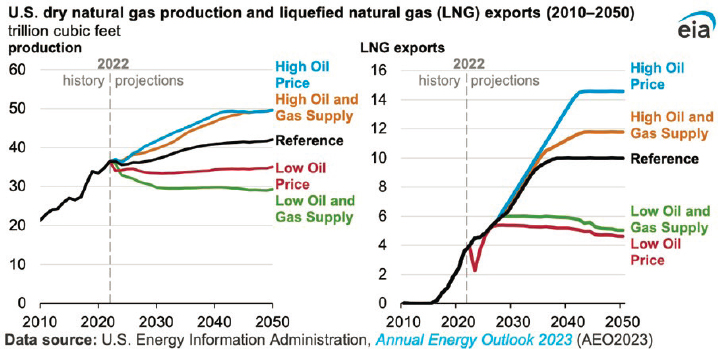
SOURCE: EIA, “U.S. Natural Gas Production and LNG Exports Will Likely Grow Through 2050 in AEO2023,” Today in Energy, April 27, 2023.
EIA includes LNG exports as part of its long-term forecasts in its Annual Energy Outlook (AEO) 2023. The AEO’s reference baseline projects that LNG exports will increase 152% between 2022 and 2050, reaching a plateau of 10 Tcf/y in the mid-2030s. The AEO’s highest LNG export scenario, plateauing at more than 14 Tcf/y, occurs under high oil prices, which would make building additional LNG export capacity economical. Only under the lowest scenario does U.S. LNG export capacity go underutilized. The AEO’s long-term forecast of U.S. natural gas production and LNG exports under the various scenarios is shown in Figure 2-17.49
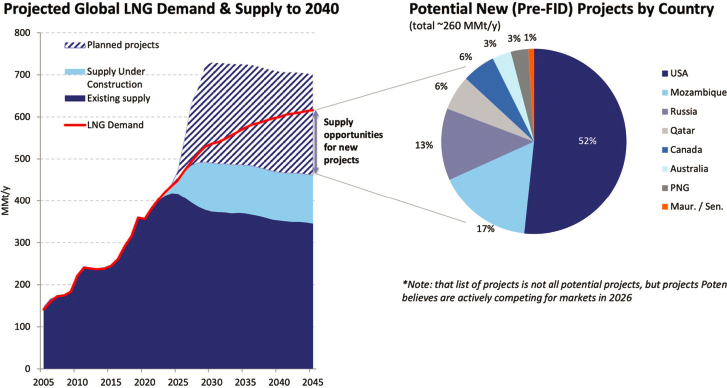
Qatar, Russia, Mozambique, and Canada are also positioned to increase their exports of LNG. Although planned LNG manufacturing projects worldwide exceed global demand, the United States is in the strongest position to capture this demand. Poten & Partners forecasts that the United States will capture more than 50% of the increase in global demand by 2045. Figure 2-18 illustrates the projected global demand and sources of supply in 2045.
___________________
49EIA, Annual Energy Outlook 2023, https://www.eia.gov/outlooks/aeo; EIA, “U.S. Natural Gas Production and LNG Exports Will Likely Grow Through 2050 in AEO2023,” Today in Energy, April 27, 2023, https://www.eia.gov/todayinenergy/detail.php?id=56320.
NOTE: MMt/y = million tons per year.
SOURCE: Poten & Partners, presentation to the committee, January 25, 2023.
Forecast of LPG Exports
Because LPGs are produced as part of oil refining or natural gas extraction and production, future exports depend in part on domestic and global markets for oil and natural gas. If domestic and global demand for oil and natural gas remains high, more propane, butane, and ethane will be available for export from the United States. Forecasts for LPG exports also take into consideration global demand for propane, butane, and ethane; the capacity of U.S. terminals to prepare the products for export; and the availability of LPG carriers.50
RBN Energy, LLC, a firm dedicated to energy market analytics, forecasts LPG exports to increase 82% from 2022 to 2040, at a compound annual growth rate of 3.4%.51 A graph presenting the forecast from RBN Energy, LLC, of LPG exports is shown in Figure 2-19.
___________________
50Todd Root, “Can’t Get Enough—Gulf Coast LPG Export Dock Capacity Maxing Out; What Happens to U.S. Markets?” RBN Energy LLC, December 11, 2023, https://rbnenergy.com/cant-get-enough-gulf-coast-lpg-export-dock-capacity-maxing-out-what-happens-to-us-markets.
51RBN Energy, RFA Future of Fuels, 2023, https://rbnenergy.com/products/future-of-fuels.
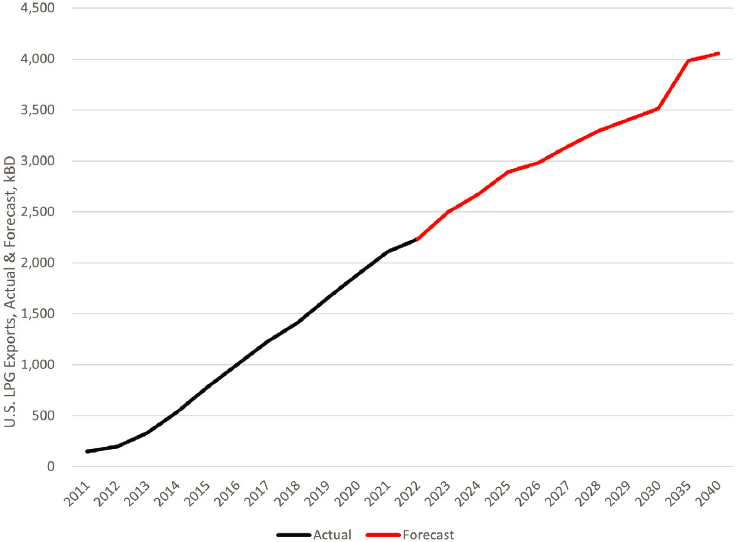
NOTES: kBD = thousand barrels per day. Actual data from 2011 through 2022 match EIA data shown previously in Figure 2-17. LPG exports include propane, butane, and ethane.
SOURCE: Committee analysis of data from RBN Energy’s RFA Future of Fuels. https://rbnenergy.com/products/future-of-fuels.
Decarbonization and Future Exports
Natural gas and propane produce carbon emissions when burned for heat or to make electricity, which contributes to climate change. Methane is also a potent greenhouse gas when leaked during natural gas production and transport. The United States and many other countries have made commitments to decarbonize their economies. Meeting these commitments would require significant reductions of greenhouse gas emissions in the 2030s and 2040s, but the impact on exports is uncertain.
Because the United States is a major producer of natural gas/LNG and LPG, decarbonization efforts at home and abroad can create complex market dynamics. If U.S. decarbonization policies lower domestic demand for natural gas and propane, more would become available for export. Because countries such as China and India still depend heavily on coal for electricity production, following the path of the United States and switching
to natural gas as an intermediate step in decarbonization would have large air pollution reduction impacts and at least some carbon reduction impacts.52 International decarbonization policies could also lower global demand for LNG. For example, Japan has been bringing its nuclear power plants back online slowly after the 2011 earthquake and tsunami nuclear disaster led to a national shutdown. As a result, Japan’s demand for LNG imports is declining.53
Decarbonization policies could regulate or incentivize reductions in U.S. oil and natural gas production or LNG and LPG exports as part of meeting climate change goals. For example, current U.S. policy is fostering the electrification of the transportation sector via electric vehicles that will draw on the U.S. electrical grid. However, natural gas still generates 43% of U.S. electricity.54 Electrification of the transportation sector may reduce domestic demand for American oil, affecting LPG production from the oil sector, while maintaining high domestic demand for natural gas. The federal government also could curtail exports directly as part of its authority over approving new export facilities. When the White House put a temporary pause on approving new LNG export facilities in January 2024, the federal government was exercising its authority over exports. The pause is intended to allow the federal government to review “the evolving understanding of the market need for LNG, the long-term supply of LNG, and the perilous impacts of methane on our planet” and develop policy accordingly.55
Decarbonization could also increase the number of other types of gas carriers, in addition to LNG and LPG carriers, visiting U.S. ports. LNG and LPG are also used as petrochemical feedstocks and consequently cannot be fully displaced by renewables. Hydrogen and ammonia are key substitute, carbon-free fuel sources for industrial uses, including for shipping. Carbon capture and storage (CCS) projects require the shipment of carbon dioxide, and assuming that the use of hydrogen and ammonia as carbon-free fuels
___________________
52IEA, “Global Coal Demand Expected to Decline in Coming Years,” December 15, 2023, https://www.iea.org/news/global-coal-demand-expected-to-decline-in-coming-years.
53EIA, “Nuclear Reactor Restarts in Japan Have Reduced LNG Imports for Electricity Generation,” February 8, 2024, https://www.eia.gov/todayinenergy/detail.php?id=61386.
54EIA, “What Is U.S. Electricity Generation by Energy Source?” last updated February 29, 2024, https://www.eia.gov/tools/faqs/faq.php?id=427&t=3.
55“Biden-Harris Administration Announces Temporary Pause on Pending Approvals of Liquefied Natural Gas Exports,” January 26, 2024, https://www.whitehouse.gov/briefing-room/statements-releases/2024/01/26/fact-sheet-biden-harris-administration-announces-temporary-pause-on-pending-approvals-of-liquefied-natural-gas-exports.
and CCS projects expand, global markets are likely to develop that depend on waterborne trade.56
CHAPTER SUMMARY
Since 2010, the United States has shifted from a net importer of LNG and LPG to a top global exporter. The United States now exports LNG and LPG all over the world. Exports of LNG increased from near zero in 2015 to 4,343 Bcf in 2023; annual LPG exports rose 570% between 2013 and 2022. The maritime industry responded to these changes by building new and larger gas carriers to transport U.S. LNG and LPG exports. For both LNG and LPG, the U.S.-trading fleet in 2022 had a greater average capacity and younger average age than the global LNG and LPG fleets. Even with vessels’ increasing capacity, the number of gas carrier arrivals at U.S. ports increased by more than 70% between 2018 and 2022, reaching 4,438 vessels or approximately 12 vessels per day.
Government and industry forecasts for U.S. liquefied gas exports through the 2040s expect a continued increase in LNG exports until the early 2030s, followed by a sustained high level of exports. LPG exports are expected to continue to increase through 2040. The impact of the increases in export volumes on Coast Guard activity level in estimated in Chapter 3.
___________________
56National Academies of Sciences, Engineering, and Medicine, The Coast Guard’s Next Decade: An Assessment of Emerging Challenges and Statutory Needs (Washington, DC: The National Academies Press, 2023), 105–110, https://doi.org/10.17226/27059; Matteo B. Bertagni et al., “Minimizing the Impacts of the Ammonia Economy on the Nitrogen Cycle and Climate,” PNAS, November 2023, https://doi.org/10.1073/pnas.2311728120.


