Strategies to Address Utility Issues During Highway Construction (2024)
Chapter: 3 PRACTITIONER SURVEY RESULTS
CHAPTER 3. PRACTITIONER SURVEY RESULTS
INTRODUCTION
This chapter summarizes the results of the practitioner survey the research team completed to identify risk factors affecting the utility process during the project delivery process, primarily during construction.
Appendix A lists the questions that were included in the survey. After building the survey instrument using a web-based survey platform, the research team sent email invitations to officials and members of the following organizations:
- AASHTO Committee on Right-of-Way, Utilities, and Outdoor Advertising Control.
- AASHTO Committee on Construction.
- American Public Works Association (APWA) Committee on Utilities and Public Right-of-Way.
- APWA Committee on Transportation.
- ASCE’s Utility Engineering and Surveying Institute.
- Relevant Associated General Contractors (AGC) and American Road and Transportation Builders Association (ARTBA) committees.
In some cases, the research team was able to send emails directly to members. In other cases, organization officials preferred to receive a single email invitation from the research team and then send the invitation to members. In addition, the research team posted the invitation on social media outlets.
BASIC INFORMATION ABOUT RESPONDENTS
The research team received 194 responses, of which 192 responses were from 44 states and two responses were from Quebec (Canada). There were no responses from Alaska, Hawaii, Idaho, Maine, Mississippi, New Hampshire, the District of Columbia, or Puerto Rico. Figure 9 shows the total number of responses per state, but not the two responses from Canada. The highest number of responses was from Texas (29), followed by Pennsylvania (18) and California (11).
As Figure 10 shows, 99 respondents were affiliated with project owner agencies, followed by 51 responses from consultants, 34 responses from contractors, and seven responses from utility owners. A total of three respondents were involved with sales or manufacturing of materials for utility installations. Within their organization, as Figure 11 shows, most respondents were affiliated with headquarters (132 respondents), followed by district or region office (32 respondents) and local office (30 respondents).

Numbers in parenthesis indicate the total number of responses from a state.
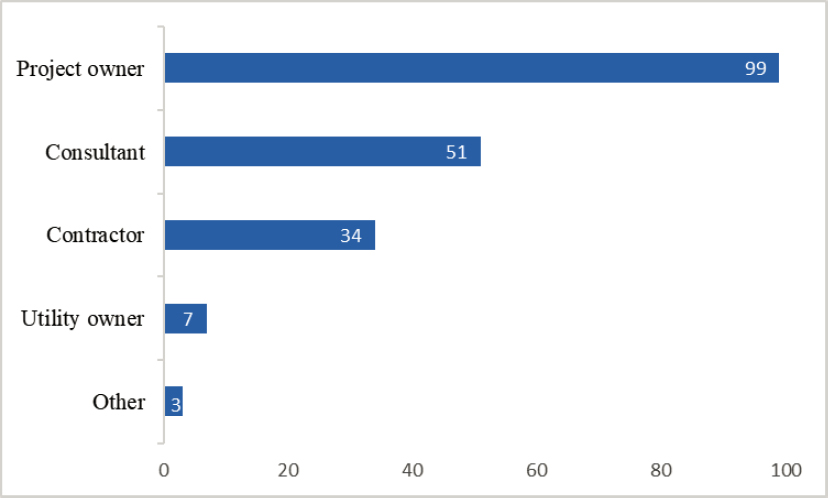

Figure 12 summarizes the involvement of respondents in the project delivery process. This question was multiple choice, which enabled respondents to select more than one project delivery phase. Of the 194 respondents, most respondents indicated they were involved in the construction phase (139), followed by detailed design (120), preliminary design (109), and planning (63). One of the options was about involvement in design-build projects. A total of 98 respondents indicated they were involved in this type of projects.

Note: Respondents were typically involved in two or more phases.
Figure 13 further categorizes the role respondents play during the project delivery process. This question was also multiple choice. The most common role that respondents indicated was utility coordinator (93), followed by project manager (54), utility designer (36), and SUE provider (30). Project manager was the role that most respondents used in addition to other roles they selected (e.g., utility coordinator and project manager), suggesting that a substantial number of respondents used the term generically, instead of the more specific meaning associated with having overall responsibility for a highway project.

CAUSES OF PROJECT DELAYS AND COST INCREASES
Respondents were asked to rate risk factors on a scale from 1 (least frequent) to 5 (most frequent) in terms of how frequently the risk factors contribute to project delivery delays, project cost increases, and utility relocation delays. Appendix A shows the list of risk factors that were pre-populated in the survey instrument. Respondents could also type in additional risk factors (although the interface did not provide the option to rate these entries).
The risk factors were grouped by project delivery phase. Considering that the level of familiarity of respondents with each phase was likely different, the survey instrument allowed respondents to skip project phases completely (more specifically, project planning and design, highway construction, environmental process, and right-of-way acquisition). A subsequent survey section, which respondents could not skip, focused on utility process risks. After completing this section, the survey instrument gave respondents a second chance to answer questions related to the project delivery phases they had originally skipped.
Based on the number of responses and individual ratings for each risk factor, the research team calculated averages, first separately for project delivery delays, project cost increases, and utility relocation delays, and then by combining the ratings for these three categories assuming an equal weight for each category. The research team also prepared tables showing average ratings, with values ranging from 1 to 5. For visualization, table cells were color coded using a continuous gradation, with white used for the lowest value (i.e., 1.0), yellow used for the midpoint value (i.e., 3.0), and red used for the highest value (i.e., 5.0). Table 25 shows sample values and colors used for the color gradation.
Table 25. Symbology for Average Ratings and Standard Deviations.
| Lowest | Highest | ||||||||
| Symbology for average ratings | 1.0 | 1.5 | 2.0 | 2.5 | 3.0 | 3.5 | 4.0 | 4.5 | 5.0 |
Project Planning and Design
Table 26 shows risk factors and aggregated average scores provided by all respondents. Changes in highway design prior to letting was the highest rated risk factor in all three categories, followed by insufficient timeframe for detailed design. Insufficient or untimely funding for design was the lowest rated risk factor.
Table 26. Risk Factors – Project Planning and Design (Aggregated Average).
| Project Planning and Design Risk Factor | Aggregated | |||
|---|---|---|---|---|
| PD | PC | UD | All | |
| Insufficient or untimely funding for design | 2.3 | 2.5 | 2.7 | 2.5 |
| Insufficient timeframe for preliminary design | 2.6 | 2.6 | 2.8 | 2.7 |
| Insufficient timeframe for detailed design | 3.0 | 3.0 | 3.2 | 3.1 |
| Delays in highway design | 3.0 | 3.0 | 3.1 | 3.0 |
| Changes in highway design prior to letting | 3.3 | 3.4 | 3.6 | 3.5 |
PD = Project delivery delay PC = Project cost increase UD = Utility relocation delay
All = Weighted average score for PD, PC, and UD
Table 27 shows disaggregated average ratings by project owner, consultant, contractor, and utility owner. In general, as in Table 26, changes in highway design prior to letting was the highest rated risk factor, and insufficient or untimely funding for design was the lowest rated risk factor. However, responses varied depending on the stakeholder group. For example, utility owners rated delays in highway design higher than changes in highway design prior to letting. Significantly, contractors (and consultants to a lesser degree) rated insufficient timeframe for
detailed design, insufficient timeframe for preliminary design, and changes in highway design prior to letting higher than any other risk factor and any other stakeholder group in terms of the impact of those risks on utility relocation delays.
Table 27. Risk Factors – Project Planning and Design (Disaggregated Average).
| Project Planning and Design Risk Factor | Project Owner | Consultant | Contractor | Utility Owner | ||||||||||||
|---|---|---|---|---|---|---|---|---|---|---|---|---|---|---|---|---|
| PD | PC | UD | All | PD | PC | UD | All | PD | PC | UD | All | PD | PC | UD | All | |
| Insufficient or untimely funding for design | 1.8 | 2.1 | 2.1 | 2.0 | 2.8 | 3.0 | 3.1 | 3.0 | 2.9 | 3.1 | 3.5 | 3.1 | 2.6 | 2.4 | 2.7 | 2.6 |
| Insufficient timeframe for preliminary design | 2.4 | 2.2 | 2.3 | 2.3 | 2.8 | 2.9 | 3.2 | 3.0 | 3.3 | 3.3 | 3.9 | 3.5 | 2.4 | 2.9 | 2.4 | 2.6 |
| Insufficient timeframe for detailed design | 2.8 | 2.8 | 2.9 | 2.8 | 3.2 | 3.1 | 3.4 | 3.2 | 3.3 | 3.4 | 4.0 | 3.6 | 2.9 | 3.0 | 3.1 | 3.0 |
| Delays in highway design | 2.8 | 2.8 | 2.9 | 2.8 | 3.2 | 3.2 | 3.1 | 3.2 | 3.1 | 3.3 | 3.4 | 3.3 | 3.7 | 3.2 | 3.3 | 3.4 |
| Changes in highway design prior to letting | 3.3 | 3.3 | 3.5 | 3.4 | 3.4 | 3.7 | 3.7 | 3.6 | 3.3 | 3.6 | 3.8 | 3.6 | 3.7 | 3.0 | 3.0 | 3.2 |
The survey instrument enabled respondents to type in additional risk factors. Additional risk factors that respondents provided include the following:
- Project owner not allocating funds for SUE early in the project design phase.
- Use of proper SUE levels.
- Waiting to perform SUE later in the design process than when it should begin.
- Utility facilities not being located correctly prior to and after surveys.
- Unidentified underground utility facilities.
- Insufficient utility investigations.
- Inadequate conflict analysis.
- Technology and staffing.
- Dealing with city-owned utility facilities.
- Poor design.
- Scoping issues.
- Inadequate coordination.
- Right-of-way issues.
- Plat revisions (right-of-way related).
- Utility relocation cost changes.
- Abrupt changes in bid unit prices.
- Lack of communication or urgency from utility owner.
- Utility owner not having enough staff for the project.
- Right-of-way not acquired and cleared.
- Public vs. private business models.
- Engineers continuing to design up to project letting.
- Lack of sufficient detail in utility facility locations and unwillingness to design to avoid existing utility facilities.
- Lack of attention to utility facilities by consultants.
Highway Construction
As Table 28 shows, DSCs (new utility conflicts or utility conflicts that were not resolved properly during design) was the highest rated risk factor, followed by errors in plans, specifications, or cost estimates. Changes initiated by the project owner during construction was the third highest risk factor. Equipment shortages during construction and ineffective (late or inadequate) highway construction inspection were the lowest rated risk factors.
Table 28. Risk Factors – Highway Construction (Aggregated Average).
| Highway Construction Risk Factor | Aggregated | |||
|---|---|---|---|---|
| PD | PC | UD | All | |
| Insufficient or untimely funding for construction | 2.2 | 2.1 | 2.1 | 2.1 |
| Insufficient timeframe for highway construction | 2.8 | 2.8 | 2.7 | 2.8 |
| Higher unit costs for UR work items | 2.6 | 3.1 | 2.6 | 2.8 |
| Errors in plans, specifications, or cost estimates | 3.6 | 3.7 | 3.5 | 3.6 |
| Late start by highway contractor | 2.5 | 2.1 | 2.1 | 2.2 |
| DSCs (not related to utilities) | 2.9 | 3.1 | 2.4 | 2.8 |
| DSCs (new utility conflicts or utility conflicts that were not resolved properly during design) | 3.7 | 3.6 | 3.7 | 3.7 |
| Changes initiated by project owner during construction | 2.9 | 3.0 | 2.9 | 3.0 |
| Labor shortages during construction | 2.4 | 2.0 | 2.1 | 2.2 |
| Equipment shortages during construction | 1.8 | 1.8 | 1.8 | 1.8 |
| Inadequate work effort by highway contractor | 2.2 | 1.8 | 1.9 | 2.0 |
| Lack of compliance with industry standards or technical specifications during highway construction | 2.1 | 1.8 | 2.0 | 1.9 |
| Ineffective (late or inadequate) highway construction inspection | 2.0 | 1.8 | 1.7 | 1.8 |
| Weather | 2.8 | 2.6 | 2.5 | 2.6 |
Aggregated averages were similar in terms of the impact on project delays, project costs, and utility relocation delays. An exception was higher unit costs for UR work items, which rated significant higher in the category of project costs. Conversely, labor shortages during construction (and weather, although to a lower degree) rated higher in the category of project delays.
Table 29 shows disaggregated averages by project owner, consultant, contractor, and utility owner. DSCs (new utility conflicts or utility conflicts that were not resolved properly during design) and errors in plans, specifications, or cost estimates were the highest rated risk factors among project owners, consultants, and contractors. Contractors, in particular, rated these two risk factors considerably higher than any other factor and any other stakeholder group. Utility owners rated these risk factors high, but they also rated several other factors almost at the same level.
Table 29. Risk Factors – Highway Construction (Disaggregated Average).
| Highway Construction Risk Factor | Project Owner | Consultant | Contractor | Utility Owner | ||||||||||||
|---|---|---|---|---|---|---|---|---|---|---|---|---|---|---|---|---|
| PD | PC | UD | All | PD | PC | UD | All | PD | PC | UD | All | PD | PC | UD | All | |
| Insufficient or untimely funding for construction | 2.0 | 1.7 | 1.7 | 1.8 | 2.4 | 2.5 | 2.2 | 2.3 | 2.6 | 2.4 | 2.8 | 2.6 | 3.7 | 3.0 | 2.5 | 3.1 |
| Insufficient timeframe for highway construction | 2.5 | 2.4 | 2.3 | 2.4 | 2.9 | 3.3 | 2.6 | 2.9 | 3.4 | 3.5 | 3.7 | 3.5 | 2.7 | 3.3 | 2.8 | 2.9 |
| Higher unit costs for UR work items | 2.3 | 2.6 | 2.2 | 2.4 | 2.9 | 3.5 | 2.9 | 3.1 | 3.1 | 3.6 | 3.3 | 3.4 | 2.7 | 3.7 | 3.3 | 3.2 |
| Errors in plans, specifications, or cost estimates | 3.4 | 3.5 | 3.3 | 3.4 | 3.3 | 3.4 | 3.2 | 3.3 | 4.3 | 4.5 | 4.4 | 4.4 | 3.3 | 3.3 | 3.0 | 3.2 |
| Late start by highway contractor | 2.5 | 1.9 | 1.9 | 2.1 | 2.4 | 2.3 | 2.2 | 2.3 | 2.5 | 2.4 | 2.2 | 2.4 | 3.3 | 3.0 | 3.3 | 3.2 |
| DSCs (not related to utilities) | 2.7 | 2.9 | 2.1 | 2.6 | 2.7 | 3.1 | 2.4 | 2.7 | 3.4 | 3.5 | 3.1 | 3.3 | 2.5 | 3.0 | 2.3 | 2.6 |
| DSCs (new utility conflicts or utility conflicts that were not resolved properly during design) | 3.5 | 3.3 | 3.5 | 3.4 | 3.8 | 3.6 | 3.3 | 3.5 | 4.4 | 4.4 | 4.7 | 4.5 | 3.0 | 3.0 | 3.3 | 3.1 |
| Changes initiated by project owner during construction | 2.5 | 2.7 | 2.7 | 2.6 | 3.6 | 3.4 | 2.9 | 3.3 | 3.5 | 3.5 | 3.7 | 3.6 | 2.3 | 2.7 | 2.8 | 2.6 |
| Labor shortages during construction | 2.3 | 1.8 | 2.0 | 2.0 | 2.4 | 1.9 | 2.4 | 2.2 | 2.7 | 2.5 | 2.2 | 2.5 | 2.0 | 2.0 | 2.0 | 2.0 |
| Equipment shortages during construction | 1.7 | 1.5 | 1.7 | 1.6 | 2.4 | 2.1 | 2.1 | 2.2 | 1.8 | 2.1 | 1.8 | 1.9 | 1.0 | 1.0 | 1.5 | 1.2 |
| Inadequate work effort by highway contractor | 2.3 | 1.7 | 1.9 | 2.0 | 2.9 | 2.1 | 2.0 | 2.3 | 1.8 | 1.9 | 1.7 | 1.8 | 1.5 | 1.0 | 1.7 | 1.4 |
| Lack of compliance with industry standards or technical specifications during highway construction | 1.9 | 1.6 | 1.7 | 1.7 | 2.9 | 2.1 | 2.3 | 2.5 | 2.0 | 2.0 | 2.1 | 2.0 | 2.0 | 2.0 | 2.3 | 2.1 |
| Ineffective (late or inadequate) highway construction inspection | 1.8 | 1.6 | 1.6 | 1.7 | 2.5 | 2.0 | 1.8 | 2.1 | 2.0 | 2.1 | 1.7 | 1.9 | 1.5 | 1.5 | 1.5 | 1.5 |
| Weather | 2.8 | 2.4 | 2.3 | 2.5 | 2.9 | 2.6 | 2.8 | 2.8 | 2.9 | 2.9 | 2.4 | 2.7 | 3.7 | 2.7 | 2.8 | 3.0 |
The survey instrument enabled respondents to type in additional risk factors. Additional risk factors that respondents provided include the following:
- Acquisition of easements.
- Insufficient time to complete utility relocations prior to construction.
- Utility conflicts that linger into construction.
- Utility facilities not relocated prior to construction.
- Lack of understanding about commissioning schedules for utility facilities, such as splicing or cable routing for fiber optic cables, cutover notices for water, and seasonal schedules for electric and gas installations.
Environmental Process
Table 30 shows averages for environmental process risk factors. Delays obtaining permits (e.g., U.S. Fish and Wildlife, U.S. Army Corps of Engineers, and so on) was the highest rated risk factor. Respondents also indicated that environmental process risk factors contributed more to project delivery delays than to project cost increases and utility relocation delays. As Table 31
shows, contractors rated all four environmental factors higher than other stakeholder groups. The highest ratings for contractors were delays obtaining permits and delays starting the environmental review.
Table 30. Risk Factors – Environmental Process (Aggregated Average).
| Environmental Process Risk Factor | Aggregated | |||
|---|---|---|---|---|
| PD | PC | UD | All | |
| Delays starting environmental review | 3.0 | 2.5 | 2.6 | 2.7 |
| Delays during environmental review | 3.2 | 2.8 | 2.7 | 2.9 |
| Delays complying with environmental commitments after environmental clearance | 2.7 | 2.7 | 2.6 | 2.7 |
| Delays obtaining permits (e.g., U.S. Fish and Wildlife, U.S. Army Corps of Engineers, and so on) | 3.5 | 3.1 | 3.0 | 3.2 |
Table 31. Risk Factors – Environmental Process (Disaggregated Average).
| Environmental Process Risk Factor | Project Owner | Consultant | Contractor | Utility Owner | ||||||||||||
|---|---|---|---|---|---|---|---|---|---|---|---|---|---|---|---|---|
| PD | PC | UD | All | PD | PC | UD | All | PD | PC | UD | All | PD | PC | UD | All | |
| Delays starting environmental review | 2.7 | 2.3 | 2.4 | 2.4 | 3.4 | 2.9 | 3.0 | 3.1 | 4.0 | 3.7 | 3.5 | 3.7 | 2.5 | 1.5 | 2.5 | 2.2 |
| Delays during environmental review | 3.0 | 2.8 | 2.6 | 2.8 | 3.7 | 3.0 | 2.9 | 3.2 | 3.3 | 2.8 | 3.0 | 3.0 | 3.0 | 2.0 | 2.5 | 2.5 |
| Delays complying with environmental commitments after environmental clearance | 2.8 | 2.8 | 2.5 | 2.7 | 2.8 | 2.5 | 2.5 | 2.6 | 3.0 | 2.8 | 3.5 | 3.1 | 2.0 | 2.5 | 2.5 | 2.3 |
| Delays obtaining permits (e.g., U.S. Fish and Wildlife, U.S. Army Corps of Engineers, and so on) | 3.3 | 3.0 | 2.8 | 3.0 | 3.9 | 3.3 | 3.0 | 3.4 | 4.0 | 4.3 | 4.3 | 4.2 | 4.0 | 2.5 | 4.0 | 3.5 |
The survey instrument enabled respondents to type in additional risk factors. Additional risk factors that respondents provided include the following:
- Time-of-year restrictions that conflict with the project schedule.
- Meeting internal compliance requirements.
- Time-of-year restrictions and missing milestone dates.
- Changes in project letting schedules.
Right-of-way Acquisition
Table 32 shows averages for right-of-way acquisition risk factors. Delays acquiring critical parcels (e.g., parcels on eminent domain or parcels needed for utility relocations) was the highest rated risk factor in the right-of-way acquisition process, followed by delays acquiring all parcels. Delays completing right-of-way map was the lowest rated risk factor.
As Table 33 shows, delays acquiring critical parcels had the highest rating for contractors compared to other stakeholders. This was case whether it was acquisition of all parcels or critical parcels, although in this case, contractors rated the acquisition of critical parcels slightly higher
than the acquisition of all parcels. (e.g., parcels on eminent domain or parcels needed for utility relocations) than all other risk factors in the right-of-way acquisition process.
Table 32. Risk Factors – Right-of-Way Acquisition (Aggregated Average).
| Right-of-way Acquisition Risk Factor | Aggregated | |||
|---|---|---|---|---|
| PD | PC | UD | All | |
| Delays starting the right-of-way process | 3.2 | 2.8 | 3.1 | 3.1 |
| Delays completing right-of-way map | 3.2 | 2.6 | 3.0 | 2.9 |
| Delays getting authorization to acquire right-of-way | 3.2 | 2.7 | 3.1 | 3.0 |
| Delays acquiring all parcels | 3.6 | 3.3 | 3.6 | 3.5 |
| Delays acquiring critical parcels (e.g., parcels on eminent domain or parcels needed for utility relocations) | 3.7 | 3.5 | 3.8 | 3.7 |
| Delays acquiring replacement easements for utility relocations | 3.4 | 3.1 | 3.5 | 3.3 |
| Inadequate funding or delays clearing right-of-way for utility relocations | 2.9 | 2.8 | 3.1 | 3.0 |
| Right-of-way encroachments or features impeding utility relocations | 3.0 | 3.1 | 3.2 | 3.1 |
Table 33. Risk Factors – Right-of-Way Acquisition (Disaggregated Average).
| Right-of-way Acquisition Risk Factor | Project Owner | Consultant | Contractor | Utility Owner | ||||||||||||
|---|---|---|---|---|---|---|---|---|---|---|---|---|---|---|---|---|
| PD | PC | UD | All | PD | PC | UD | All | PD | PC | UD | All | PD | PC | UD | All | |
| Delays starting the Right-of-way process | 3.1 | 2.5 | 2.9 | 2.9 | 3.3 | 2.9 | 3.5 | 3.3 | 3.3 | 3.4 | 3.8 | 3.5 | 3.2 | 3.0 | 2.0 | 2.7 |
| Delays completing Right-of-way map | 3.0 | 2.2 | 2.6 | 2.6 | 3.5 | 2.9 | 3.3 | 3.3 | 3.5 | 3.3 | 3.8 | 3.5 | 2.2 | 2.5 | 2.2 | 2.3 |
| Delays getting authorization to acquire Right-of-way | 2.8 | 2.3 | 2.6 | 2.6 | 3.6 | 3.0 | 3.6 | 3.4 | 4.0 | 3.9 | 4.3 | 4.0 | 2.3 | 2.3 | 2.0 | 2.2 |
| Delays acquiring all parcels | 3.3 | 2.8 | 3.3 | 3.2 | 4.0 | 3.8 | 4.0 | 3.9 | 4.1 | 4.0 | 4.4 | 4.2 | 3.4 | 3.2 | 2.4 | 3.0 |
| Delays acquiring critical parcels (e.g., parcels on eminent domain or parcels needed for utility relocations) | 3.5 | 3.2 | 3.5 | 3.4 | 4.0 | 3.7 | 4.2 | 4.0 | 4.3 | 4.4 | 4.6 | 4.4 | 3.6 | 3.6 | 3.0 | 3.4 |
| Delays acquiring replacement easements for utility relocations | 3.0 | 2.8 | 3.2 | 3.0 | 3.8 | 3.4 | 3.9 | 3.7 | 3.8 | 3.9 | 4.4 | 4.0 | 3.4 | 3.0 | 3.0 | 3.1 |
| Inadequate funding or delays clearing Right-of-way for utility relocations | 2.7 | 2.4 | 2.8 | 2.7 | 3.4 | 3.3 | 3.4 | 3.4 | 2.8 | 3.4 | 3.8 | 3.3 | 3.3 | 2.8 | 3.2 | 3.1 |
| Right-of-way encroachments or features impeding utility relocations | 2.7 | 2.7 | 2.7 | 2.7 | 3.5 | 3.6 | 3.7 | 3.6 | 3.1 | 4.0 | 3.8 | 3.6 | 3.0 | 2.8 | 3.3 | 3.0 |
The survey instrument enabled respondents to type in additional risk factors. Additional risk factors that respondents provided include the following:
- Utility easement feasibility routing.
- Inadequate time allocated to the right-of-way process.
- Utility owner’s non-compliance with permit regulations and proceeding with relocations concurrent with construction.
- Utility owner’s priorities.
Utility Process
Table 34 shows utility process risk factors and the aggregated average of ratings provided by all respondents. The risk factors of the utility process are divided into four sections: utility coordination and utility investigations, utility conflict analysis and utility design, utility relocations, and post utility relocations. Delays getting utility owner for utility coordination and utility relocation was the highest rated risk factor in the utility process by all respondents, followed by inaccurate or incomplete utility facility data during design and delays getting utility owners to schedule utility relocations in the field. Lack of compliance with industry standards or technical specifications during utility relocations was the lowest rated risk factor in the utility process by all respondents.
With some exceptions, respondents indicated higher ratings for risk factors associated with prerelocation activities, highlighting the importance of addressing utility issues before utility owners begin relocating their facilities. Respondents also highlighted nuances in the utility process regarding the level of impact. For example, delays conducting utility investigations was rated higher than delays notifying utility owners that the project could affect them. Likewise, delays identifying and resolving utility conflicts was rated higher than delays reviewing and executing utility agreements. Furthermore, respondents rated Buy America-related risk factors low across all three categories.
In general, as Table 35 shows, contractors gave higher ratings to all the utility process risk factors than project owners, consultants, and utility owners. Inaccurate or incomplete utility facility data during design was rated the highest risk factor by contractors, followed by delays getting utility owners to respond and begin coordination and delays getting utility owners to schedule utility relocations in the field.
In general, consultants rated utility process risk factors higher than project owners and utility owners. Utility owners rated utility process risk factors lower than project owners. However, utility owners rated unrealistic timeframe by project owner for utility coordination and utility relocations higher than project owners and consultants.
Table 34. Risk Factors – Utility Process (Aggregated Average).
| Utility Process Risk Factor | Aggregated | |||
|---|---|---|---|---|
| PD | PC | UD | All | |
| Utility Coordination and Utility Investigations | ||||
| Delays notifying utility owners that project could affect them | 2.5 | 2.2 | 2.6 | 2.5 |
| Delays getting as-built records from utility owners | 3.3 | 2.8 | 2.9 | 3.0 |
| Delays conducting utility investigations (QLB and/or QLA) | 3.2 | 2.9 | 3.0 | 3.1 |
| Inaccurate or incomplete utility facility data during design | 3.8 | 3.6 | 3.5 | 3.6 |
| Unrealistic timeframe by project owner for utility coordination and utility relocations | 3.5 | 3.3 | 3.3 | 3.4 |
| Delays getting utility owners to respond and begin coordination | 3.9 | 3.4 | 3.6 | 3.7 |
| Utility Conflict Analysis and Utility Design | ||||
| Utility owners holding off on relocation design until Right-of-way has been acquired | 3.4 | 3.2 | 3.2 | 3.3 |
| Utility owners holding off on relocation design until project plans are at least 60% or 90% complete | 3.4 | 3.1 | 3.2 | 3.3 |
| Utility Process Risk Factor | Aggregated | |||
|---|---|---|---|---|
| PD | PC | UD | All | |
| Delays identifying and resolving utility conflicts | 3.4 | 3.3 | 3.3 | 3.3 |
| Delays reviewing and executing utility agreements | 3.1 | 2.8 | 2.8 | 2.9 |
| Inadequate utility relocation plans | 3.2 | 3.2 | 3.1 | 3.2 |
| Inadequate utility relocation cost estimate | 2.8 | 2.7 | 2.6 | 2.7 |
| Inadequate utility relocation schedule | 3.5 | 3.3 | 3.2 | 3.3 |
| Utility Relocations | ||||
| Delays acquiring Buy America items | 2.6 | 2.4 | 2.3 | 2.5 |
| Inadequate notification to perform inspections or approvals for Buy America items | 2.1 | 2.0 | 2.0 | 2.1 |
| Inaccurate and/or incomplete locating and marking existing utility facilities prior to excavation | 3.0 | 3.0 | 3.1 | 3.1 |
| Survey control non-existent or far away from utility relocation | 2.4 | 2.4 | 2.3 | 2.4 |
| Utility owner’s funding or capacity constraints | 3.1 | 2.8 | 2.9 | 3.0 |
| Unrealistic timeframe by utility owner for completing utility relocation work in the field | 3.3 | 3.2 | 3.3 | 3.3 |
| Delays getting utility owners to schedule utility relocations in the field | 3.7 | 3.5 | 3.6 | 3.6 |
| Inadequate coordination or sequencing among utility owners using common poles or duct banks | 3.2 | 3.1 | 3.2 | 3.2 |
| Difficult or inadequate constructability of utility relocation | 2.7 | 2.9 | 2.8 | 2.8 |
| Lack of compliance with industry standards or technical specifications during utility relocations | 2.0 | 2.0 | 2.0 | 2.0 |
| Delays getting responses from utility owner when there are highway construction changes that necessitate coordination | 3.3 | 3.1 | 3.1 | 3.2 |
| Labor, equipment, and/or material shortages for utility contractors | 2.6 | 2.6 | 2.6 | 2.6 |
| Ineffective (late or inadequate) utility construction inspection | 2.3 | 2.4 | 2.2 | 2.3 |
| Ineffective working relationship between project owner (including contractors and consultants) and utility owner (including contractors and consultants) | 2.9 | 3.0 | 2.9 | 2.9 |
| Post Utility Relocations | ||||
| Horizontal and/or vertical location of relocated utility facilities not conforming to approved plans | 2.9 | 3.0 | 2.8 | 2.9 |
| Inaccurate or incomplete utility as-builts after relocation | 3.2 | 2.9 | 2.7 | 3.0 |
| Delays in providing utility as-builts after relocation to highway contractor | 3.1 | 2.9 | 2.6 | 2.9 |
Table 35. Risk Factors – Utility Process (Disaggregated Average).
| Utility Process Risk Factor | Project Owner | Consultant | Contractor | Utility Owner | ||||||||||||
|---|---|---|---|---|---|---|---|---|---|---|---|---|---|---|---|---|
| PD | PC | UD | All | PD | PC | UD | All | PD | PC | UD | All | PD | PC | UD | All | |
| Utility Coordination and Utility Investigations | ||||||||||||||||
| Delays notifying utility owners that project could affect them | 2.1 | 1.8 | 2.4 | 2.1 | 2.7 | 2.4 | 2.7 | 2.6 | 3.2 | 2.8 | 3.3 | 3.1 | 2.9 | 2.8 | 2.4 | 2.7 |
| Delays getting as-built records from utility owners | 3.2 | 2.5 | 2.7 | 2.8 | 3.4 | 3.1 | 2.9 | 3.2 | 3.6 | 3.2 | 3.5 | 3.5 | 2.5 | 2.0 | 2.4 | 2.3 |
| Delays conducting utility investigations (QLB and/or QLA) | 2.8 | 2.4 | 2.7 | 2.7 | 3.4 | 3.4 | 3.3 | 3.4 | 3.7 | 3.8 | 3.8 | 3.8 | 3.2 | 2.0 | 2.5 | 2.6 |
| Utility Process Risk Factor | Project Owner | Consultant | Contractor | Utility Owner | ||||||||||||
|---|---|---|---|---|---|---|---|---|---|---|---|---|---|---|---|---|
| PD | PC | UD | All | PD | PC | UD | All | PD | PC | UD | All | PD | PC | UD | All | |
| Inaccurate or incomplete utility facility data during design | 3.6 | 3.4 | 3.2 | 3.4 | 3.8 | 3.8 | 3.6 | 3.7 | 4.4 | 4.2 | 4.3 | 4.3 | 2.9 | 2.9 | 3.0 | 2.9 |
| Unrealistic timeframe by project owner for utility coordination and utility relocations | 3.2 | 3.0 | 3.1 | 3.1 | 3.7 | 3.5 | 3.4 | 3.5 | 3.9 | 3.9 | 3.6 | 3.8 | 4.0 | 3.4 | 3.3 | 3.6 |
| Delays getting utility owners to respond and begin coordination | 3.8 | 3.2 | 3.5 | 3.5 | 3.9 | 3.4 | 3.6 | 3.6 | 4.3 | 4.2 | 4.1 | 4.2 | 3.3 | 3.0 | 3.1 | 3.1 |
| Utility Conflict Analysis and Utility Design | ||||||||||||||||
| Utility owners holding off on relocation design until Right-of-way has been acquired | 3.2 | 2.9 | 3.0 | 3.1 | 3.5 | 3.2 | 3.4 | 3.3 | 3.8 | 3.8 | 4.0 | 3.8 | 3.8 | 3.2 | 2.6 | 3.2 |
| Utility owners holding off on relocation design until project plans are at least 60% or 90% complete | 3.3 | 2.8 | 3.2 | 3.1 | 3.4 | 3.1 | 2.9 | 3.2 | 3.9 | 3.8 | 4.0 | 3.9 | 3.7 | 3.0 | 3.3 | 3.3 |
| Delays identifying and resolving utility conflicts | 3.2 | 3.0 | 3.1 | 3.1 | 3.3 | 3.4 | 3.3 | 3.3 | 4.3 | 4.1 | 4.0 | 4.1 | 2.9 | 3.1 | 2.7 | 2.9 |
| Delays reviewing and executing utility agreements | 2.8 | 2.5 | 2.6 | 2.6 | 3.2 | 3.0 | 3.0 | 3.1 | 4.2 | 3.7 | 3.6 | 3.9 | 2.3 | 2.1 | 2.0 | 2.1 |
| Inadequate utility relocation plans | 3.1 | 2.9 | 2.8 | 3.0 | 3.0 | 3.1 | 3.0 | 3.0 | 4.2 | 4.1 | 4.1 | 4.1 | 2.4 | 2.6 | 2.3 | 2.4 |
| Inadequate utility relocation cost estimate | 2.6 | 2.4 | 2.3 | 2.4 | 2.9 | 2.9 | 2.5 | 2.8 | 3.5 | 3.5 | 3.7 | 3.6 | 2.4 | 2.4 | 2.3 | 2.4 |
| Inadequate utility relocation schedule | 3.4 | 3.1 | 3.0 | 3.2 | 3.4 | 3.3 | 3.3 | 3.3 | 4.1 | 4.0 | 4.0 | 4.0 | 2.4 | 2.6 | 2.4 | 2.5 |
| Utility Relocations | ||||||||||||||||
| Delays acquiring Buy America items | 2.2 | 2.2 | 2.2 | 2.2 | 3.0 | 2.6 | 2.6 | 2.7 | 3.0 | 2.7 | 2.6 | 2.8 | 2.0 | 2.2 | 2.0 | 2.1 |
| Inadequate notification to perform inspections or approvals for Buy America items | 1.7 | 1.7 | 1.8 | 1.7 | 2.6 | 2.3 | 2.2 | 2.4 | 2.6 | 2.4 | 2.5 | 2.5 | 2.0 | 2.2 | 1.8 | 2.0 |
| Inaccurate and/or incomplete locating and marking existing utility facilities prior to excavation | 2.7 | 2.6 | 2.7 | 2.7 | 3.2 | 3.3 | 3.3 | 3.3 | 4.0 | 4.0 | 3.7 | 3.9 | 2.3 | 2.0 | 2.3 | 2.2 |
| Survey control non-existent or far away from utility relocation | 2.2 | 2.1 | 2.1 | 2.1 | 2.5 | 2.8 | 2.7 | 2.6 | 2.9 | 2.8 | 2.4 | 2.7 | 1.8 | 1.6 | 1.6 | 1.7 |
| Utility owner’s funding or capacity constraints | 3.0 | 2.6 | 2.6 | 2.7 | 3.3 | 3.1 | 3.2 | 3.2 | 3.4 | 3.2 | 3.5 | 3.3 | 2.2 | 2.4 | 2.8 | 2.5 |
| Unrealistic timeframe by utility owner for completing utility relocation work in the field | 3.2 | 3.0 | 3.1 | 3.1 | 3.4 | 3.4 | 3.3 | 3.4 | 3.6 | 3.6 | 3.7 | 3.6 | 2.7 | 2.6 | 2.6 | 2.6 |
| Delays getting utility owners to schedule utility relocations in the field | 3.6 | 3.4 | 3.4 | 3.4 | 3.7 | 3.5 | 3.7 | 3.7 | 4.3 | 4.1 | 4.3 | 4.2 | 2.8 | 2.9 | 2.7 | 2.8 |
| Inadequate coordination or sequencing among utility owners using common poles or duct banks | 3.0 | 2.9 | 3.0 | 3.0 | 3.4 | 3.2 | 3.4 | 3.3 | 3.8 | 3.8 | 3.7 | 3.8 | 2.9 | 2.7 | 2.4 | 2.7 |
| Difficult or inadequate constructability of utility relocation | 2.4 | 2.6 | 2.5 | 2.5 | 2.8 | 3.1 | 3.0 | 3.0 | 3.4 | 3.6 | 3.4 | 3.5 | 2.1 | 2.3 | 2.1 | 2.2 |
| Lack of compliance with industry standards or technical specifications during utility relocations | 1.7 | 1.8 | 1.7 | 1.7 | 2.2 | 2.2 | 2.1 | 2.2 | 2.5 | 2.6 | 2.6 | 2.6 | 1.6 | 1.6 | 1.7 | 1.6 |
| Utility Process Risk Factor | Project Owner | Consultant | Contractor | Utility Owner | ||||||||||||
|---|---|---|---|---|---|---|---|---|---|---|---|---|---|---|---|---|
| PD | PC | UD | All | PD | PC | UD | All | PD | PC | UD | All | PD | PC | UD | All | |
| Delays getting responses from utility owner when there are highway construction changes that necessitate coordination | 3.0 | 2.8 | 2.9 | 2.9 | 3.6 | 3.2 | 3.1 | 3.3 | 4.0 | 3.8 | 3.9 | 3.9 | 2.2 | 2.6 | 2.3 | 2.3 |
| Labor, equipment, and/or material shortages for utility contractors | 2.5 | 2.3 | 2.4 | 2.4 | 2.9 | 3.1 | 3.0 | 3.0 | 2.7 | 2.6 | 2.8 | 2.7 | 2.7 | 2.7 | 2.6 | 2.7 |
| Ineffective (late or inadequate) utility construction inspection | 2.2 | 2.2 | 2.0 | 2.1 | 2.5 | 2.7 | 2.5 | 2.6 | 2.3 | 2.5 | 2.2 | 2.3 | 2.0 | 2.0 | 1.9 | 2.0 |
| Ineffective working relationship between project owner (including contractors and consultants) and utility owner (including contractors and consultants) | 2.6 | 2.8 | 2.7 | 2.7 | 3.1 | 3.1 | 2.9 | 3.1 | 3.4 | 3.7 | 3.5 | 3.5 | 2.4 | 2.7 | 2.6 | 2.6 |
| Post Utility Relocations | ||||||||||||||||
| Horizontal and/or vertical location of relocated utility facilities not conforming to approved plans | 2.6 | 2.6 | 2.4 | 2.5 | 3.1 | 3.5 | 3.0 | 3.2 | 3.5 | 3.7 | 3.5 | 3.6 | 2.7 | 2.5 | 2.5 | 2.6 |
| Inaccurate or incomplete utility as-builts after relocation | 2.8 | 2.6 | 2.3 | 2.6 | 3.7 | 3.3 | 2.9 | 3.3 | 3.6 | 3.5 | 3.5 | 3.6 | 2.0 | 2.5 | 2.5 | 2.3 |
| Delays in providing utility as-builts after relocation to highway contractor | 2.8 | 2.5 | 2.2 | 2.5 | 3.3 | 3.4 | 2.8 | 3.2 | 3.6 | 3.3 | 3.2 | 3.4 | 2.0 | 2.4 | 1.8 | 2.1 |
The survey instrument enabled respondents to type in additional risk factors. Additional risk factors that respondents provided include the following:
- Risk factors involving project owner:
- Late plan development.
- Late plan changes.
- Continued changes during the design phase.
- Design team’s lack of utility facility knowledge.
- Designers not using utility facility information to design around utility facilities.
- Lack of motivation or incentive to design highway to avoid utility facilities.
- Lack of integrated or detailed schedule including design, highway construction, right-of-way, and utility facilities.
- Not providing adequate right-of-way for utility facility relocation.
- Lack of consideration for utility outage requirements or schedules.
- DOT accommodation policies lacking flexibility, such as not allowing utility facilities under the pavement structure, creating unnecessary relocations.
- County or city utility coordination and project schedule too aggressive.
- County or city right-of-way acquisition not taking into consideration utility relocations.
- Traffic control plans.
- Lack of utility facility mapping updates via the DOT plan set after letting.
- Risk factors involving contractors:
- Incompatible scopes.
-
- Contractor not prepared.
- Lack of control over utility facility relocations between letting and the notice to proceed to construction.
- Lack of creativity or motivation to provide workarounds for known long-duration relocations.
- Risk factors involving utility owners:
- Utility ownership changes.
- Utility personnel changes or reassignments.
- Utility owners not knowing where their facilities are located.
- Utility owner representatives not having adequate knowledge or documentation about their networks and unwillingness to provide consultant support for utility investigations during design.
- Relocation not being a priority for the utility owner.
- Utility owners not having a contractual obligation to perform relocations.
- Disputes over cost share responsibility between project owner and utility owner.
- Lack of project owner and utility owner’s pre-project discussion or utility facility needs.
- Differing priorities between project owner and utility owner about the need or justification of low-cost utility relocations.
- Utility facility locations not installed or relocated to the required depth.
- Obtaining approval for utility owner contractors to work overtime, nights, or weekends to match or exceed the highway contractor work schedule.
- Inaccurate as-builts from utility owners.
- No consequences for delays attributed to utility owners.
- Privately owned vs. publicly owned utility facilities according to jurisdiction.
- Inadequate explanation of project design plans to utility owners, who may not have highway design engineering expertise.
- Risk factors involving utility investigations and UCM:
- Multiple ongoing projects requiring utility coordination.
- Delay in engaging utility coordination.
- Ineffective UCM during design to avoid unnecessary relocations.
- Difficult conditions to conduct utility investigations in the field.
- Need to conduct utility investigation during construction to generate as-built file that was not generated during design.
- Delay in approval for QLA test holes to assess or confirm utility conflicts.
- Using QLD when QLB and/or QLA should have been used.
- Treating utility coordination as a silo outside of the rest of project delivery.
- Project owner’s reluctance to use the SUE process.
- Undocumented utility facilities.
- Lack of clarity about utility facility clearances.
- Inadequate One-Call responses.
- Locator equipment’s failure to properly locate utility facilities.
- Inaccurate utility as-builts after relocation.
- Difficulty accessing utility facility property interests for use when estimating relocation costs (including relocation compensability).
- Confusing or lack of utility facility symbology.
-
Other risk factors:
- Historical issues.
- Regional storms.
- Delays due to wildfire.
- Time-of-year restrictions.
- Federal Communications Commission’s Keep Americans Connected Pledge in response to the COVID-19 epidemic.
Impact of Type of Utility Relocation
Respondents were asked to rate how frequently different types of utility relocations cause project delivery delays. Table 36 shows average ratings by all respondents and by type of respondent (i.e., project owner, consultant, contractor, or utility owner). In general, respondents indicated that utility relocations included in the highway contractor were less likely to cause project delivery delays than when utility owners handle the relocation. Non-reimbursable relocations handled by utility owner was the highest rated type of utility relocation. Non-reimbursable utility relocations handled by highway contractor was the lowest-rated type of utility relocation.
Table 36. Impact of Type of Utility Relocation on Project Delivery Delays (Average).
| Type of Utility Relocation | Aggregated | Project Owner | Consultant | Contractor | Utility Owner |
|---|---|---|---|---|---|
| Non-reimbursable utility relocations handled by highway contractor | 2.4 | 2.1 | 2.4 | 3.2 | 2.3 |
| Reimbursable utility relocations handled by highway contractor | 2.0 | 1.8 | 1.9 | 2.6 | 2.3 |
| Non-reimbursable relocations handled by utility owner | 3.6 | 3.7 | 3.3 | 4.2 | 2.4 |
| Reimbursable relocations handled by utility owner | 3.0 | 3.1 | 2.6 | 3.2 | 2.0 |
Unknown Costs to Contractors
Respondents were asked to rate risk factors on a scale from 1 (least frequent) to 5 (most frequent) in terms of how frequently the risk factors contribute to unknown costs to contractors. Table 37 shows average ratings by all respondents and by type of respondent (i.e., project owner, consultant, contractor, or utility owner). In general, the responses were similar, although respondents indicated that risk factors that result in immediate impacts during construction (e.g., lower production rates and stoppages) are more likely to cause unknown costs to contractors. Contractors rated all five risk factors much higher than other stakeholder groups, and their ratings were less scattered that those of other respondents. Contractors gave the highest ratings to lower production rates and stoppages in response to utility conflicts that were discovered during construction.
Table 37. Risk Factors Causing Unknown Costs to Contractors (Average).
| Risk Factor | Aggregated | Project Owner | Consultant | Contractor | Utility Owner |
|---|---|---|---|---|---|
| Lower production rates than anticipated for installation of underground highway features that are in direct conflict with or adjacent to utility facilities | 3.4 | 3.2 | 3.1 | 4.4 | 2.2 |
| Crew delays or stoppages waiting for decisions regarding unknown utilities or utility conflicts that were discovered during construction | 3.6 | 3.2 | 3.6 | 4.5 | 3.3 |
| Lower production rates due to working around utilities that have not been relocated or working out of phase (i.e., jumping around to different areas of the project) in response to utility conflicts that were discovered during construction | 3.6 | 3.3 | 3.4 | 4.5 | 3.2 |
| Having to schedule highway work in late fall or winter (or the next construction season) because of UR delays | 3.1 | 2.8 | 3.1 | 4.0 | 2.2 |
| Lack of clarity or incomplete information in plans and special provisions about existing utility facilities and utility relocation plans | 3.2 | 2.8 | 3.3 | 4.2 | 2.3 |
The survey instrument enabled respondents to type in additional risk factors. Additional risk factors that respondents provided include the following:
- Abandoned, deenergized, or decommissioned utility facilities.
- Inactivity by utility owners relocating their facilities.
- Poor design and utility conflicts.
- Utility owners wanting to schedule their relocations at the same time as the highway construction, while at same time not submitting utility relocation documentation to the DOT.
UTILITY-RELATED TIME EXTENSIONS, CHANGE ORDERS, AND CLAIMS
Tools Project Owners Use to Address Utility-Related Delays and Costs
Respondents who were project owners were asked what tools their agencies allowed highway contractors to use for addressing UR delays and additional costs. This question was multiple choice. As Figure 14 shows, the most common tool was change orders (78), followed by claims (63) and no-cost extensions.
The survey instrument enabled respondents to type in additional tools that highway contractors are allowed to use. Additional tools that respondents provided include the following:
- Recover losses from utility owners due to delays caused by the utility owner
- Escalation and mediation process
- Preconstruction utility meetings

Contractor Strategies to Address Utility Issues During Construction
Respondents were asked to rate how frequently highway contractors adopt specific strategies to address utility issues found during construction. Table 38 shows average ratings by all respondents and by type of respondent (i.e., project owner, consultant, contractor, or utility owner). On the aggregate, respondents indicated that the most frequent strategies that contractors use were change orders, claims, and the RFI process. However, these figures mask strong differences among stakeholder groups. In addition to these strategies, contractors frequently modify their work schedules in response to utility issues found during construction. Other stakeholder groups thought that contractors used this type of strategy less frequently.
Across stakeholder groups, the least frequent strategies were having dedicated staff or subcontractors or increasing unit costs for UR items.
| Contractor Strategy | Aggregated | Project Owner | Consultant | Contractor | Utility Owner |
|---|---|---|---|---|---|
| Contractor has dedicated staff or subcontractor to anticipate utility issues and coordinate with utility owners and their contractors | 2.3 | 2.1 | 2.7 | 2.2 | 2.7 |
| Contractor increases unit costs for UR items when first bidding for the highway construction job | 2.9 | 2.8 | 3.2 | 3.1 | 2.7 |
| Contractor uses RFI process to seek answers from project owner when utility issues appear | 3.4 | 3.1 | 3.6 | 3.8 | 4.0 |
| Contractor initiates project sequencing modifications to manage problems caused by utility issues found during construction | 3.3 | 3.1 | 3.0 | 3.9 | 3.3 |
| Contractor modifies project sequencing at the request of project owner to manage problems caused by utility issues found during construction | 3.1 | 2.9 | 2.9 | 3.9 | 2.8 |
| Contractor submits change orders for reasons attributed to utility issues found during construction | 3.7 | 3.5 | 3.6 | 4.5 | 3.8 |
| Contractor submits claims for reasons attributed to utility issues found during construction | 3.6 | 3.5 | 3.4 | 4.3 | 3.5 |
The survey instrument enabled respondents to type in additional strategies that contractors use. Additional strategies that respondents provided include the following:
- Request contract time extensions.
- Conduct weekly project meetings or utility workshops.
- Submit claims for hand-digging to locate utility facilities.
- Use SUE during construction.
- Maintain in-house SUE map and update it daily as underground lines are installed or removed and as utility facilities are discovered during construction.
- Internal dig permit program to update and communicate utility maps to crews working on site.
Access to Change Order and Claim Databases
Respondents were asked whether their agency could provide a copy of change order and claim databases to the research team. Chapter 5 describes the process to request the data and the results of the analyses the research team completed with the various datasets received.
POTENTIAL CASE STUDIES
Respondents were asked to suggest 1–3 projects with utility relocations or adjustments as potential case studies for lessons learned and/or the application of innovative practices
addressing utility issues during construction. A total of 31 respondents suggested 58 potential projects. From the list of projects, the research team selected three case studies, which Chapter 4 describes in more detail.
ADDITIONAL COMMENTS BY RESPONDENTS
Respondents were invited to provide additional comments about utility conflict impacts. Additional comments made by respondents include the following:
- Early and often utility facility discussions with utility owners are important for successful relocations. Relocations should occur before a construction contract is awarded to avoid delays to the contractor and extra costs by the project owner.
- Resolve utility conflicts during design as opposed to construction.
- Utility owners do not verify that relocated utility facilities are actually installed below the highway grade. It is common for contractors to hit lines that are in the pavement grade, and then utility owners try to charge the contractors for lowering the lines.
- The state legislature sets funding and timing for project delivery phases. Having utility funding authorizations after project design and right-of-way funding authorizations causes unnecessary project delays.
- Most utility conflicts are due to poor DOT management decisions during development, such as timely or inadequate utility investigations, lack of effort to avoid unnecessary relocations, lack of awareness in utility accommodation such as unwillingness to allow exceptions such as a utility facility that has a 75-year life span and could be left in place, and lack of utility awareness. Many claims and delays attributed to utilities are simply poor practices in coordinating the utility with the project.
- Design teams do not explain the civil engineering aspects of a project in sufficient detail to utility owners. Most utility owners do not have civil engineers on staff.
- Projects can be casualties of the sunk cost fallacy. There is a point when designers have invested so much time and budget that they become reluctant to consider radical design changes.
- Keys to success in the utility process include the following:
- Proper experienced staffing for all aspects of design and construction.
- Integrated project schedule with all aspects needed for project delivery, including accurate durations and accurate logic.
- Use of tracking tools to gauge progress against milestones for preconstruction activities to ensure those efforts are on track.
- Perform and maintain an accurate map of utility facilities during the project’s life, and make sure that designers and builders have easy access to this information.
- Be aware that the level of detail needed to plan and schedule the work properly and develop an accurate cost estimate is usually far greater than initially thought.
- Select qualified contractors with adequate resources and a solid execution plan before beginning the work.
STANDARD DEVIATIONS
The research team calculated standard deviations of the responses associated with each risk factor and corresponding rating, first separately for project delivery delays, project cost
increases, and utility relocation delays, and then by combining the ratings for these three categories assuming an equal weight for each category. The research team also prepared color-coded tables for standard deviations, with values ranging from 0 to 2. However, these tables were not effective for visualization purposes. A scatterplot of average ratings versus standard deviations, as shown in Figure 15, was more effective. The figure includes a trendline using a 2nd degree polynomial.

In the context of the ratings provided by respondents, standard deviations provide a measure of relative agreement among respondents with respect to the average ratings. As Figure 15 shows, standard deviations were lower for either low or high average ratings than for mid-range average ratings, indicating more agreement among respondents with respect to factors that were either low risk or high risk. Agreement among respondents was particularly strong for high-risk factors.
Standard deviations varied depending on the risk factor category, as follows:
- Project planning and design risk factors. Changes in highway design prior to letting was the risk factor with the lowest standard deviation in all three categories (i.e., project delivery delays, project cost increases, and utility relocation delays), followed by delays in highway design and insufficient timeframe for detailed design. Insufficient or untimely funding for design was the risk factor with the highest standard deviation. For most risk factors, standard deviations among project owners were considerably lower than those for other stakeholder groups.
- Highway construction risk factors. Insufficient or untimely funding for construction, insufficient timeframe for highway construction, higher unit costs for UR work items, and changes initiated by project owner during construction were the risk factors with the highest standard deviations. Ineffective (late or inadequate) highway construction inspection was the risk factor with the lowest standard deviation. DSCs (new utility
- conflicts or utility conflicts that were not resolved properly during design) and errors in plans, specifications, or cost estimates had the lowest standard deviations among contractors.
- Environmental process risk factors. Delays starting the environmental review had the highest standard deviations, particularly in relation to project delivery delays. For this category, standard deviations were higher among project owners and consultants than among contractors or utility owners.
- Right-of-way acquisition risk factors. Delays acquiring critical parcels (e.g., parcels on eminent domain or parcels needed for utility relocations) had the lowest standard deviations. The ratings provided by contractors for delays acquiring critical parcels was less scattered compared to the ratings provided by project owners, consultants, and utility owners.
- Utility process risk factors. Ratings provided by all respondents for inaccurate or incomplete utility facility data during design were less scattered than all other risk factors. Standard deviations were generally higher for post-utility relocation risk factors. Utility owners’ ratings were less scattered than project owners, consultants, and contractors.
OVERALL TRENDS
The survey results described in this chapter confirm the trends and lessons learned from the literature review in Chapter 2. The survey results also considerably expand the knowledge base behind those trends because of the level of disaggregation that was used for the survey. In total, the survey included 61 risk factors for which a measure of central tendency (average) and a measure of dispersion (standard deviation) were possible because of the substantial number of respondents who participated in the survey.
Numerous tables can also be prepared to illustrate the results of the survey. For example, a tabulation of risk factors sorted by frequency of occurrence is possible. Disaggregated tables by type of stakeholder are also possible. As an illustration, Table 39 shows the top 20 risk factors, sorted by overall frequency. Table 40 shows the list of 20 risk factors (in the same order as in Table 39), disaggregated by type of stakeholder (i.e., project owner, consultant, contractor, utility owner).
Table 39. Top 20 Risk Factors (Aggregated Average).
| Risk Factors | All | |||
|---|---|---|---|---|
| PD | PC | UD | All | |
| DSCs (new utility conflicts or utility conflicts that were not resolved properly during design) | 3.7 | 3.6 | 3.7 | 3.7 |
| Delays acquiring critical parcels (e.g., parcels on eminent domain or parcels needed for utility relocations) | 3.7 | 3.5 | 3.8 | 3.7 |
| Delays getting utility owners to respond and begin coordination | 3.9 | 3.4 | 3.6 | 3.7 |
| Inaccurate or incomplete utility facility data during design | 3.8 | 3.6 | 3.5 | 3.6 |
| Errors in plans, specifications, or cost estimates | 3.6 | 3.7 | 3.5 | 3.6 |
| Delays getting utility owners to schedule utility relocations in the field | 3.7 | 3.5 | 3.6 | 3.6 |
| Delays acquiring all parcels | 3.6 | 3.3 | 3.6 | 3.5 |
| Risk Factors | All | |||
|---|---|---|---|---|
| PD | PC | UD | All | |
| Changes in highway design prior to letting | 3.3 | 3.4 | 3.6 | 3.5 |
| Unrealistic timeframe by project owner for utility coordination and utility relocations | 3.5 | 3.3 | 3.3 | 3.4 |
| Delays identifying and resolving utility conflicts | 3.4 | 3.3 | 3.3 | 3.3 |
| Delays acquiring replacement easements for utility relocations | 3.4 | 3.1 | 3.5 | 3.3 |
| Inadequate utility relocation schedule | 3.5 | 3.3 | 3.2 | 3.3 |
| Utility owners holding off on relocation design until the right-of-way has been acquired | 3.4 | 3.2 | 3.2 | 3.3 |
| Unrealistic timeframe by utility owner for completing utility relocation work in the field | 3.3 | 3.2 | 3.3 | 3.3 |
| Utility owners holding off on relocation design until project plans are at least 60% or 90% complete | 3.4 | 3.1 | 3.2 | 3.3 |
| Delays obtaining permits (e.g., U.S. Fish and Wildlife, U.S. Army Corps of Engineers, and so on) | 3.5 | 3.1 | 3.0 | 3.2 |
| Inadequate coordination or sequencing among utility owners using common poles or duct banks | 3.2 | 3.1 | 3.2 | 3.2 |
| Delays getting responses from utility owner when there are highway construction changes that necessitate coordination | 3.3 | 3.1 | 3.1 | 3.2 |
| Inadequate utility relocation plans | 3.2 | 3.2 | 3.1 | 3.2 |
| Right-of-way encroachments or features impeding utility relocations | 3.0 | 3.1 | 3.2 | 3.1 |
Table 40. Top 20 Risk Factors (Disaggregated Average).
| Risk Factors | Project_ Owner | Consultant | Contractor | Utility Owner | ||||||||||||
|---|---|---|---|---|---|---|---|---|---|---|---|---|---|---|---|---|
| PD | PC | UD | All | PD | PC | UD | All | PD | PC | UD | All | PD | PC | UD | All | |
| DSCs (new utility conflicts or utility conflicts that were not resolved properly during design) | 3.5 | 3.3 | 3.5 | 3.4 | 3.8 | 3.6 | 3.3 | 3.5 | 4.4 | 4.4 | 4.7 | 4.5 | 3.0 | 3.0 | 3.3 | 3.1 |
| Delays acquiring critical parcels (e.g., parcels on eminent domain or parcels needed for utility relocations) | 3.5 | 3.2 | 3.5 | 3.4 | 4.0 | 3.7 | 4.2 | 4.0 | 4.3 | 4.4 | 4.6 | 4.4 | 3.6 | 3.6 | 3.0 | 3.4 |
| Delays getting utility owners to respond and begin coordination | 3.8 | 3.2 | 3.5 | 3.5 | 3.9 | 3.4 | 3.6 | 3.6 | 4.3 | 4.2 | 4.1 | 4.2 | 3.3 | 3.0 | 3.1 | 3.1 |
| Inaccurate or incomplete utility facility data during design | 3.6 | 3.4 | 3.2 | 3.4 | 3.8 | 3.8 | 3.6 | 3.7 | 4.4 | 4.2 | 4.3 | 4.3 | 2.9 | 2.9 | 3.0 | 2.9 |
| Errors in plans, specifications, or cost estimates | 3.4 | 3.5 | 3.3 | 3.4 | 3.3 | 3.4 | 3.2 | 3.3 | 4.3 | 4.5 | 4.4 | 4.4 | 3.3 | 3.3 | 3.0 | 3.2 |
| Delays getting utility owners to schedule utility relocations in the field | 3.6 | 3.4 | 3.4 | 3.4 | 3.7 | 3.5 | 3.7 | 3.7 | 4.3 | 4.1 | 4.3 | 4.2 | 2.8 | 2.9 | 2.7 | 2.8 |
| Delays acquiring all parcels | 3.3 | 2.8 | 3.3 | 3.2 | 4.0 | 3.8 | 4.0 | 3.9 | 4.1 | 4.0 | 4.4 | 4.2 | 3.4 | 3.2 | 2.4 | 3.0 |
| Changes in highway design prior to letting | 3.3 | 3.3 | 3.5 | 3.4 | 3.4 | 3.7 | 3.7 | 3.6 | 3.3 | 3.6 | 3.8 | 3.6 | 3.7 | 3.0 | 3.0 | 3.2 |
| Unrealistic timeframe by project owner for utility coordination and utility relocations | 3.2 | 3.0 | 3.1 | 3.1 | 3.7 | 3.5 | 3.4 | 3.5 | 3.9 | 3.9 | 3.6 | 3.8 | 4.0 | 3.4 | 3.3 | 3.6 |
| Risk Factors | Project_ Owner | Consultant | Contractor | Utility Owner | ||||||||||||
|---|---|---|---|---|---|---|---|---|---|---|---|---|---|---|---|---|
| PD | PC | UD | All | PD | PC | UD | All | PD | PC | UD | All | PD | PC | UD | All | |
| Delays identifying and resolving utility conflicts | 3.2 | 3.0 | 3.1 | 3.1 | 3.3 | 3.4 | 3.3 | 3.3 | 4.3 | 4.1 | 4.0 | 4.1 | 2.9 | 3.1 | 2.7 | 2.9 |
| Delays acquiring replacement easements for utility relocations | 3.0 | 2.8 | 3.2 | 3.0 | 3.8 | 3.4 | 3.9 | 3.7 | 3.8 | 3.9 | 4.4 | 4.0 | 3.4 | 3.0 | 3.0 | 3.1 |
| Inadequate utility relocation schedule | 3.4 | 3.1 | 3.0 | 3.2 | 3.4 | 3.3 | 3.3 | 3.3 | 4.1 | 4.0 | 4.0 | 4.0 | 2.4 | 2.6 | 2.4 | 2.5 |
| Utility owners holding off on relocation design until the right-of-way has been acquired | 3.2 | 2.9 | 3.0 | 3.1 | 3.5 | 3.2 | 3.4 | 3.3 | 3.8 | 3.8 | 4.0 | 3.8 | 3.8 | 3.2 | 2.6 | 3.2 |
| Unrealistic timeframe by utility owner for completing utility relocation work in the field | 3.2 | 3.0 | 3.1 | 3.1 | 3.4 | 3.4 | 3.3 | 3.4 | 3.6 | 3.6 | 3.7 | 3.6 | 2.7 | 2.6 | 2.6 | 2.6 |
| Utility owners holding off on relocation design until project plans are at least 60% or 90% complete | 3.3 | 2.8 | 3.2 | 3.1 | 3.4 | 3.1 | 2.9 | 3.2 | 3.9 | 3.8 | 4.0 | 3.9 | 3.7 | 3.0 | 3.3 | 3.3 |
| Delays obtaining permits (e.g., U.S. Fish and Wildlife, U.S. Army Corps of Engineers, and so on) | 3.3 | 3.0 | 2.8 | 3.0 | 3.9 | 3.3 | 3.0 | 3.4 | 4.0 | 4.3 | 4.3 | 4.2 | 4.0 | 2.5 | 4.0 | 3.5 |
| Inadequate coordination or sequencing among utility owners using common poles or duct banks | 3.0 | 2.9 | 3.0 | 3.0 | 3.4 | 3.2 | 3.4 | 3.3 | 3.8 | 3.8 | 3.7 | 3.8 | 2.9 | 2.7 | 2.4 | 2.7 |
| Delays getting responses from utility owner when there are highway construction changes that necessitate coordination | 3.0 | 2.8 | 2.9 | 2.9 | 3.6 | 3.2 | 3.1 | 3.3 | 4.0 | 3.8 | 3.9 | 3.9 | 2.2 | 2.6 | 2.3 | 2.3 |
| Inadequate utility relocation plans | 3.1 | 2.9 | 2.8 | 3.0 | 3.0 | 3.1 | 3.0 | 3.0 | 4.2 | 4.1 | 4.1 | 4.1 | 2.4 | 2.6 | 2.3 | 2.4 |
| Right-of-way encroachments or features impeding utility relocations | 2.7 | 2.7 | 2.7 | 2.7 | 3.5 | 3.6 | 3.7 | 3.6 | 3.1 | 4.0 | 3.8 | 3.6 | 3.0 | 2.8 | 3.3 | 3.0 |


