Effective Low-Noise Rumble Strips (2024)
Chapter: 4 Evaluation of Experimental Rumble Strips

CHAPTER 4
Evaluation of Experimental Rumble Strips
Test Sites and Installation of Sinusoidal Rumble Strips
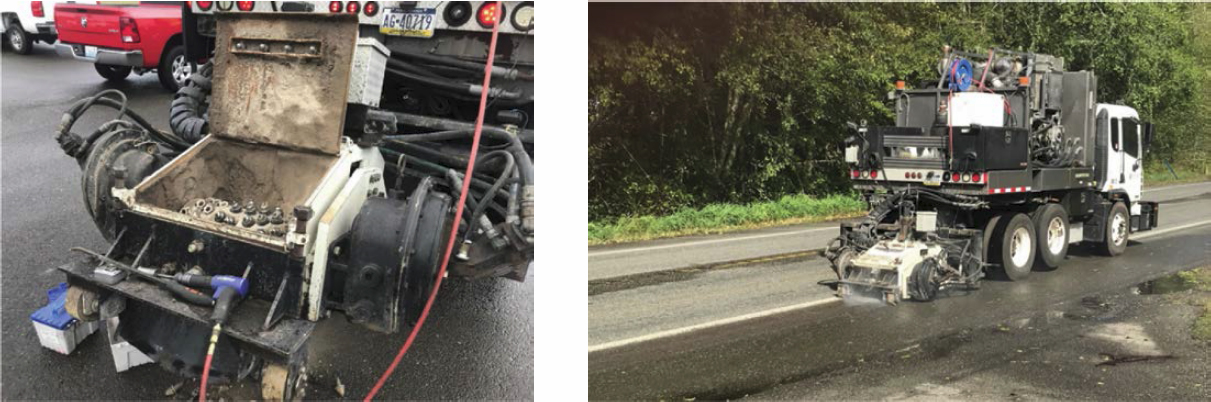
The 20 sinusoidal designs of Table 3 test sites were installed along SR 105 near Aberdeen, Washington, in cooperation with the WSDOT. SR 105 is a 55-mph, rural two-lane highway between Aberdeen and Westport, Washington, that has a chip seal overlay on travel lanes and an older DGAC pavement on the shoulder, which is where the rumble strips were installed. Surface Preparation Technologies, LLC provided the installation of the experimental rumble strips, and the WSDOT standard strips were installed in between the sinusoidal strips. The contractor used a computer-controlled milling head so that the sinusoidal designs and the WSDOT strips could be installed efficiently in less than a day. Photographs of the milling head and an installation of one of the sinusoidal strip designs are shown in Figure 35.
The profiles for all 20 of the sinusoidal rumble strips are provided in Appendix D, along with the installed dimensions and rumble strip photographs. The specified design dimensions and the measured installed dimensions for each sinusoidal test site are summarized in Table 4. The WSDOT standard strips consist of cylindrical milling of the pavement at a regular interval with an unground portion between. The ground portions are typically 5 inches long in the direction of travel, with a depth of 3/8 inches and radius of curvature of 12 inches. Spacing of the cylindrical depressions is 12 inches, and they extend in length 48 feet, after which there is a 12-foot gap without depressions for bicycle access.
Measurement Results
Test Vehicles at the Washington Test Sites
Following the suggested test procedure described in Chapter 2, four vehicles were included in each type of measurement, representing the small compact car, mid- to full-size sedan, mid-size SUV, and large, full-frame pickup truck or SUV categories. Dimensions and photographs of each vehicle are provided in Appendix D.
OBSI at the Washington Test Sites
OBSI measurements were made at each of the 20 Washington test sites adjoining the pass-by measurement locations, as well as along the shoulder at WB4 and WB6. Five-second overall averages were made at each site, and the overall levels are shown in Figure 36. The chip seal pavement at each of the 20 sites resulted in overall OBSI levels ranging from 105.9 to 107.1 dB (average of 106.6 dB) for all the sites. The older DGAC pavement along the shoulder resulted in an average OBSI level of 103.9 dB. Spectral data is detailed in Appendix D.
Pass-by Measurement Results at the Washington Test Sites
The shoulder rumble strip pass-by noise measurements were performed following the AASHTO TP 98 procedure, modified for measurements of specific vehicles in the same manner described in Chapters 2 and 3. To expedite testing at 20 sites, measurements were made at two rumble strip sites simultaneously, with two test vehicles operating independently. SLMs were used at each site to acquire the sound level time histories. The microphones were supported on extendable poles, where necessary, and a microphone cable was used to accommodate different terrain, such that microphones were positioned at heights of 5 feet above the pavement surface.
Table 4. Specified and as installed dimensions of the sinusoidal rumble strips.
| Site | Wavelength, in. | Amplitude, in. | Recess, in. | |||
|---|---|---|---|---|---|---|
| Specified | Measured | Specified | Measured | Specified | Measured | |
| WB1 | 14 | 14 | 3/8 | 3/8 | 1/8 | 1/8 |
| WB2 | 16 | 16 | 3/8 | 3/8 | 1/8 | 1/8 |
| WB3 | 18 | 18 | 3/8 | 3/8 | 1/8 | 1/8 |
| WB4 | 16 | 16 | 5/16 | 5/16 | 0 | 0 |
| WB5 | 15 | 15 | 5/16 | 5/16 | 0 | 0 |
| WB6 | 16 | 16 | 1/2 | 1/2 | 0 | 0 |
| WB7 | 12 | 12 | 3/8 | 3/8 | 1/8 | 1/8 |
| WB8 | 14 | 14 | 7/16 | 7/16 | 0 | 0 |
| WB9 | 14 | 14 | 1/2 | 1/2 | 1/8 | 1/8 |
| EB1 | 14 | 14 | 5/16 | 5/16 | 0 | 0 |
| EB2 | 14 | 14 | 3/8 | 5/16 | 0 | 0 |
| EB3 | 14 | 14 | 1/2 | 1/2 | 0 | 0 |
| EB4 | 16 | 16 | 3/8 | 3/8 | 0 | 0 |
| EB5 | 14 | 14 | 7/16 | 7/16 | 1/8 | 1/8 |
| EB6 | 24 | 24 | 3/8 | 3/8 | 1/8 | 0 |
| EB7 | 14 | 14 | 5/16 | 5/16 | 1/8 | 0 |
| EB8 | 17 | 17 | 3/8 | 3/8 | 1/8 | 0 |
| EB9 | 13 | 13 | 3/8 | 5/16 | 1/8 | 0 |
| EB10 | 15 | 15 | 1/2 | 7/16 | 0 | 0 |
| EB11 | 15 | 15 | 3/8 | 5/16 | 1/8 | 1/8 |
Note: The width of all rumble strips perpendicular to the direction of travel was 12 inches.
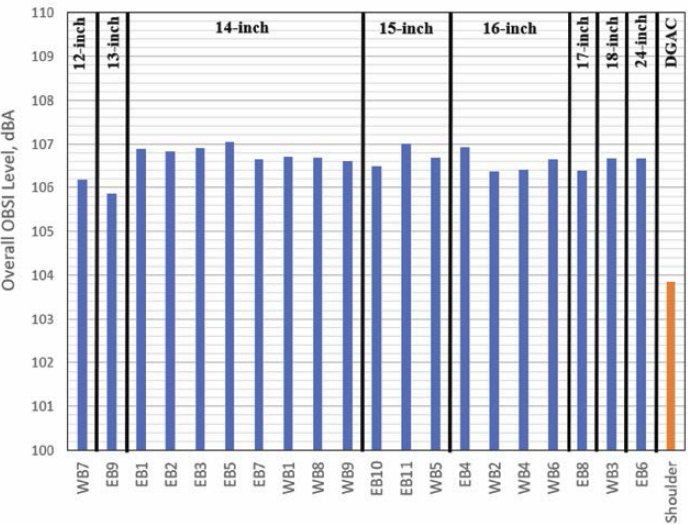
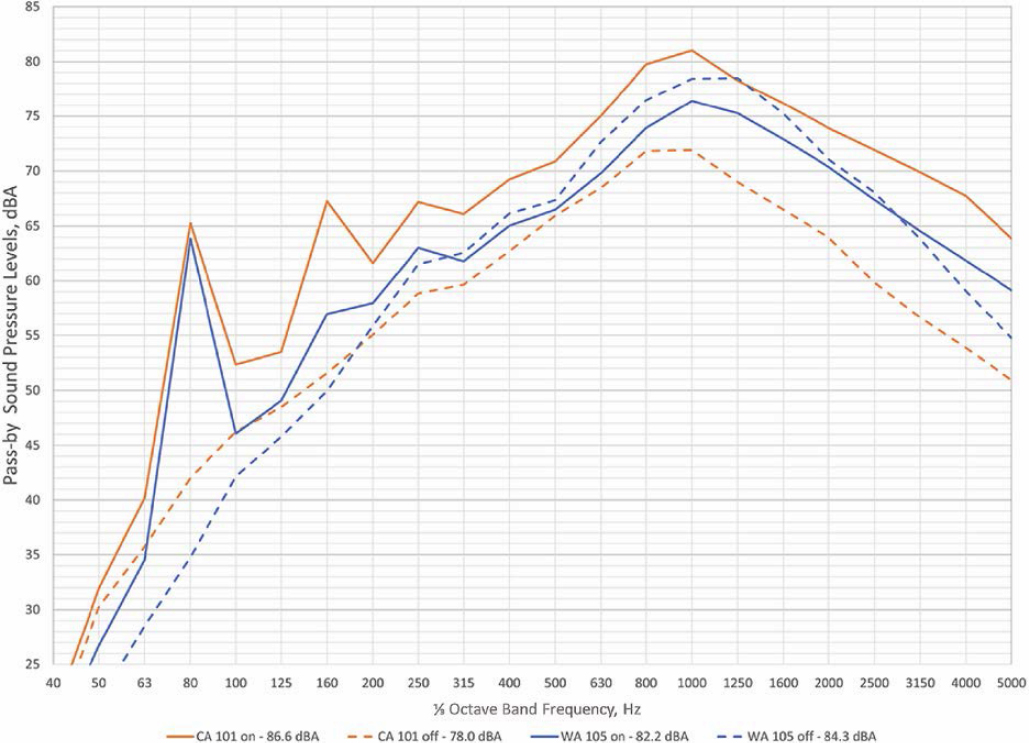
As noted in Figure 36, the OBSI levels on the asphalt shoulders of SR 105 were 2 to 3 dB lower than those of the mainline chip seal surface. As a result, the noise levels for the off-strip pass-by events (on the chip seal) were at times just as noisy or noisier than the on-strips, in terms of overall A-weighted level. While the tones at the excited frequency for each wavelength (e.g., 80 Hz for 14-inch sites) were audible during the pass-bys, the elevated levels off the strips, which were due to the chip seal overlay, were dominated by the energy in the bands above 200 Hz. This behavior was not encountered in any of the previous testing in California or at three of the four Midwest sites. An example of this is shown in Figure 37, comparing the California data from US 101 to that from EB3 on SR 105 in Washington, both of which have 14-inch wavelength sinusoidal rumble strips. For the US 101 data, the levels in each 1/3 octave band on the strips are greater than off the strips, producing an overall difference of 8.6 dB. For the EB3 data, the bands between 315 and 2,500 Hz off the strips have higher levels than on the strips, producing an overall difference in A-weighted level of (-)2.1 dB between on and off. On the strips, the tone produced by the sinusoidal strips at 80 Hz constitutes a “prominent tone,” as defined in ANSI S12.9.1 Even at low frequency, such prominent tones are detectable in the presence of higher background noise and hence need to be considered. To accomplish this, the overall A-weighted levels were recalculated by summing the energy (“band-passing”) from 31.5 to 200 Hz in the maximum overall spectra. This eliminates the upper-frequency levels that are dominated by the chip seal pavement and retains that portion of the spectra more strongly influenced by the sinusoidal repetition rates, ranging from 40 to 100 Hz, depending on the wavelength.
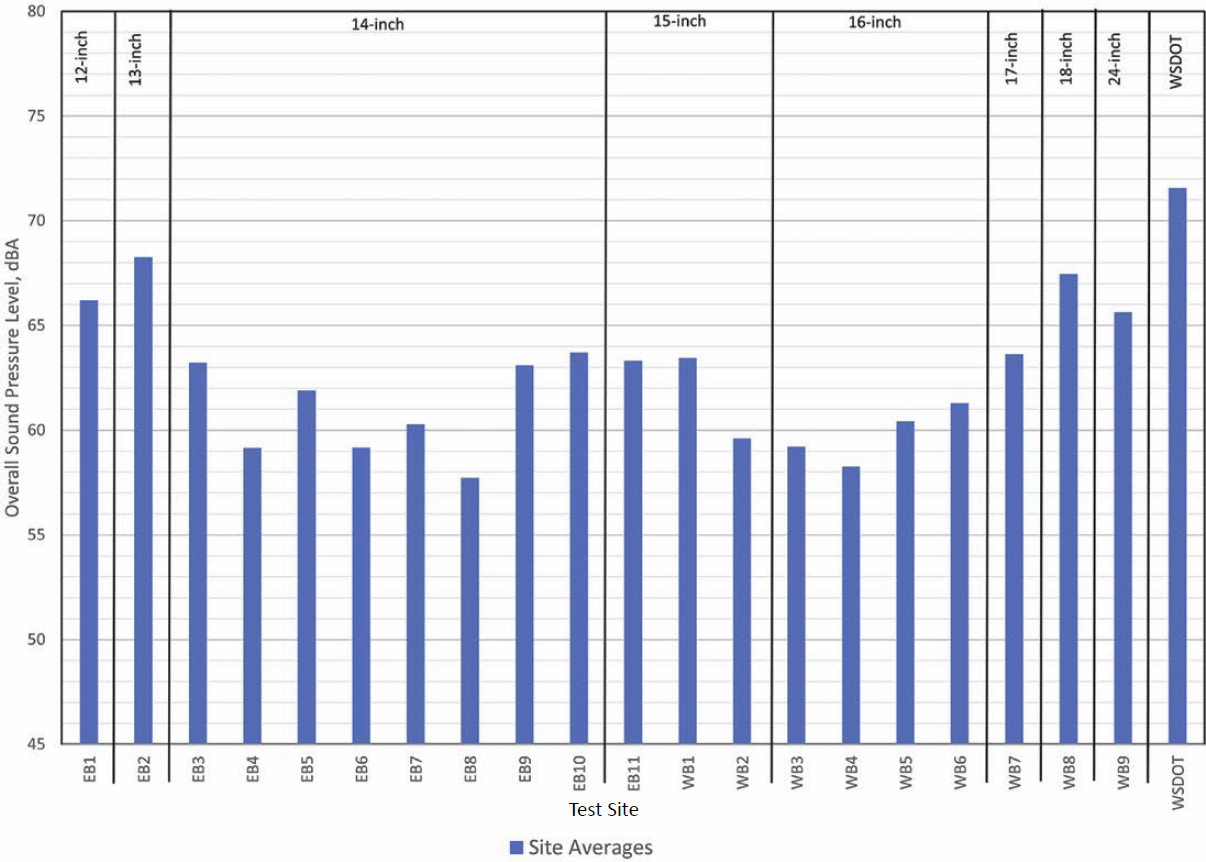
The resultant levels were then averaged numerically across the vehicles, providing the results shown in Figure 38. For the average of all vehicles, the WSDOT standard rumble strips had the highest band-passed level of 71.6 dBA. The lowest levels were below 60 dBA and occurred at three sites: one of 14 inches, one of 15 inches, and one of 16 inches. The two shorter wavelength sites of 12 and 13 inches were greater than 65 dBA, as were the longer wavelengths of 18 and 24 inches.
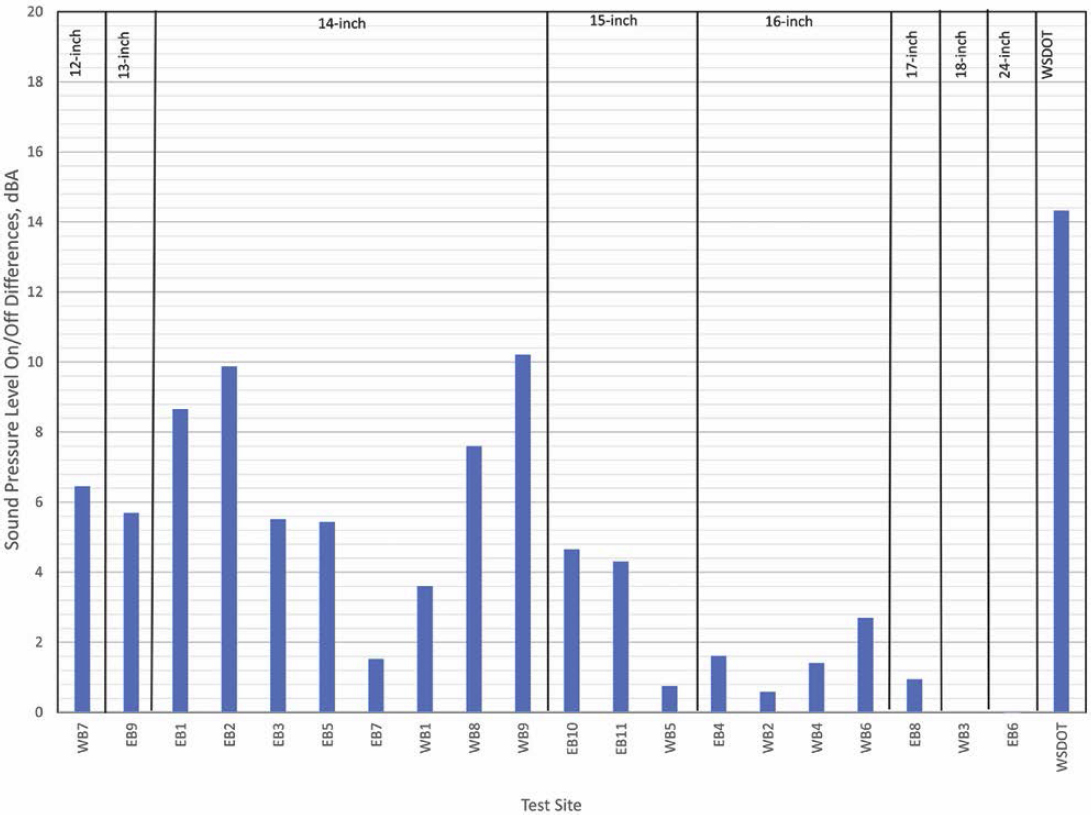
The on/off increments were calculated by subtracting the band-passed 31.5 to 200 Hz off-strip levels from the corresponding on-strip levels at each site. These are shown for the average of all vehicles in Figure 39. Following Figure 38, the site with the WSDOT standard strips produced
the greatest on/off differential and was more than 10 dB greater than some of the 14-, 15-, and 16-inch sinusoidal strips. Some of the 14-, 15-, and 16-inch strips had increments of less than 2 dB. The longer wavelengths of 17-, 18-, and 24-inches had increments of less than 1 dB, in part due to the high levels off strip, which was due to the chip seal surface of the travel lanes.
While analyzing the pass-by noise data, comparisons of time histories for overall A-weighted level and for the ⅓ octave bands at or near the sinusoidal rumble repetition rate were made. These indicated that the maximum of the ⅓ octave bands consistently lagged behind the maximum of the overall A-weighted level by an average of 0.7 seconds. The results of this analysis are presented in Appendix D. Because of these unexplained time lags, the maximum levels in the band of the repetition rates were typically higher than the level in the band at the maximum of the overall A-weighted level. This time lag was not noted by the instrument operators of the pass-by equipment and was only identified in later data processing. To determine if this phenomenon also occurred at distances beyond the 25-foot pass-by measurement location, pass-bys were measured at greater distances at some of the sites where this was possible without obstruction. The results of these measurements are also provided in Appendix D.
Interior Noise and Vibration Measurement Results at the Washington Test Sites
Interior noise and vibration data were taken at all 20 sinusoidal tests sites and the conventional WSDOT strips using all four test vehicle types. Ten-second data were taken, collecting overall and
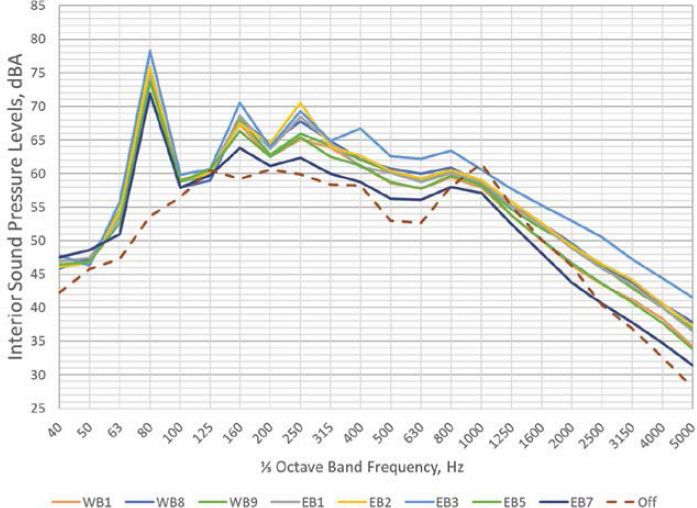
spectral information every 0.1 seconds. A minimum of three runs, both on and off strips at 60 and 45 mph, were made at each site using both primary and secondary sensors for both noise and vibration. Similar to the pass-by data, all of the interior noise spectra were band-passed in order to minimize the influence of the chip seal pavement. For these data, the harmonic frequency (twice the repetition rate) was more pronounced than for the pass-by data, and subjectively, the sounds of these peaks were quite noticeable inside the test vehicles. To capture this, the analysis band was expanded from 31.5 to 315 Hz. An example of the spectra for the 14-inch sites is shown in Figure 40 along with the average of the off-strip levels on the chip seal. For the results for the secondary locations (FC and SC) and specific vehicles, refer to Appendix D.
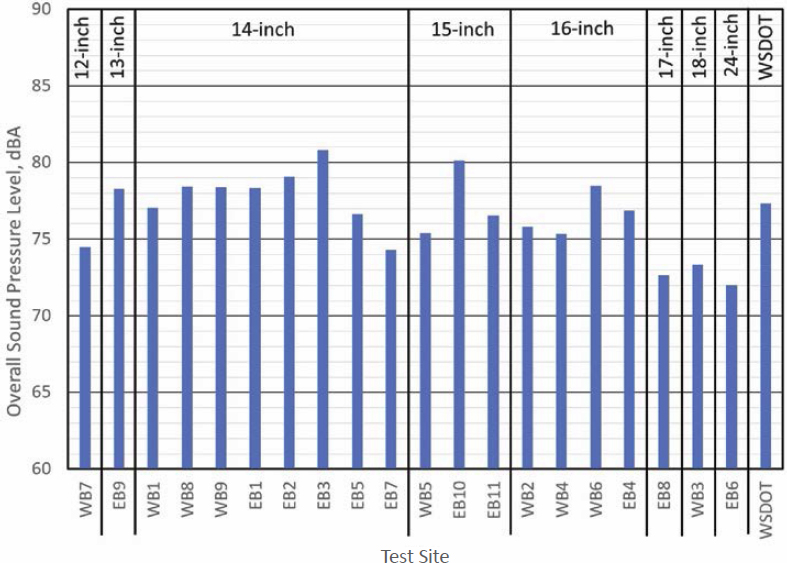
The band-passed interior noise levels from each site were determined for each test vehicle. These levels were averaged numerically across the vehicles, providing levels shown in Figure 41 for the primary CC microphone location (FC data is provided in Appendix D).
The band-passed levels ranged from about 73.0 to 80.5 dBA. Interestingly, the highest interior noise levels were not produced on the WSDOT strips, which produced the highest pass-by levels (see Figure 38). Three other sites (EB6, WB3, and WB7) produced levels within 1 dB of the WSDOT site. The loudest site was EB3 (80.5 dBA), followed by EB2, EB10, and EB9, respectively.
The on/off increments for the CC microphone averaged for all vehicles for each site are shown in Figure 42 (on/off increments measured with the FC microphone are provided in Appendix D). Eight sites achieved increments of 10 dBA or more between on and off strips for the average of test vehicles. The three highest increments were for EB3 (14-inch wavelength), EB10 (15-inch wavelength) and EB9 (13-inch wavelength). The WSDOT strips had the fourth highest increment followed closely by three 14-inch sites (WB8, WB9, and EB1), the 16-inch site WB6, and the
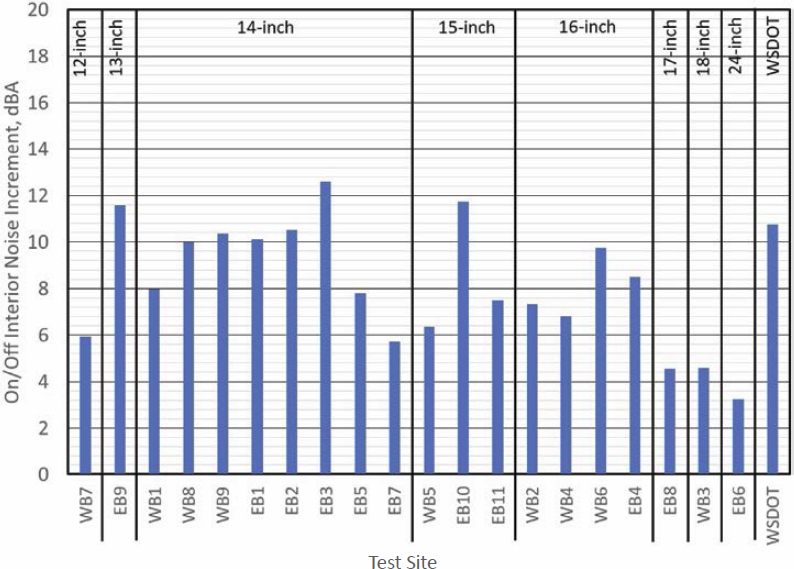
13-inch site. The longer wavelength sites (EB8, WB3, and EB6) performed poorly, with increments of about 3 to 4.5 dB. The average increments at the conventional WSDOT site resulted in more than 10 dBA.
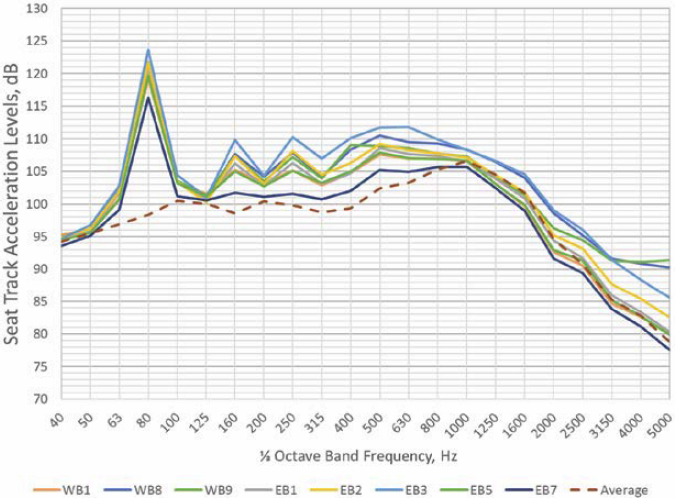
The spectra averaged across all test vehicles measured with the ST accelerometer at the 14-inch sites are shown in Figure 43. These spectra also show somewhat elevated levels at the frequency bands above 315 Hz. Consistent with the interior noise data, the overall levels for accelerometer positions were calculated by band-passing the spectra from 31.5 to 315 Hz so that it would include the harmonic of the strip repetition rates. The levels for each of the test vehicles were averaged numerically to produce the overall levels shown in Figure 44.
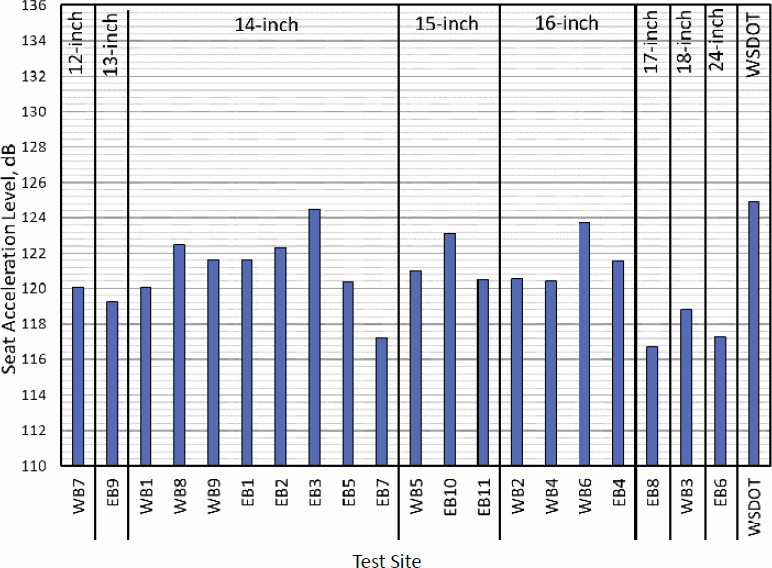
Unlike the interior noise results of Figure 41 where the band-pass levels for the WSDOT strips were among the lowest, the acceleration levels were the highest of all the strips. For the sinusoidal strips, site EB3 produced the highest level and was within 1.5 dB of the WSDOT strips. Levels above 122 dB were also measured for site EB4 (14-inch) and site WB6 (16-inch). The sites with lower levels below 119 dB included the 14-inch sites of EB6, EB7, and EB8, as well as WB3 (16-inch) and WB7 (18-inch).
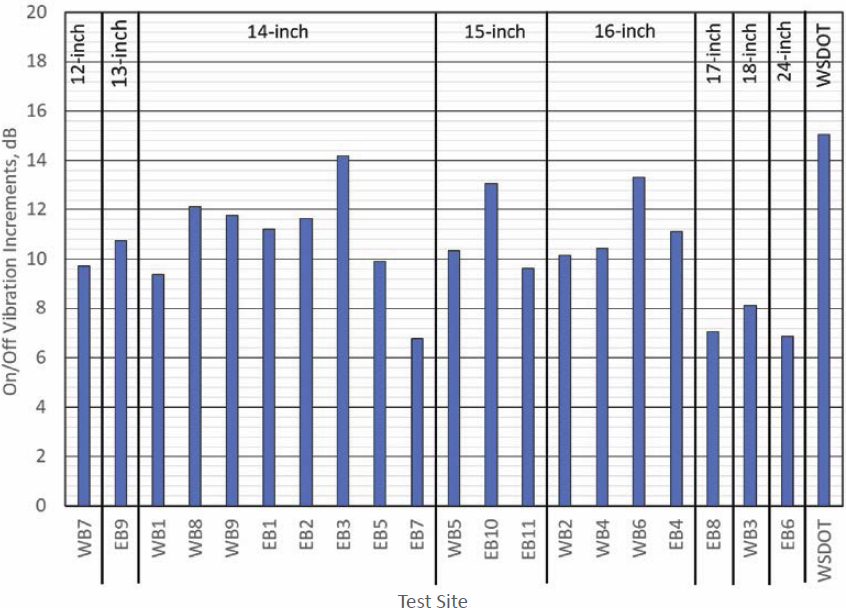
The on/off increments for the ST acceleration measurements are shown in Figure 45. The WSDOT strips were again slightly greater than any of the sinusoidal strips by less than 1 dB. Of the sinusoidal strips, EB3 (14-inch), EB10 (15-inch), and WB6 (16-inch) performed the best, being 0.7 to 1.5 dB of the WSDOT strip values. Besides these, eight sites produced acceleration increments over 10 dB. Three sites were outstandingly lower: EB7 (14-inch), EB8 (17-inch) and EB6 (24-inch).
With the microphones, the highest band-passed levels measured at 45 mph for the average of all vehicles occurred at the EB3 (14-inch wavelength) test site, and the lowest levels occurred at EB6 (24-inch wavelength) and EB7 (14-inch wavelength). Only one sinusoidal test site resulted in average on/off increments of 10 dBA or more at 45 mph: EB3 (14-inch wavelength).
At 45 mph, vibration on/off increments averaged across all vehicles was 10 dB or more at each of the sinusoidal sites except the 12-inch site, the 13-inch site, the 14-inch site (EB7), the 17-inch site, the 18-inch site, and the 24-inch site.