Effective Low-Noise Rumble Strips (2024)
Chapter: 2 Research Approach and Measurement Procedures

CHAPTER 2
Research Approach and Measurement Procedures
Preliminary Procedures, Measurements, and Result
Preliminary Procedures
Pass-by Noise Measurements
The noise produced by lane departures is generally experienced at some distance from the roadway where residences are located. However, measuring at residential distances for purposes of standardized testing of different rumble strip designs is problematic due to varying terrain, vegetation, background noise, etc. In previous research, on-board techniques such as on-board sound intensity (OBSI) following AASHTO T 360 were evaluated but determined not to be useful because the sound radiated by the tire on rumble strips was negative in direction below 400 Hz (AASHTO 2016, Donavan 2018). However, OBSI measurements were made of the road surface off the strips to better assess the on/off performance of various pavements.
As a result, the pass-by measurements alongside the roadway were selected for the purpose of evaluating different designs, following the AASHTO TP 98 procedure, with some exceptions (AASHTO 2012). The distance to the center line of the vehicle travel lane was maintained at 25 ft; however, the measurement microphone was physically offset for the pass-by measurements on the rumble strips, as the vehicles were no longer in the center of the nearest lane of travel. This was accomplished by using two microphones: (1) set 25 ft from the center line of the nearest travel lane (for off-strips measurements), and (2) set 25 ft from the center line of the vehicle when the passenger-side tires are aligned on the rumble strips (for on-strips measurements). The pass-by data was captured using a 2-channel sound level meter over the range from 25 to 20,000 Hz. These were set for ⅛ second exponential averaging (fast meter response) and sampled every ![]() of a second. The maximum levels for each valid pass-by were identified and averaged for each vehicle. The vehicles were operated at a constant speed of 60 and 45 mph, both for on and off the strips. At least three pass-by measurements were made for each condition. The quality of the pass-by was judged by the instrument operator in the field as to whether the vehicle was fully on or fully off the rumble strips. The pass-bys were also judged by whether noise from other vehicles possibly contaminated the pass-by noise level. Pass-bys not meeting these criteria were repeated as needed.
of a second. The maximum levels for each valid pass-by were identified and averaged for each vehicle. The vehicles were operated at a constant speed of 60 and 45 mph, both for on and off the strips. At least three pass-by measurements were made for each condition. The quality of the pass-by was judged by the instrument operator in the field as to whether the vehicle was fully on or fully off the rumble strips. The pass-bys were also judged by whether noise from other vehicles possibly contaminated the pass-by noise level. Pass-bys not meeting these criteria were repeated as needed.
Interior Noise Measurements
To develop a suggested interior noise test procedure, sound pressure levels were measured at six locations inside each vehicle at 60 and 45 mph. Five of these were hung from the headliner above the front unoccupied passenger seat, while the sixth microphone was hung from the headliner at the driver’s outboard ear. One of these approximated the position specified in the SAE recommended practice for measurement of interior sound, SAE J1777, with the microphone
fore/aft location determined by the center of the fore/aft movement of the passenger seat, centered on the headrest, and at a height above the seat cushion of 29 in (SAE 2000). The seat back was adjusted to be 19 degrees from vertical, with the microphone 7 in. forward of the headrest at an approximate ear location. This was identified as the center-center (CC) position. With the seat adjusted to the full rearward position, with the microphone still centered on the passenger seat, the rear-center (RC) position was established. Additionally, two microphones were located ±5 in. inboard and outbound from RC at the rear-outboard (RO) and rear-inboard (RI) positions. The fifth position for the passenger seat was established with the seat in its forward-most location and centered on the seat, front-center (FC). The sixth position was 1 in. outboard of the driver’s ear (DE). The interior sound pressure levels were captured with the same method as the pass-by for a duration of 8 seconds, and 2 seconds of data were averaged for a period of the highest and most consistent levels.
Vibration Measurements
Vibration levels on and off the rumble strips were measured at six locations on each test vehicle at 60 and 45 mph. At all locations, triaxial accelerometers were used to measure nominally in the vertical, lateral, and fore/aft directions, resulting in 18 channels of data. The locations were:
- Seat track – passenger side,
- Seat sensor – under the vehicle operator,
- Steering column,
- Steering wheel,
- Right-front spindle, and
- Right-rear spindle.
A photograph of the typical installation of the accelerometers for monitoring the operator input locations on the steering system is shown in Figure 2. The steering column accelerometer was glued to the plastic trim piece covering the actual steering column, as the column was not
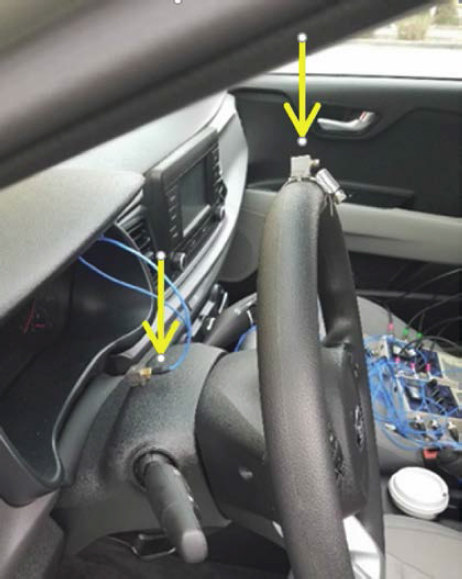
typically accessible. To securely attach the accelerometer at the steering wheel location, a small hose clamp was attached to the steering wheel, and the accelerometer was glued to it.
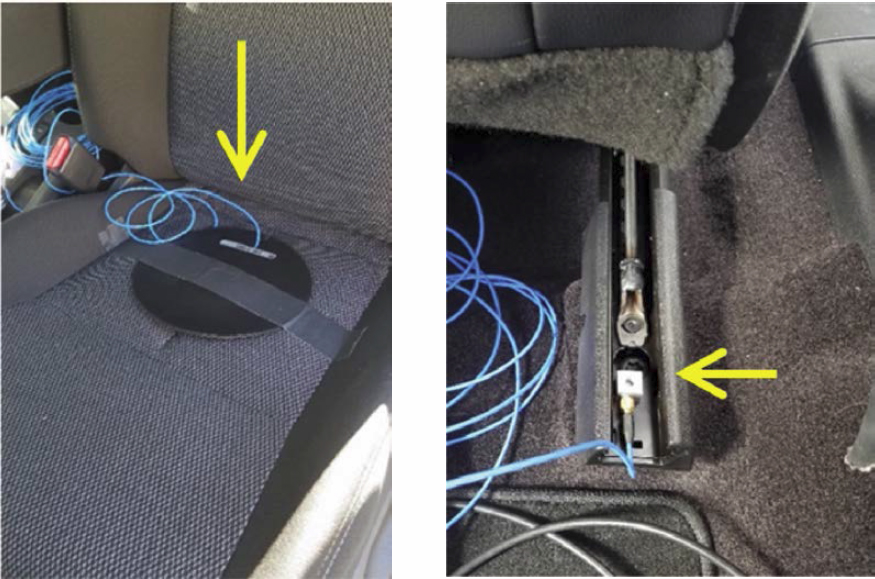
The operator’s seat was monitored with a seat sensor containing an accelerometer of the same sensitivity as the other accelerometers and had an overall weight of 272 gm, as shown on the left in Figure 3. A typical seat track mounting location for the aft end of the seat track is also shown on the right in Figure 3. The seat track location depended on accessibility when the seat was in the interior noise measurement location.
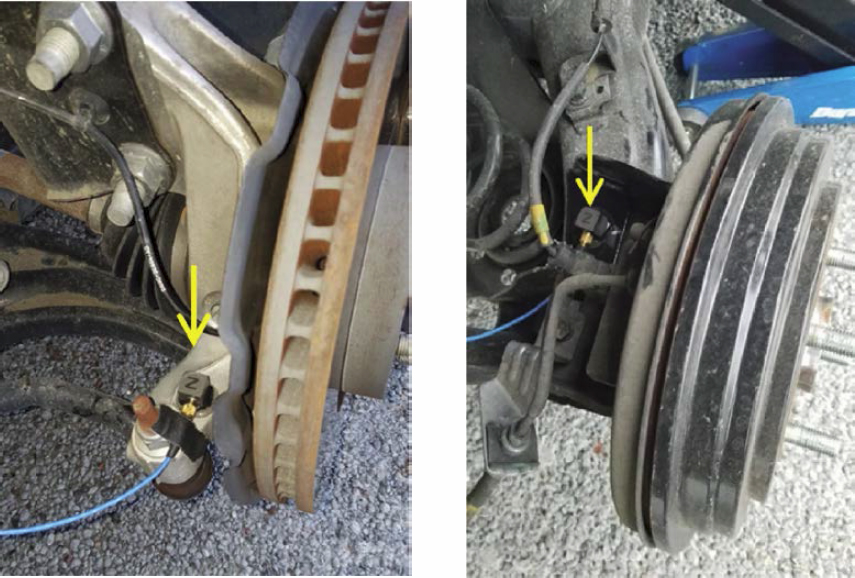
Mounting on the front and rear spindles was more problematic. It was typically not possible to mount directly on the spindle and route the cable in the absence of a vehicle hoist. However, it was possible to attach it to a control arm that directly connected to the spindle so that no isolators were located between the spindle and the point of the measurement. Figure 4 shows typical installation of front and rear spindle locations, respectively.
For all installations except the seat sensor, PCB 356A15 triaxial accelerometers were used. These have a sensitivity of 10.2 mV/m/s2 and weigh 10.5gr. The vibration data was acquired with a 16-channel analog-to-digital converter controlled by a laptop computer. The sampling rate was set to 12.8 kHz. The recorded signals were post-processed to 0.25-second root-mean-square averages in ⅓ octave bands from 2 to 5,000 Hz. To capture all 18 of the channels of data, two measurement configurations were required.
Description of Rumble Strips
Photographs of the two types of rumble strips included in the measurement program are shown in Figures 5 and 6. The cylindrical ground strips (Figure 5) are of a type commonly used in the United States and are formed by cylindrical milling heads that grind away a portion of the pavement surface with a regular spacing. The cylindrical indentations are 5½ in. in length with a depth of ⅜ in. and separated by a center-to-center distance of 12 in. These strips have abrupt
transitions as a tire enters and exits the indentions. Sinusoidal rumble strips or “mumble” strips (Figure 6) are continuous in profile, as the milling head is depressed into the pavement periodically to a depth from 0 to ![]() in. The peak-to-peak distance (wavelength) is 14 in. At 60 mph, this spacing corresponds to 75 Hertz (Hz). This design had been theoretically optimized for generating maximum interior response in the vehicle without creating excessive exterior noise (Donavan 2018). The 12 in. spacing of the cylindrical “bump” grind design produces a repetition rate of 88 Hz at 60 mph.
in. The peak-to-peak distance (wavelength) is 14 in. At 60 mph, this spacing corresponds to 75 Hertz (Hz). This design had been theoretically optimized for generating maximum interior response in the vehicle without creating excessive exterior noise (Donavan 2018). The 12 in. spacing of the cylindrical “bump” grind design produces a repetition rate of 88 Hz at 60 mph.


Test Vehicles
The vehicles were selected to cover a range of variables, including response, tire diameter, wheelbase, chassis isolation, and interior dimension. These are identified in Figure 7, and all test vehicles are rentals except for one. Their tire size, tire diameter, wheelbase, and ratio of wheelbase-to-strip-spacing are documented in Table 1, with the tire diameters ranging from 24 to 33½ in. The sinusoidal strip design was based on an assumed tire-deflected radius (distance of the axle to the pavement) of about 12 in. Also shown in Table 1 is the ratio of the wheelbase to nominal spacing of each type of strip. For ratios near a whole number, the inputs to the front and rear suspension are in-phase with the tires being driven upward or downward at the same
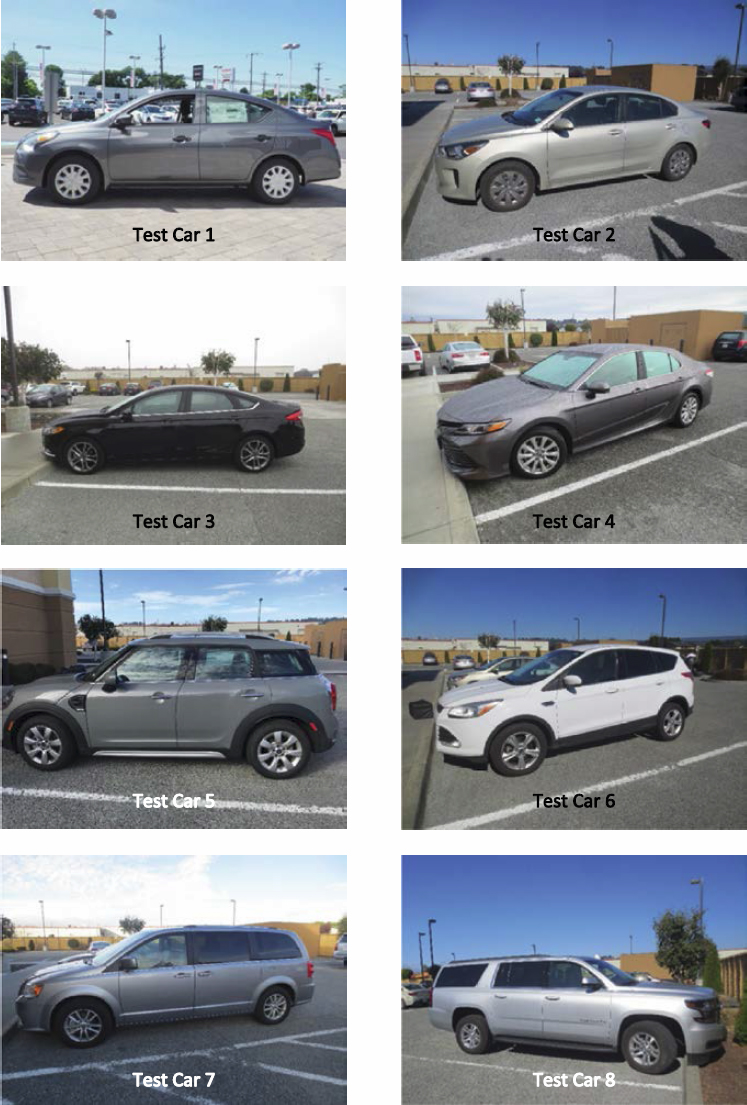
Table 1. Test vehicle specifications and first fore/aft mode frequency.
| Make/Model | Tire Size | Tire Dia., in. | Wheelbase, in. | Windshield/Backlite, in. | Interior Fore/Aft Mode Frequency, Hz |
|---|---|---|---|---|---|
| Test Car 1 | 185/65R15 | 24 | 102 | 115 | 59 |
| Test Car 2 | 185/65R15 | 24 | 102 | 110 | 62 |
| Test Car 3 | 235/45R18 | 26 | 112 | 122 | 56 |
| Test Car 4 | 215/55R17 | 26 | 112 | 115 | 59 |
| Test Car 5 | 225/55R17 | 26 | 105 | 111 | 61 |
| Test Car 6 | 235/55R17 | 26 | 106 | 125 | 54 |
| Test Car 7 | 225/65R17 | 26 | 121.5 | 148 | 46 |
| Test Car 8 | 265/65R18 | 33.5 | 127 | 151 | 45 |
Note: Dia. = Diameter.
time. For ratios ending near 0.5, the inputs are out-of-phase, such that one tire is being driven up while the other is driven down. These relationships possibly have implications for the vibration response of the different vehicles. In Table 1, the distance between the windshield and back glass, as measured on the interior of the vehicles, is provided along with the frequency for the first fore/aft interior acoustic mode. Since the geometry of the backlight and windshield is somewhat complex, these frequencies are only indicators of where the node (minimum pressure point) of the first fore/aft mode would be expected to occur inside the vehicle, creating a drop in sound pressure level compared to other fore/aft distances (Beranke and Vér 1992).
Results of Preliminary Testing
Pass-by Noise
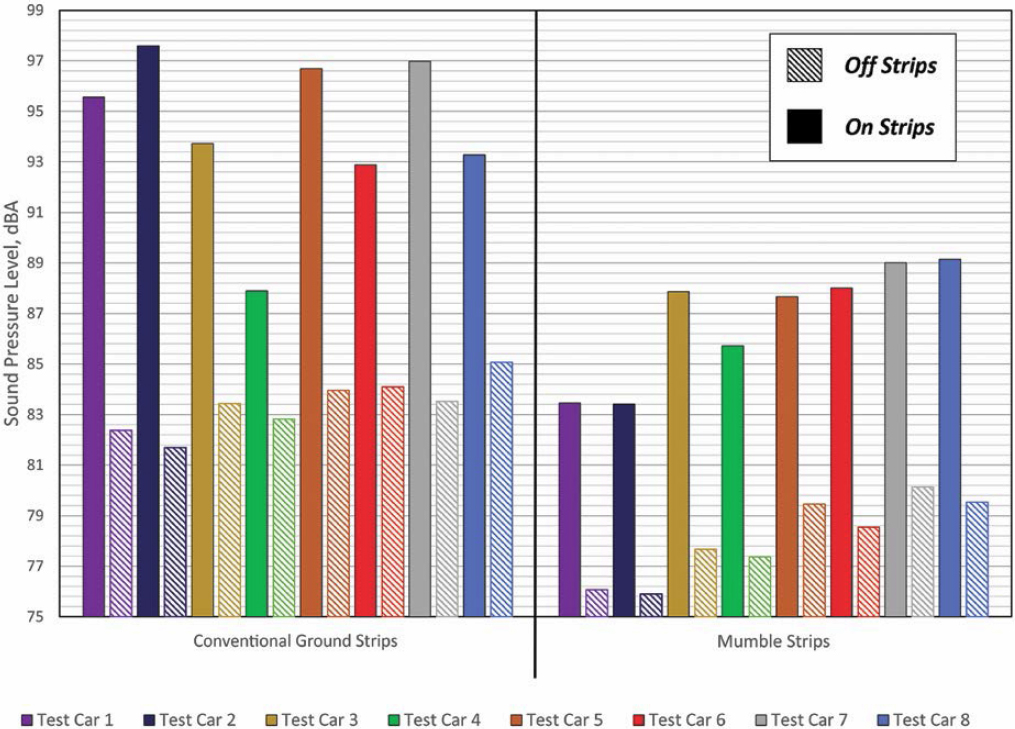
Pass-by measurements at 60 and 45 mph were made at the conventional ground and mumble strip test sites for all eight vehicles. Figure 8 shows the overall A-weighted pass-by noise levels measured for each vehicle. For each of the test vehicles, pass-by noise levels were lower on the mumble strips than on the conventional ground strips. On the mumble strips, overall noise levels ranged from 83.4 to 89.1 dBA (A-weighted decibels), with the smallest vehicles (Test Car 1 and Test Car 2) producing the lowest levels. On cylindrical strips, this was somewhat reversed, with these smaller vehicles producing levels among the highest. On the conventional ground strips, Test Car 4 produced outstandingly lower levels by 5.0 to 9.7 dB compared to the other vehicles. However, on the mumble strips, the levels for Test Car 4 fell much more in line with the other vehicles.
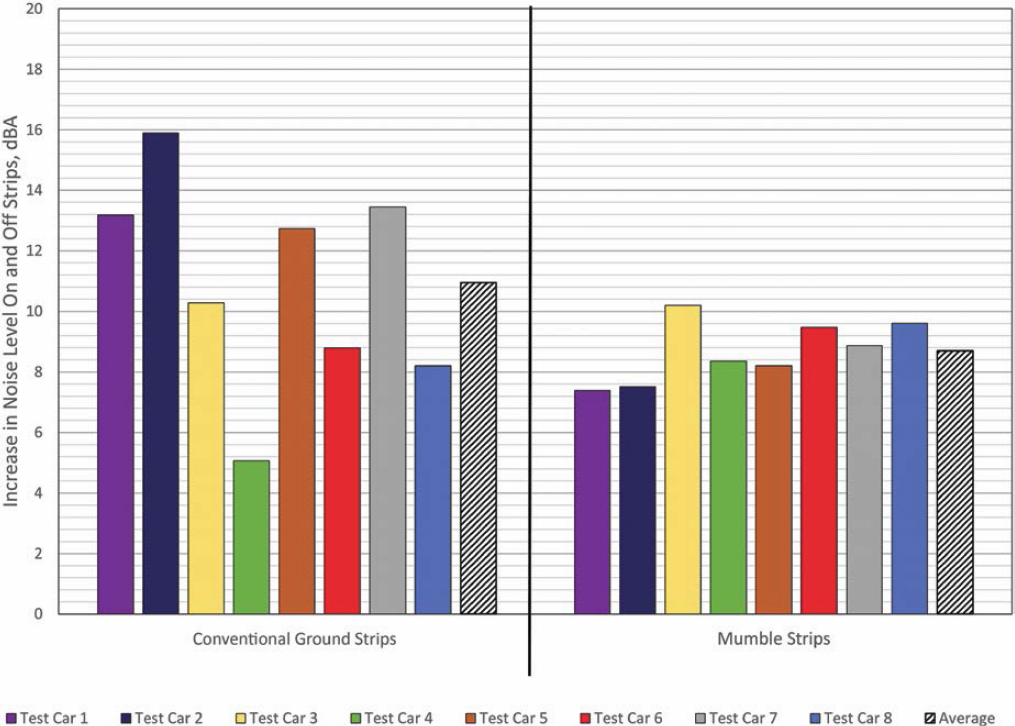
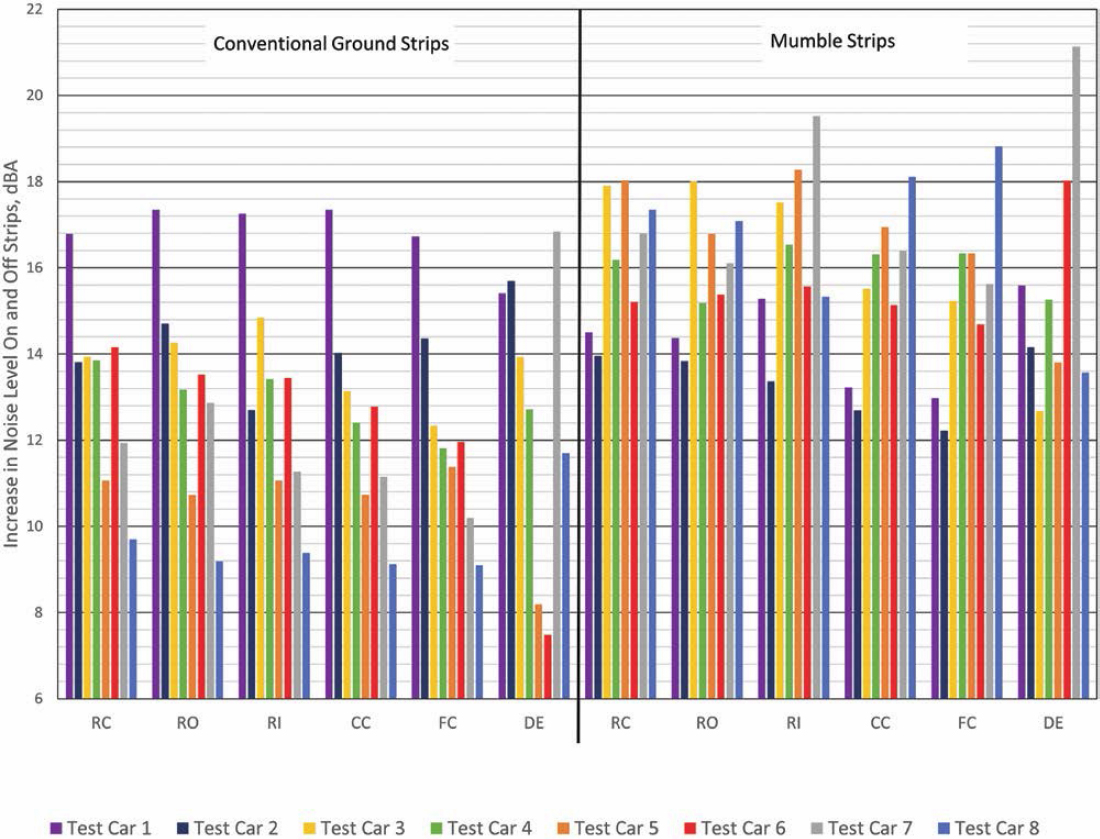
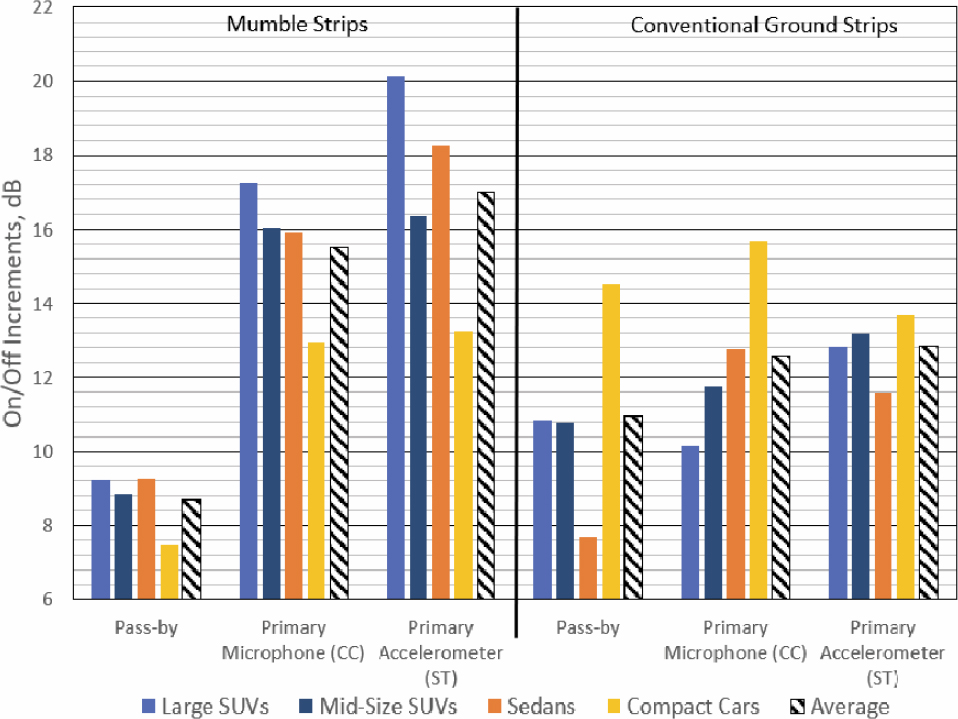
The on/off increases for the strips are shown in Figure 9. For the mumble strips, incremental increases were more uniform, with a range of 2.2 dB, while on the conventional ground strips, the range was 10.8 dB. This implies that the noise intrusion to nearby residences would vary significantly depending on vehicle. On average, the difference between the quieter mumble strips and the conventional ground strips was 2.3 dB. As would be expected from Figure 8, the on/off increment for Test Car 4 is smaller than the other vehicles on the conventional ground strips and lower than the average increment on the mumble strips.
The ⅓ octave band levels for eight vehicles traveling at 60 mph on the conventional ground strips are shown in Figure 10. These conventional ground strips had a repetition rate of 88 Hz, accounting for the peak in the 100 Hz band; however, some energy was shared with the 80 Hz band also. Five of the eight vehicles clustered around 68.7 dB at 100 Hz, while Test Car 4 was
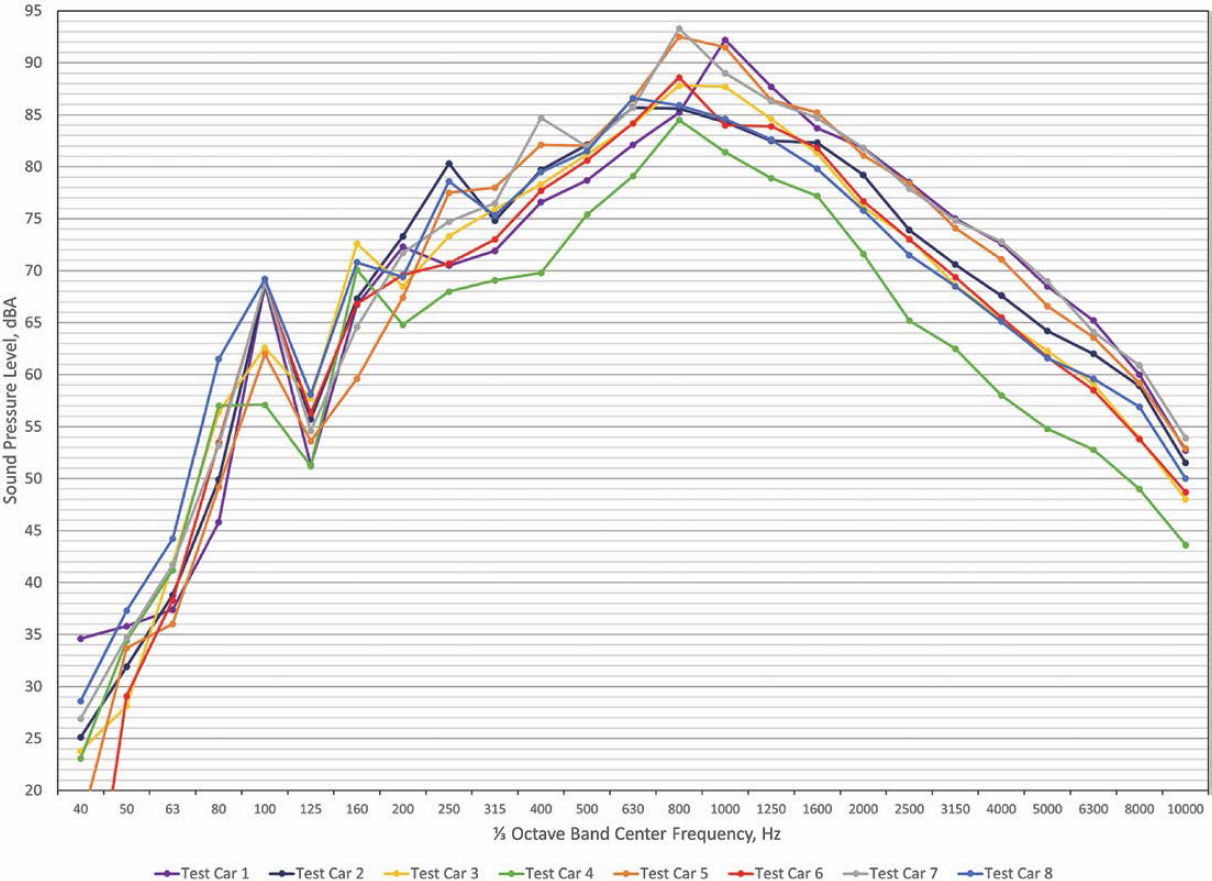
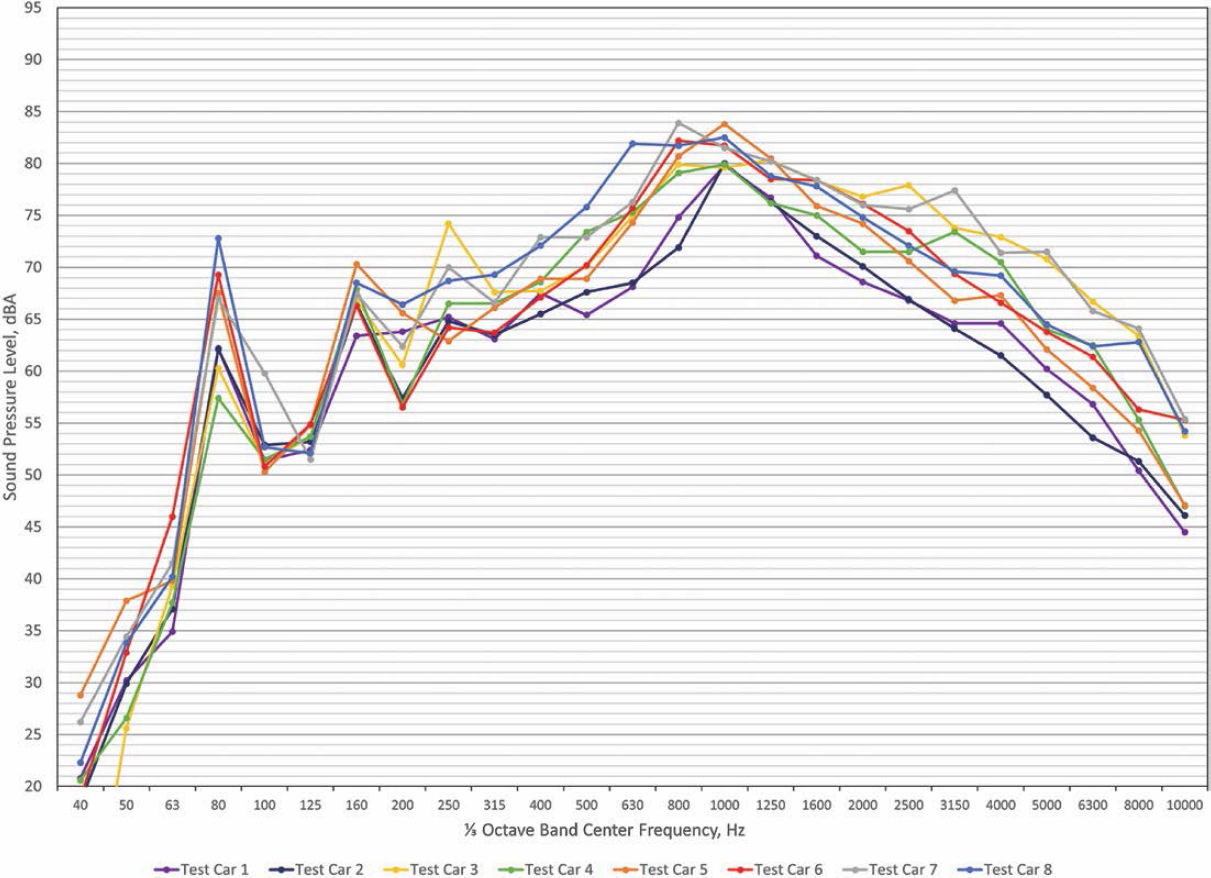
11.6 dB lower, and Test Car 3 and Test Car 5 fell about halfway in between. Above 200 Hz, the spectrum for Test Car 4 was consistently lower than the others, with differences as great as 6 dB consistent with the overall levels of Figure 8. For the mumble strip spectra at 60 mph shown in Figure 11, the repetition rate is 75 Hz, resulting in a more well-defined peak in the 80 Hz band. There was more distinction between the different vehicles at this frequency, with a range of 15.4 dB. Again, Test Car 4 produced the lowest level. At higher frequencies, Test Car 4 was approximately in the middle of the other vehicles. As was the case for the conventional ground strips, the frequencies that contributed most to the overall level were in the range of about 630 to 1,600 Hz. In this frequency range, as a group, the vehicles on the conventional ground strips were about 6 to 7 dB higher.
For six of the eight test vehicles, the same data were collected at 45 mph. That data can be found in Appendix B. Similar to Figure 8, the pass-by level off strips were higher for the pavement of conventional ground rumble strips (see Appendix B). On the mumble strips, the trends at 45 mph were similar to those measured at 60 mph. For the conventional ground strips, the performances of the vehicles were somewhat different than those at 60 mph. The smaller Test Car 1 and Test Car 2 vehicles produce levels that do not stand out as being higher than the others, and Test Car 4 does not produce significantly lower levels than the others.
Interior Noise
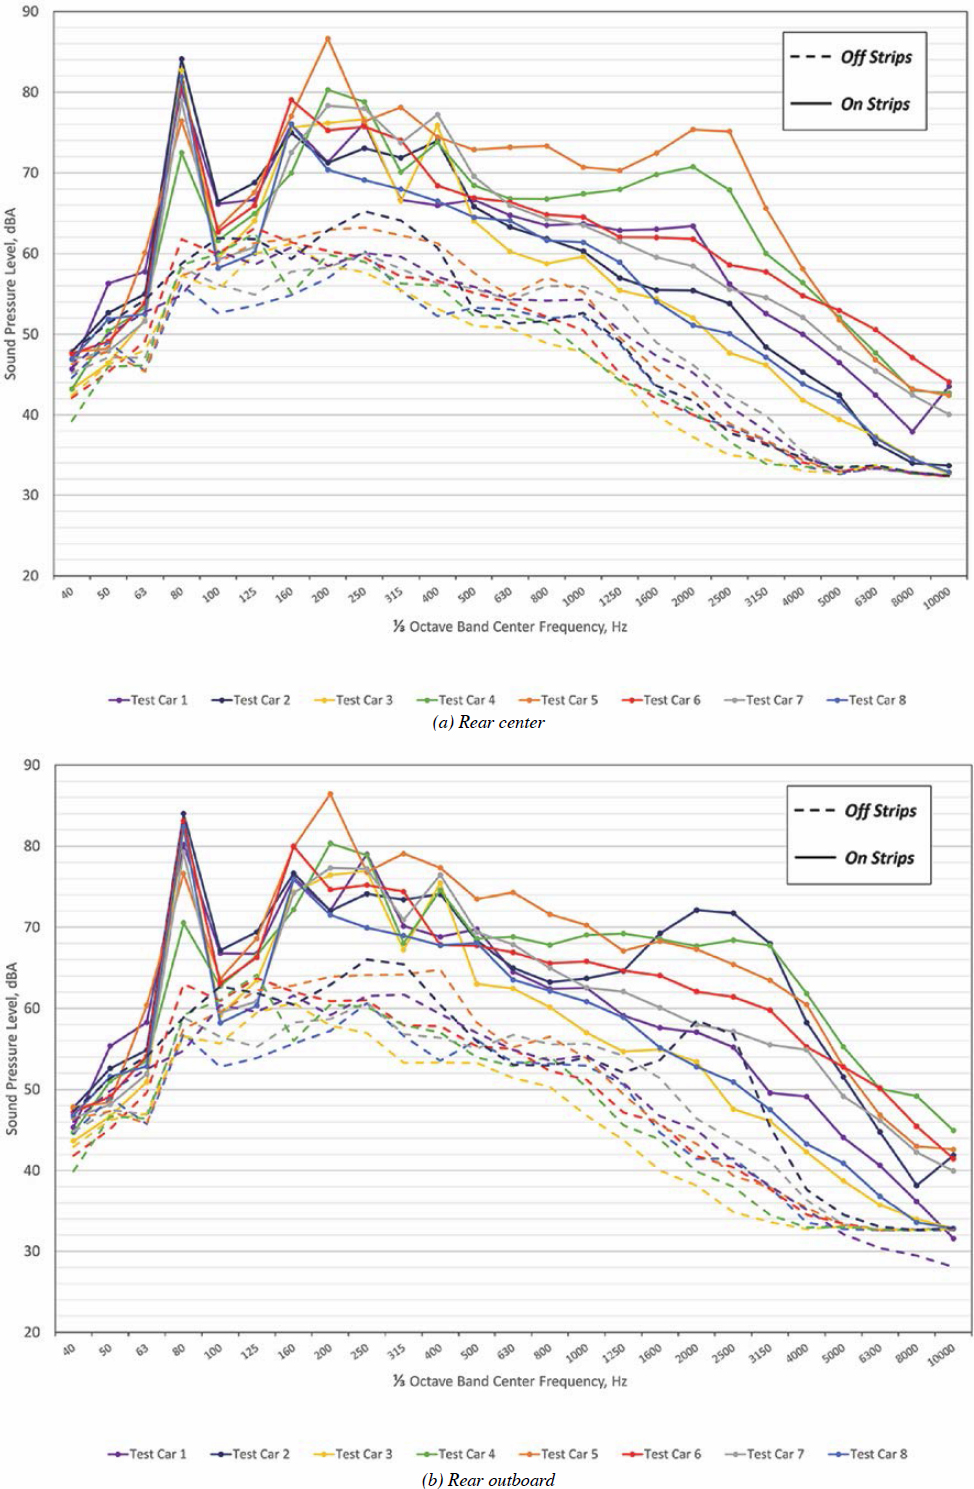
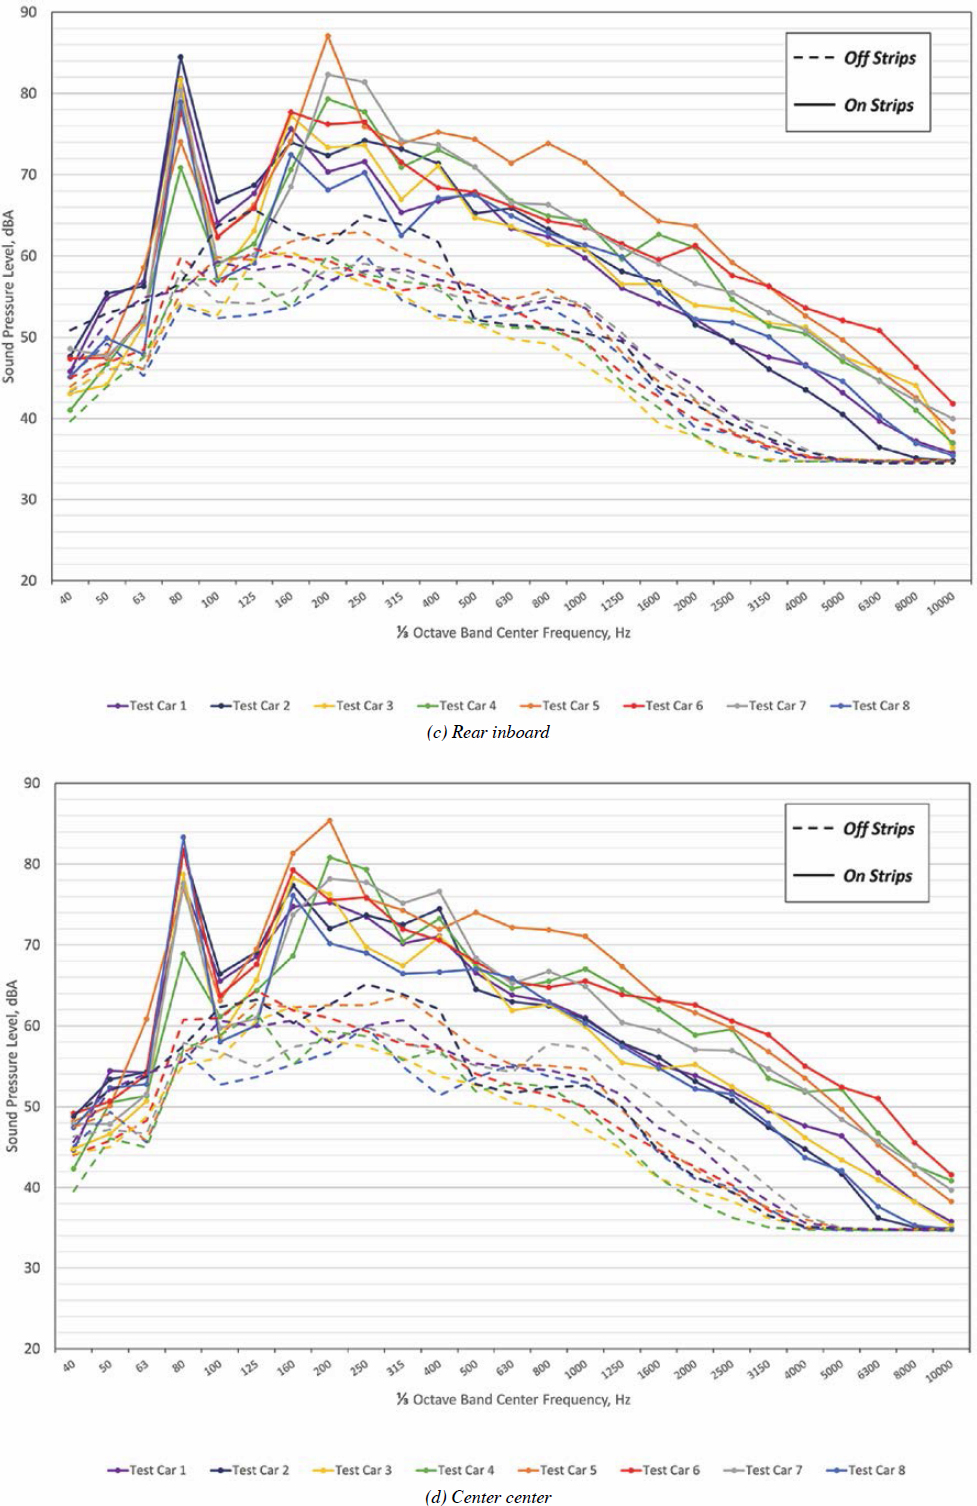
Interior noise was measured at all six locations, five on the unoccupied passenger side and one on the (occupied) driver’s side. The overall levels at 60 mph for the mumble strips and the conventional ground strips are shown in Figures 12 and 13, respectively. In these figures, the black bar corresponds to the average of the six measurement locations.
For both sets of strips, results at the DE location typically show the greatest variation from the average. In some cases, overall levels at the driver’s ear are greater than the average, while some are lower and generally have more variation. This DE microphone is positioned at the driver’s outboard ear and is likely to be strongly influenced by the close proximity of the side glass and the door beltline seal. The levels for the other microphone locations, however, are typically within 3 dB or less of the average. This indicates that the driver’s ear location is not a good indicator of the noise level generally present in the interior space and is not very suitable for a standardized measurement procedure.
The RO and RC positions for Test Car 7 and Test Car 8 also typically give somewhat lower levels than the smaller vehicles. These two positions were found to produce more noise in the
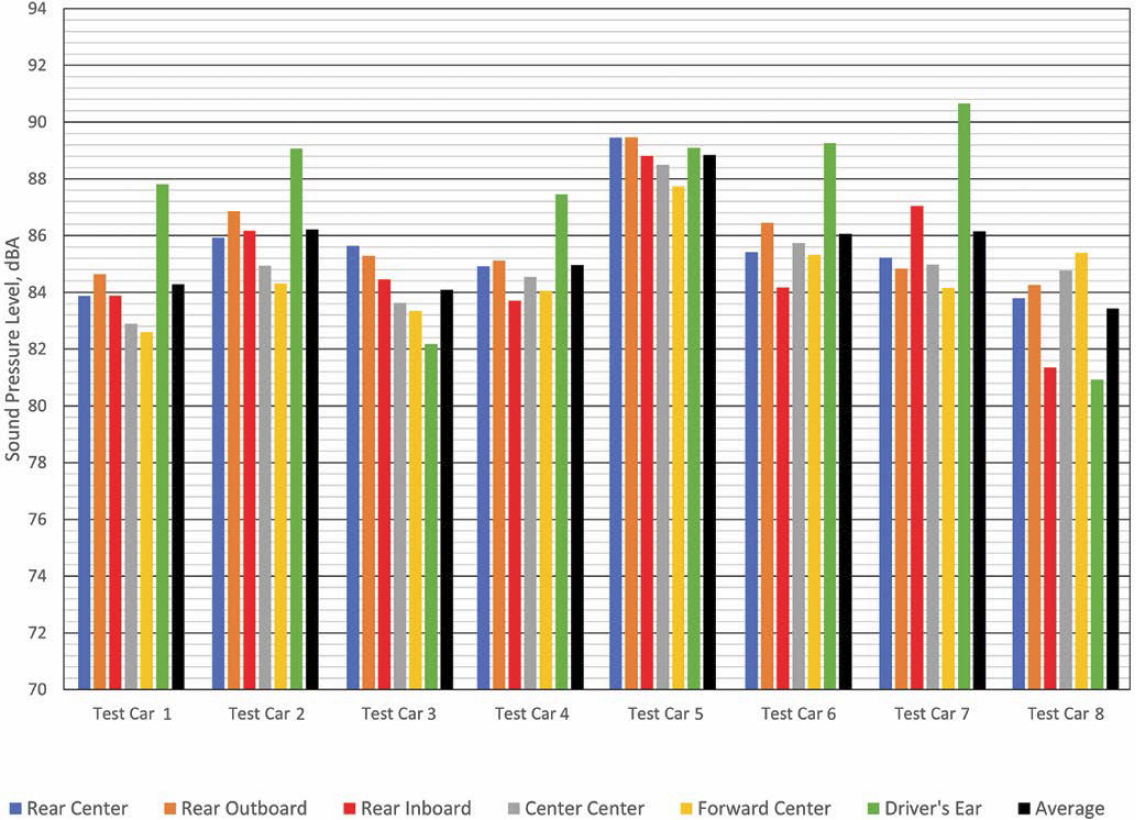
higher frequencies than the other microphone positions, especially for the outboard position, also apparently due to its proximity to the side glass or the door system. The CC and FC positions on the center line of the passenger seat and the RI position produced the most consistent results relative to the average level. Comparing Figures 12 and 13, the levels on the mumble strips tend to be greater than those on conventional ground strips, with the exception of the smaller Test Car 1 and Test Car 2 vehicles. The consistency of the CC and FC positions is also apparent in the on/off increments shown in Figure 14. These positions appear to be most suitable for standard testing. They should be less likely to be influenced by different test vehicle operators and operator seating adjustments.
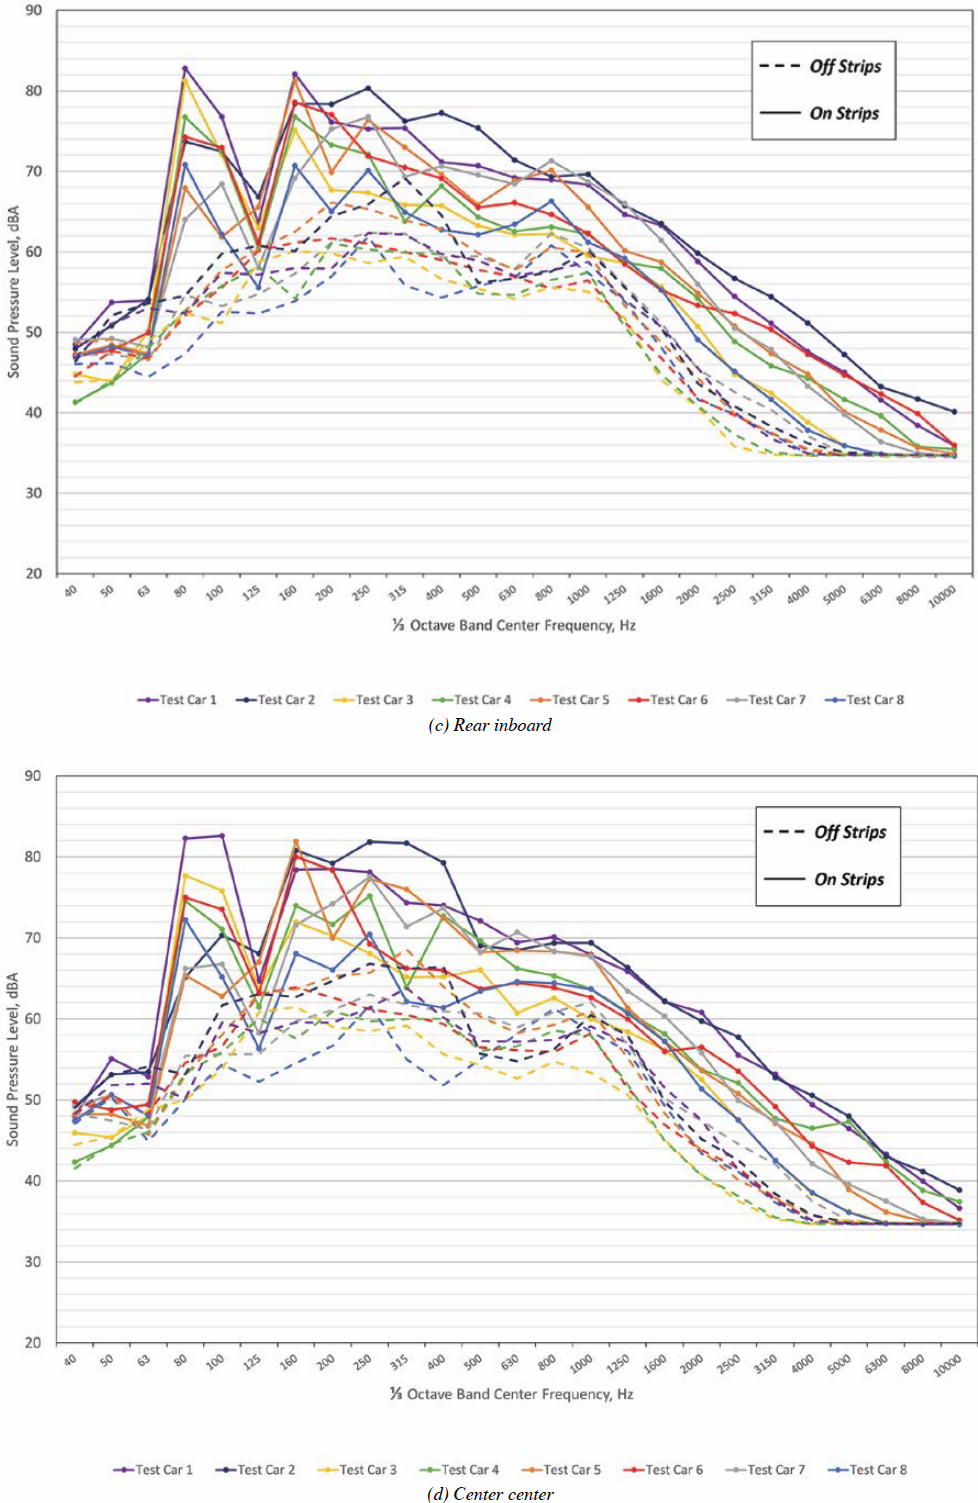
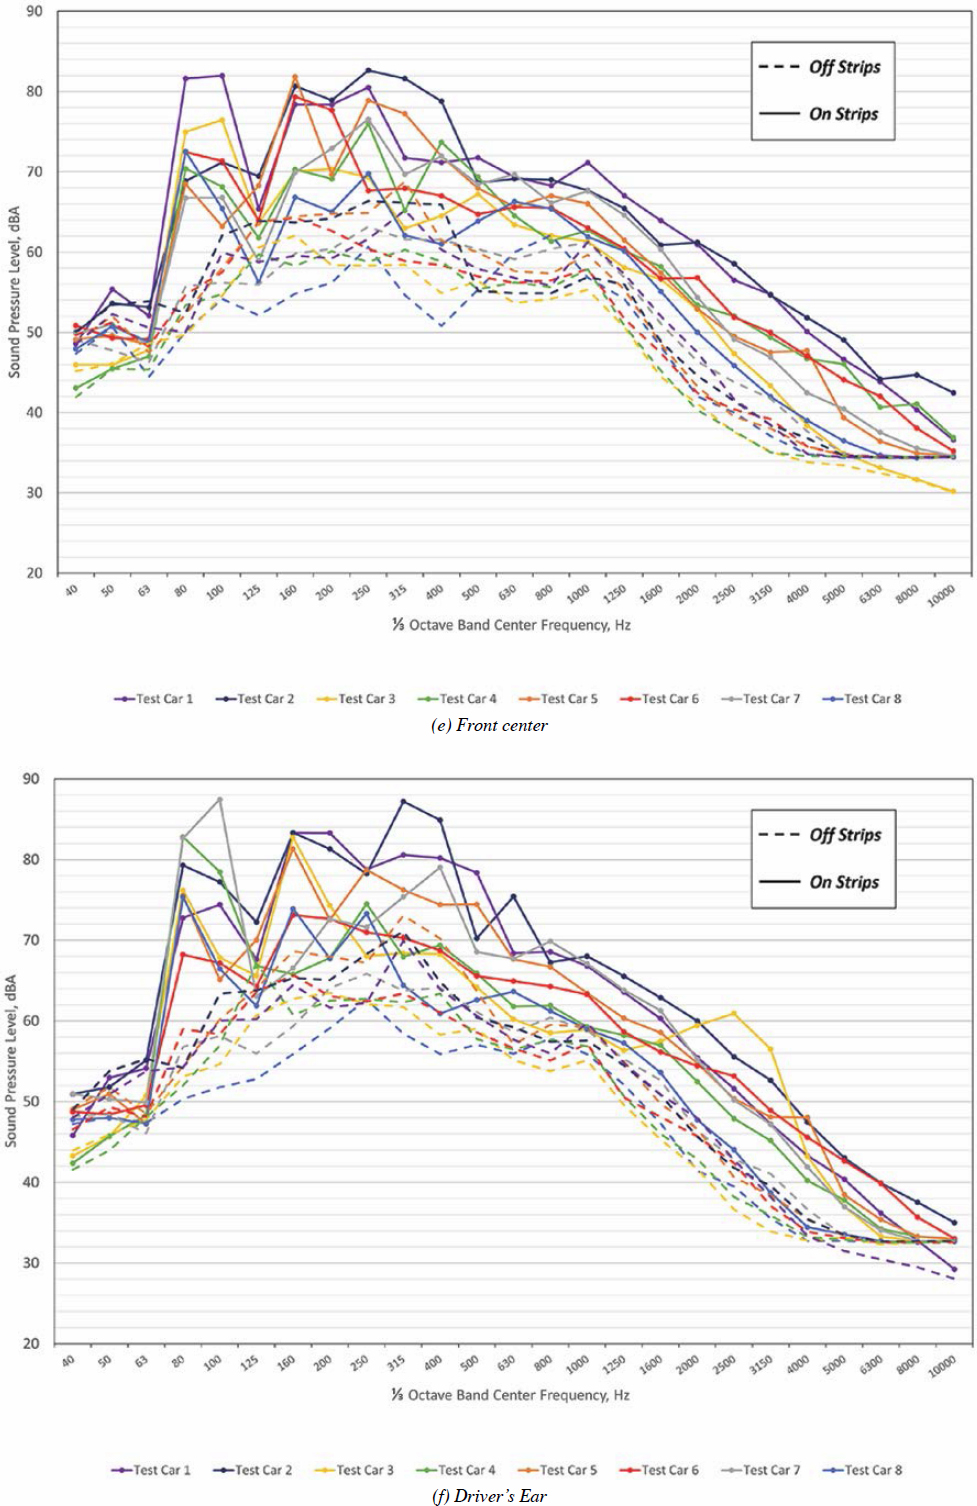
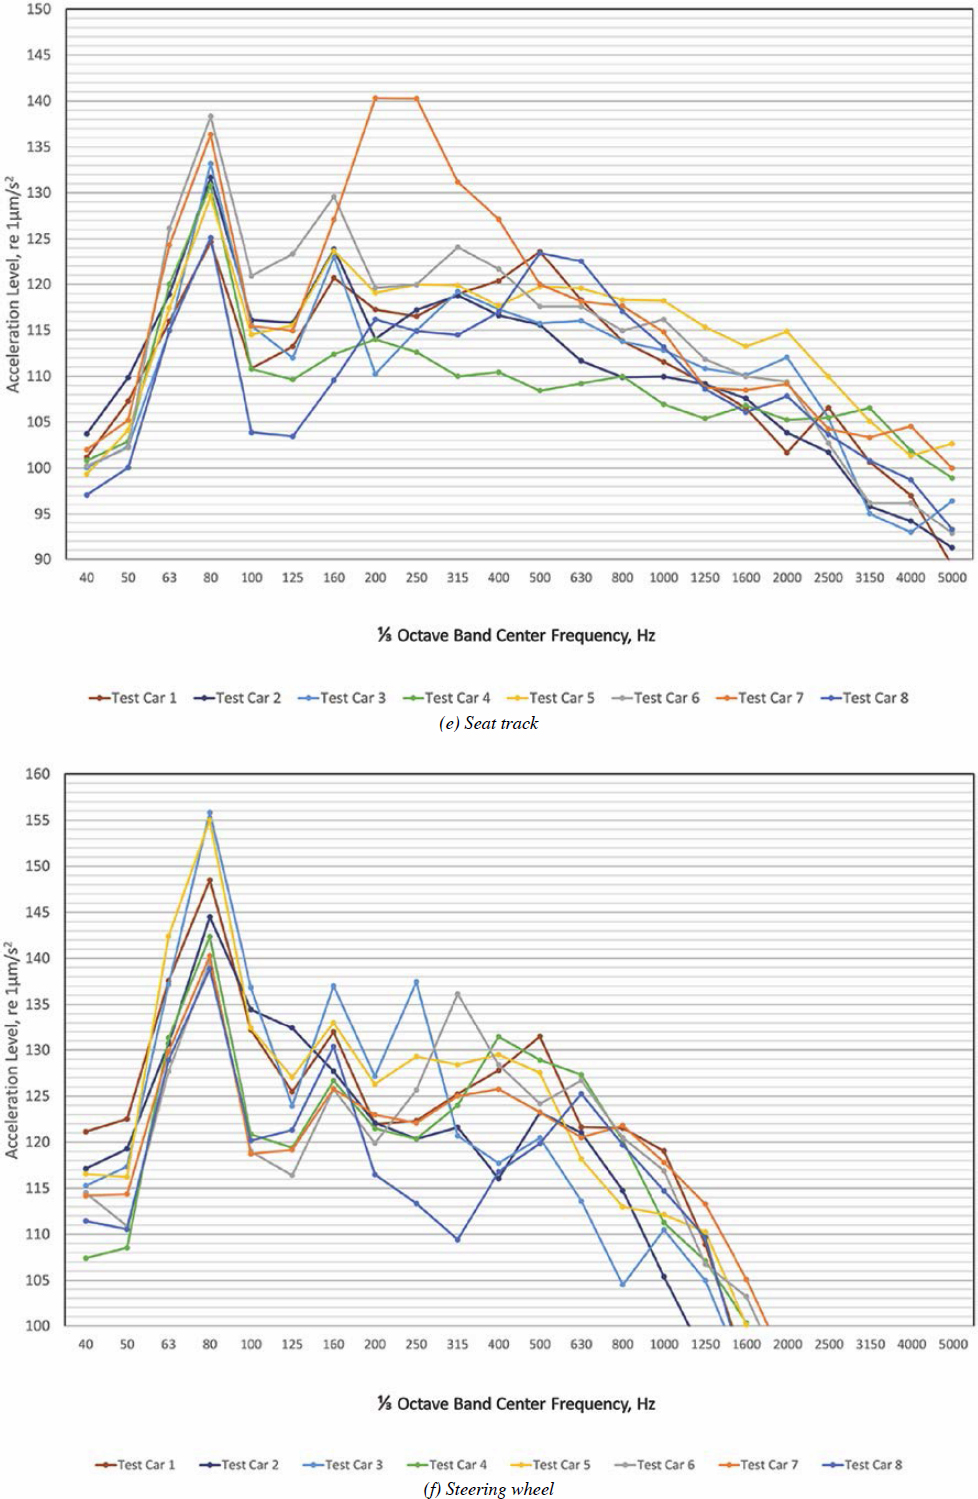
The interior noise spectra for the eight test vehicles and at each microphone location on the rumble strips are shown in Figure 15. As noted regarding the pass-by spectra (Figure 10), the repetition rate of the rumble strips occurs between the 80 and 100 Hz ⅓ octave bands, producing the split indicated in Figure 15. In these frequencies, Test Car 1 typically had levels that were 4 to 18 dB higher than the other vehicles, including Test Car 2, at the passenger seat microphones. The high overall levels for Test Car 2 (Figure 13) are likely due to elevated spectra levels from 160 to 400 Hz, indicating that the causes of the high overall levels for Test Car 1 and Test Car 2 are different. At 80 and 100 Hz, the levels for Test Car 2 are typically lower than Test Car 1 at the passenger microphones. The tire size and wheelbases are identical for these two vehicles;

however, the interior dimensions are different, with the length of Test Car 1 being greater by 5 in. (see Table 1).
The spectra for the vehicles measured on the mumble strips, as shown in Figure 16, generally display smaller differences between the vehicles. At the CC microphone, all vehicles except Test Car 4 display a well-defined peak at 80 Hz, which is the repetition rate of the mumble strips, with a difference between vehicles of about 6 dB. Test Car 4 also shows a peak at 80 Hz, but it is 9 to 15 dB lower than the other vehicles. It was initially considered that this vehicle had an active cancelation system; however, that could not be confirmed. Also, the results on the conventional ground strips (Figure 15) show that Test Car 4’s lower frequency response at the rumble repetition rate falls in between those of all the other vehicles. Starting at 200 Hz and above, Test Car 8 produces levels equal to or lower than the other vehicles at each of the microphones, presumably due to its full-frame construction. It is generally apparent also for Test Car 8 on the conventional ground strips (Figure 15). With regard to the effectiveness of the strips, the levels and spectra for the mumble strips are both higher and more consistent across the range of vehicles than the rumble strips.
Interior noise data collected at 45 mph can be found in Appendix B. For these measurements, Test Car 7 and Test Car 5 were not available from the rental car companies for this testing, and results are only available for the other six vehicles.
Interior Vibration
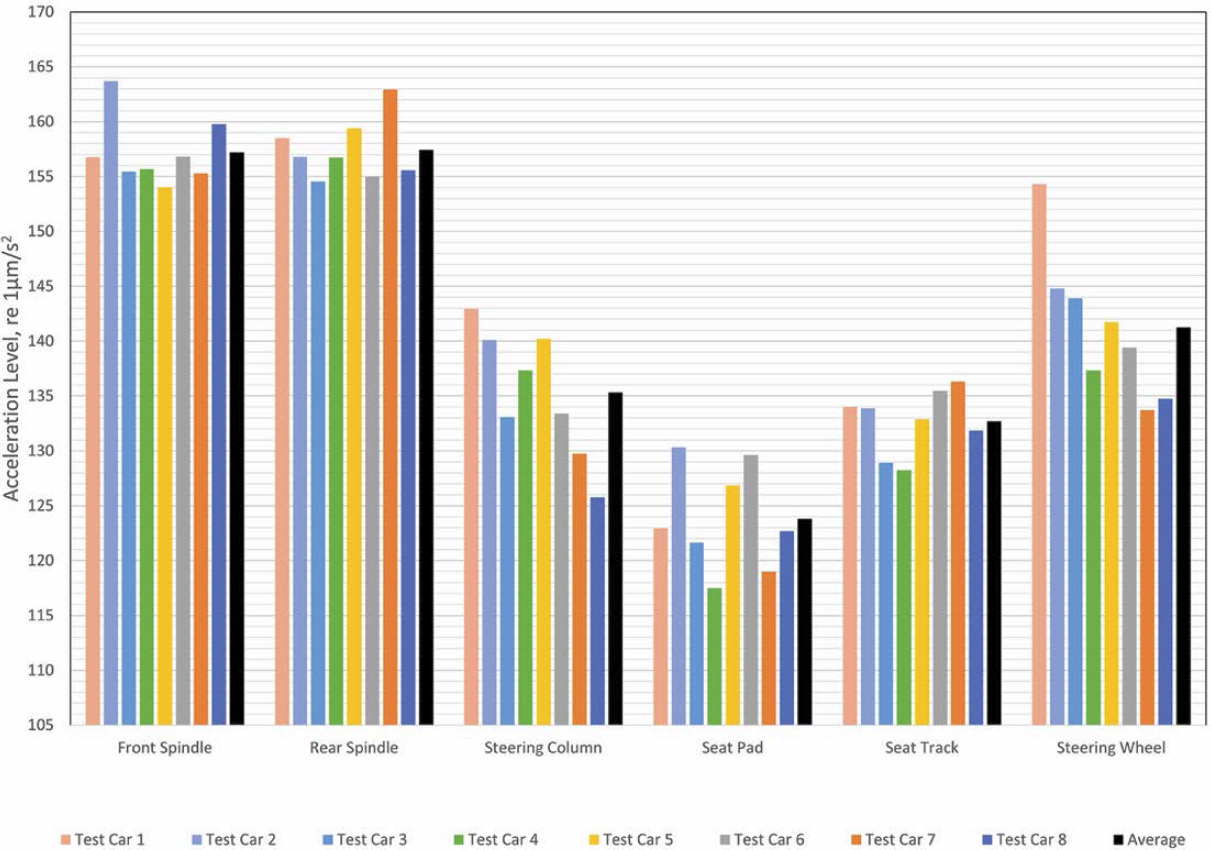
As described previously, the vibration levels were measured in the fore/aft, lateral, and vertical directions at all six locations on the eight test vehicles. For purposes of comparing vehicles and rumble strips, the magnitude of the acceleration vector was calculated by summing the levels for individual directions for each measurement location and each vehicle. The resulting levels and average of vehicles at each location are shown in Figure 17 for the conventional ground strips. On these strips, both the front and rear spindle data showed little variation between vehicles, typically within 5 dB, with the Rio and Caravan producing slightly higher levels. The averages for these two locations are essentially the same. For the other locations, excluding the seat track, there is considerably more variation between vehicles than for the spindle locations. This indicates that while the input at the spindles is relatively consistent, the response at the steering column, steering wheel, and seat pad varied much more from vehicle to vehicle for these strips.
The levels for the mumble strips are shown in Figure 18. On these strips, the seat track location on the mumble strips displays vehicle-to-vehicle variation comparable to the other locations; although, the variation for the in-vehicle levels was generally less than on the rumble strips.


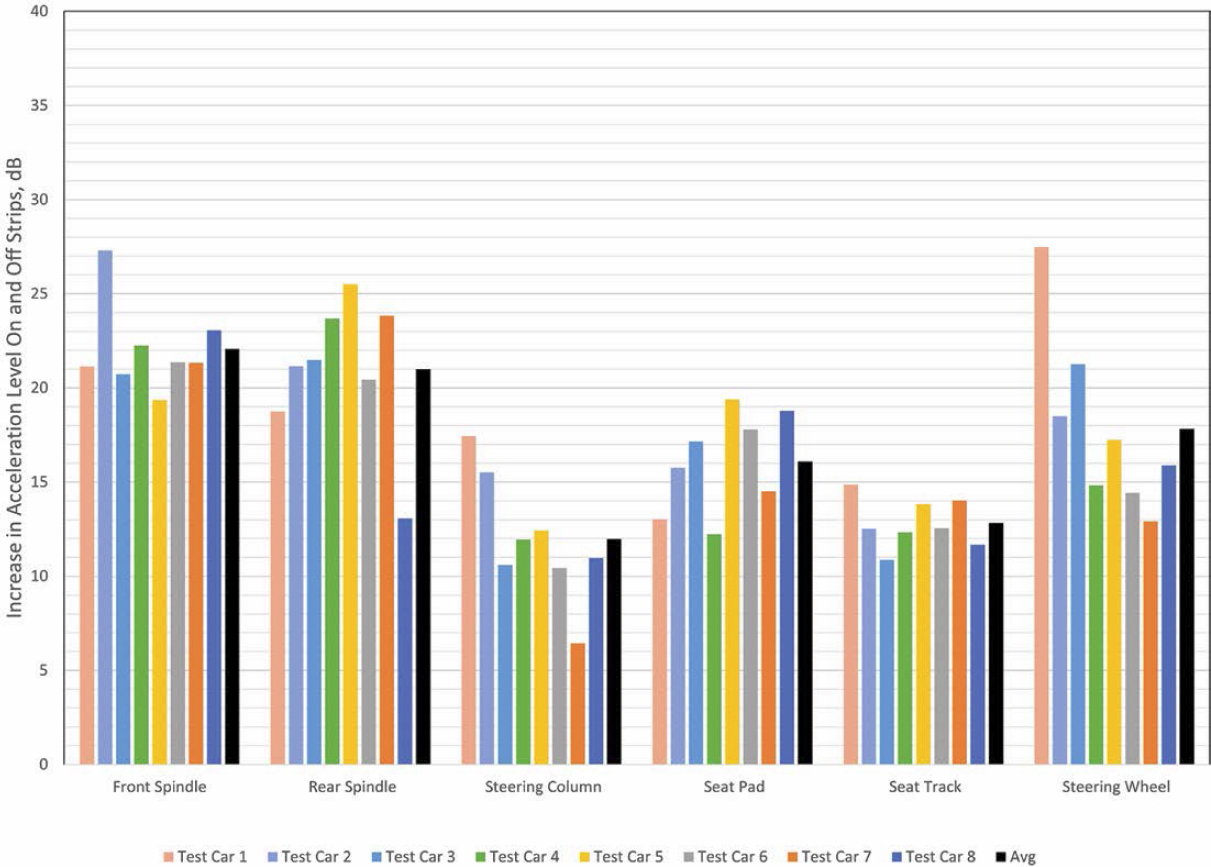
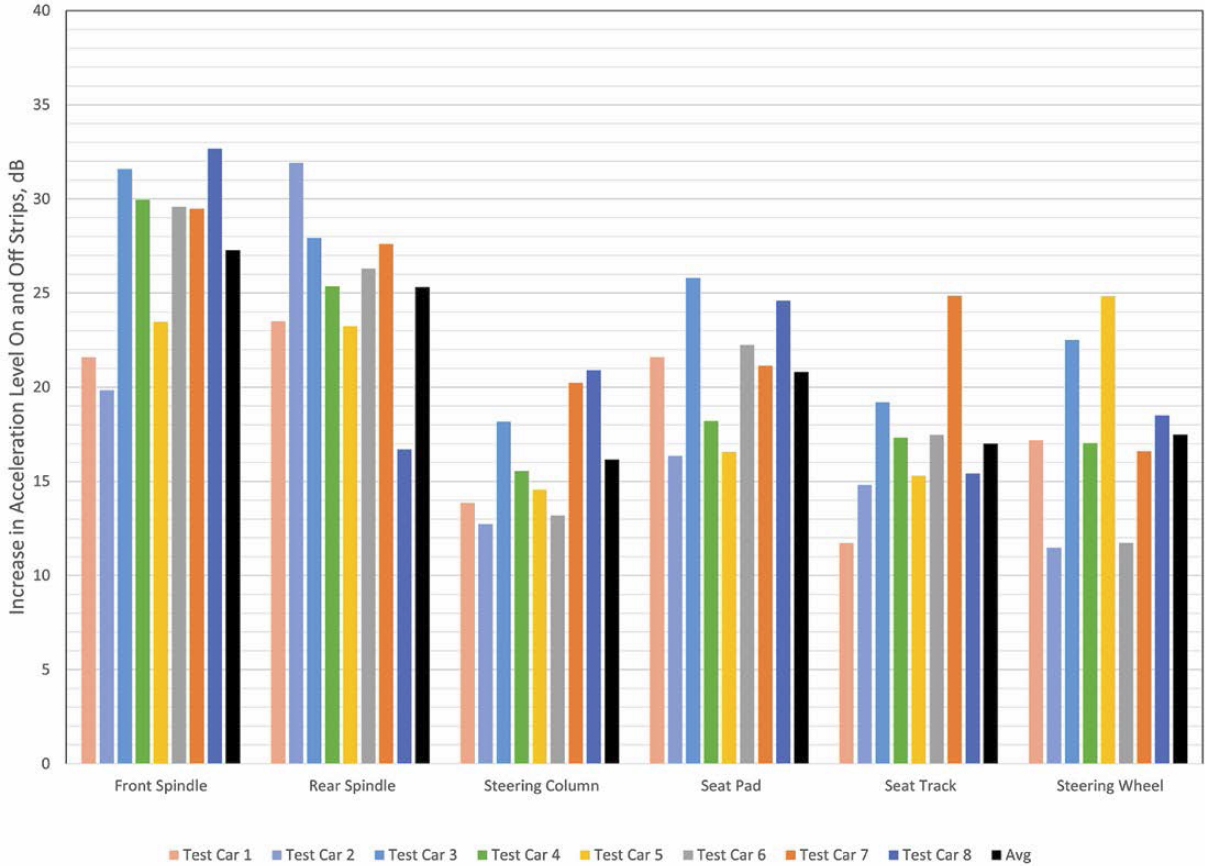
The on/off acceleration level increments are shown in Figure 19 for the conventional ground strips. Similar to the overall levels (Figure 17), the increments for the seat track display the least amount of variation between vehicles. The largest average increments occurred for the two spindle locations, indicating some level of isolation between these inputs and the body response. A notable exception is the steering wheel location for the Versa where the increment was 6 to 9 dB greater than the spindle response. In Figure 20, the increments measured on the mumble strips show a similar difference in the average vehicle response across the measurement locations; however, the average increments are greater than those measured at the conventional ground strips (Figure 19), which indicates that the mumble strips provide more input to the vehicle operator warning of a lane departure.
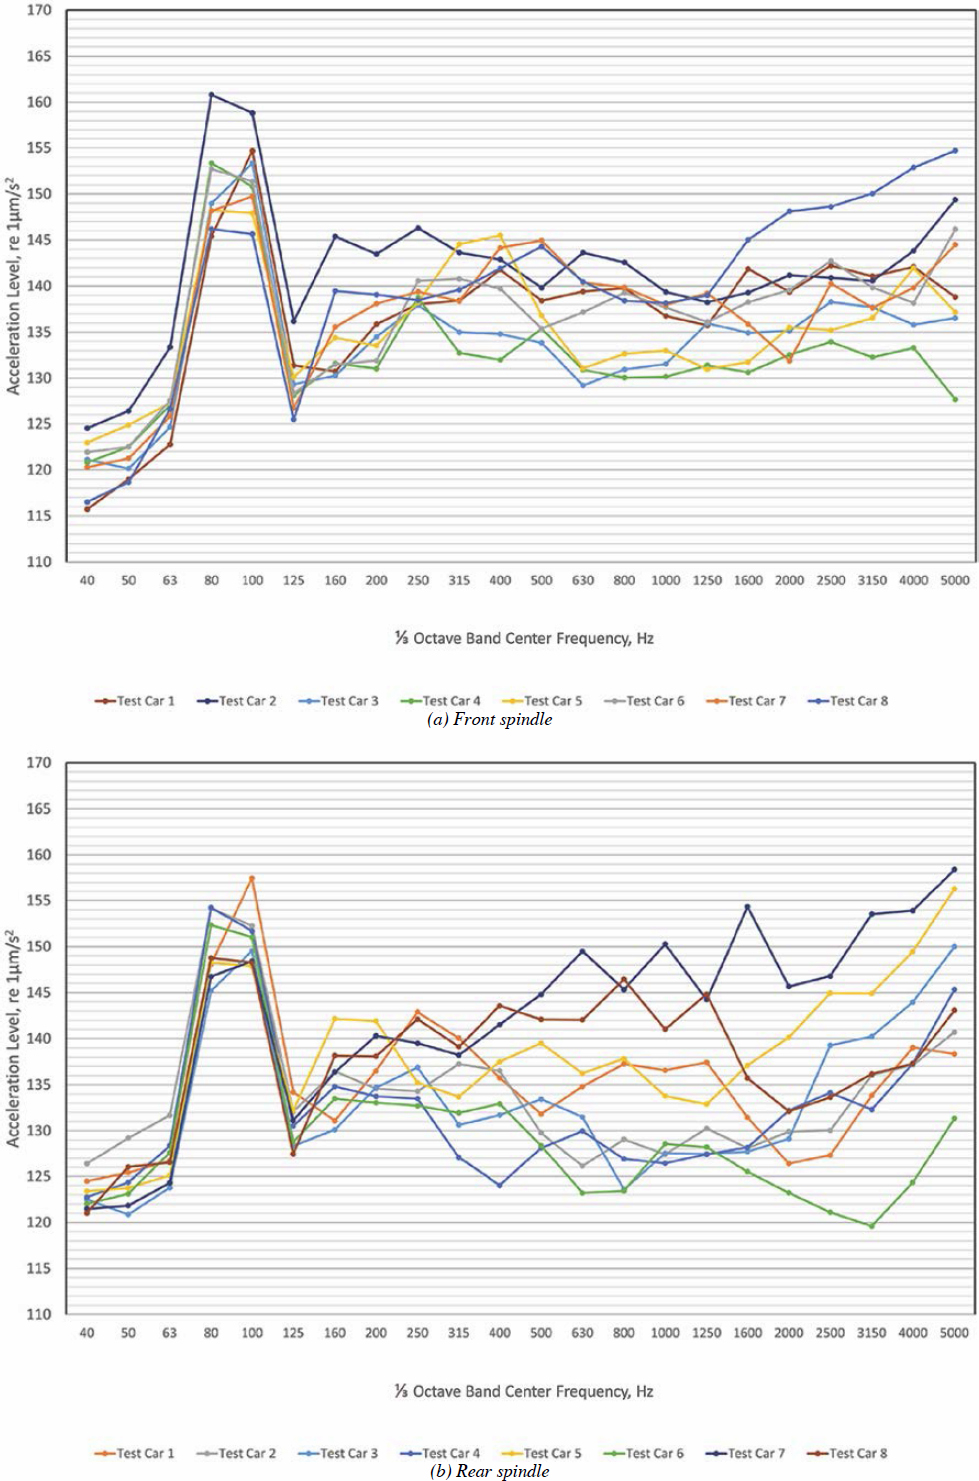
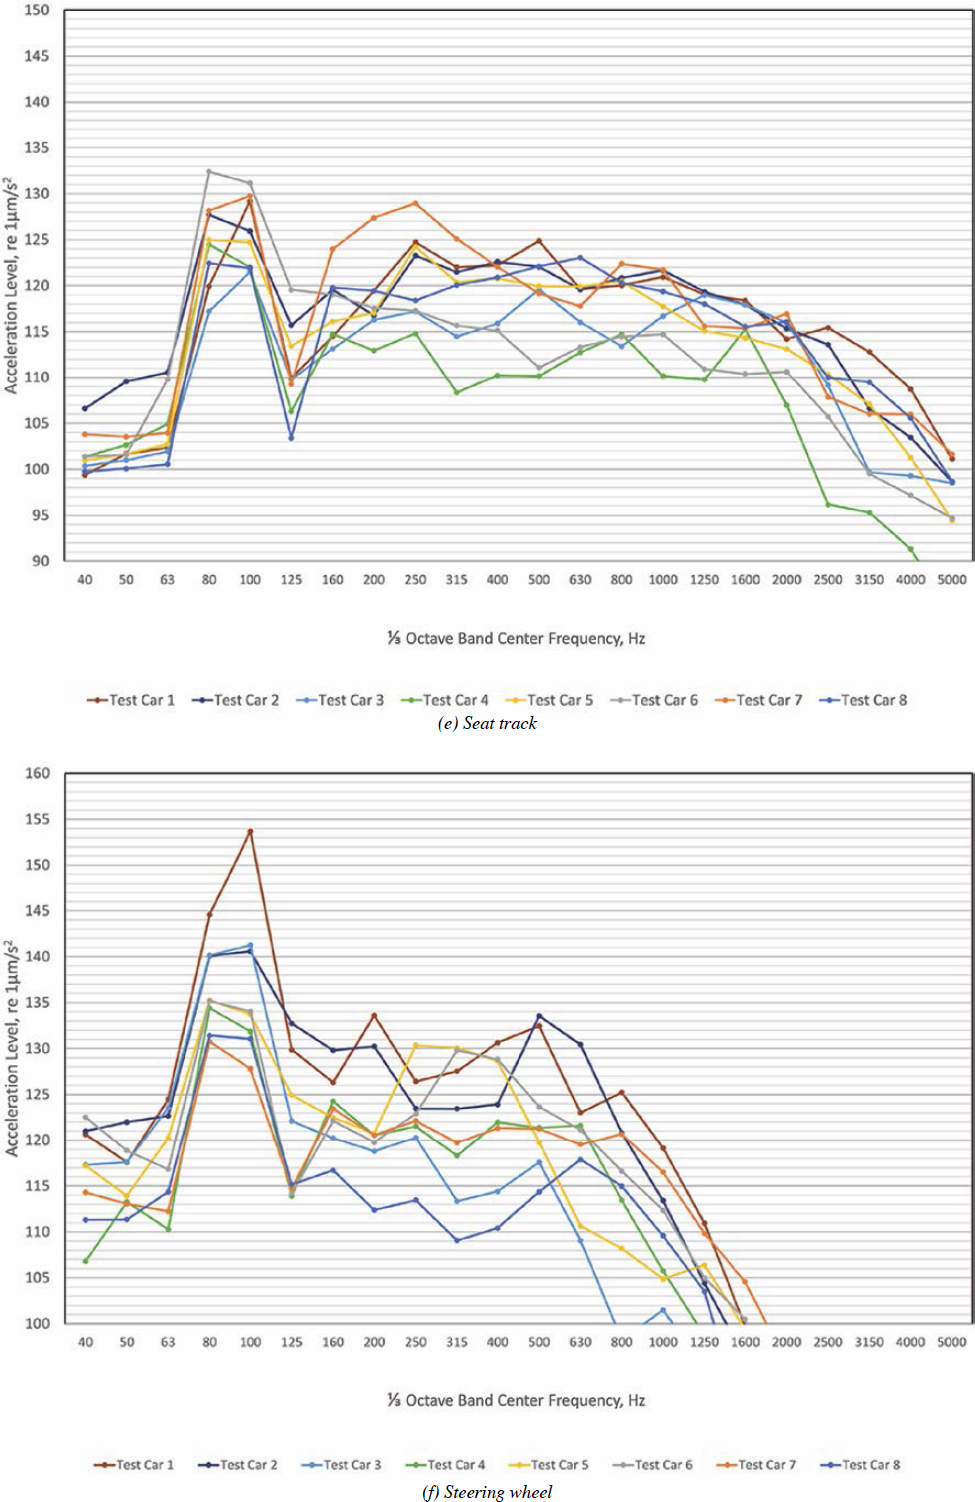
The ⅓ octave band acceleration levels for the test vehicles on the conventional ground strips are shown in Figure 21. As would be expected from the interior noise spectra (Figure 15), the levels between 80 and 100 Hz corresponding to the conventional ground strip repetition rate are prominent in the spectra for each of the measurement locations. The steering column and steering wheel display the largest variation among the vehicles, with a range of about 20 dB or more for the levels at 100 Hz. This may be due to subsystem response, which likely varies from vehicle to vehicle. The spindle accelerations display a more limited range of response at 80 and

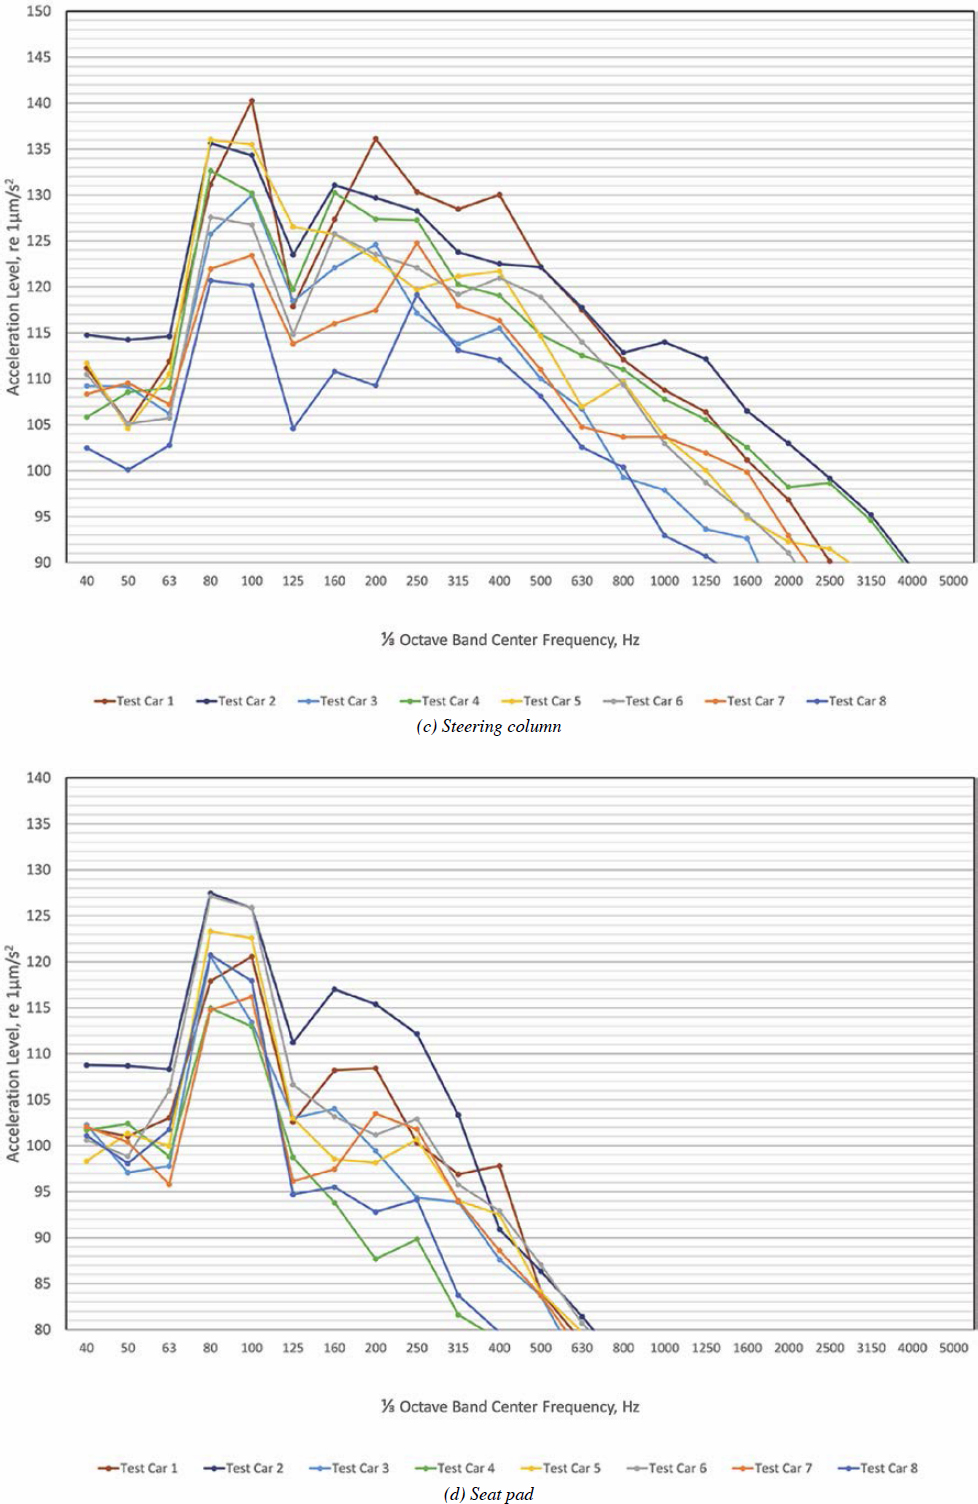
100 Hz; however, they also show greater high-frequency content, which could be due to nonlinear effects such as rattling. For the interior acceleration locations, the range in level between the vehicles is similar to that noted in Figure 14. For the seat pad location, the spectra drops very rapidly in level above about 200 Hz, which is likely due to the isolating effect of the seat assembly as the transducer itself has a relatively flat response up to at least 1,000 Hz.
The acceleration spectra measured on the mumble strips are shown in Figure 22. For all locations, the spectra are dominated by the 80 Hz repetition rate of the strips. Unlike the noise data of Figure 16, the Camry does not produce lower levels than the rest of the vehicles at 80 Hz. The results for the steering column and wheel locations indicate the influence of subsystem modes with more spectral peaks above 80 Hz than those apparent in the seat track results. At 160 Hz, the peak may be due to it being the second harmonic of the mumble strip repetition rate. However, peaks above 160 Hz appear to be more unique to the steering system. The seat track results for the Caravan at 200 and 250 Hz are also unique to that vehicle, being 20 dB higher than any of the other vehicles. On the rumble strips, elevated levels also occur for the Caravan seat track location, however, not as prominently.
Appendix B shows the results of vehicle vibration measurements at 45 mph.


Preliminary Test Procedure Suggestions
Before settling on the suggested test procedure and the types of vehicles to be proposed, concern was expressed that a full-size pickup truck was not included in procedure development testing. Full-size trucks have an appreciated share of the market and there was concern that they may possess unique characteristics relative to the response of rumble strips compared to the full-size SUV used in the procedure development. Full-size SUVs and full-size pickup trucks typically have full frames not integrated into the body structure and are separated by another level of isolation from road input. To demonstrate the equivalence of these full-frame vehicle configurations, an additional vehicle was tested using the strips and procedures included in the testing of the initial eight vehicles. This evaluation concluded that compared to the averages of other larger vehicles, the vehicles appear to be interchangeable and would not necessarily affect the evaluation of different rumble strip designs. The report on this additional testing is documented in Appendix B.
Test Vehicles
For pass-by, interior noise, and vehicle vibration, the test vehicle was found to be a large source of variation in documenting the performance of the strips. This would make it difficult to compare the results of one study to another for the purpose of evaluating the rumble strip performance. One solution is to specify test vehicles; however, this becomes impractical to implement across state DOTs and other researchers. Therefore, more than one vehicle type is suggested due to the variation in vehicle designs. In this research, vehicles were selected to include those of different categories: (1) smaller compact vehicles, (2) medium-size unibody SUVs, (3) sedans, and (4) larger full-frame vehicles that typically have more road isolation. SUVs and sedans, which are both medium-sized vehicles, were separated due to typical differences in interior volume and fore/aft dimension. The results of the study were grouped into these four categories. An example of this grouping is shown in Figure 23 for the interior noise positions at 60 mph. Just like the vehicles themselves, the vehicle pairings display variation. For application, it is suggested to use the average of vehicles from all the groupings to assess the performance of rumble strip designs. It should be noted that subsequent testing (Appendix B) demonstrated that a full-frame full-size pickup truck could be substituted by a full-frame, large SUV or van.
Pass-by Measurements
Pass-by measurements are suggested to be performed following the AASHTO TP 98 for data acquisition regarding microphone placement, site restrictions, and requirements defining “clean” pass-by events. For shoulder rumble strips, the off-strip measurements are performed as specified at a distance of 25 feet from the center of the lane of travel. For the on-strips measurements at the shoulder, the microphone is moved away from the lane of vehicle travel, such that the 25-ft distance is maintained. Subsequent measurements of centerline rumble strips used further modification, where the vehicle was operated on and off the rumble strips in the opposite direction, with the driver’s side of the vehicle toward the pass-by microphone(s). As a result, the microphone position is moved closer to the road to maintain the 25-ft separation to the center line of vehicle travel. In some cases, this may not be practical, however. The distance to the center line of vehicle travel may need to be increased for both the on and off measurements.
Interior Noise Measurements
For interior noise, some differences in overall level on/off increments were found for different microphone positions across the different test vehicles. Relative to the average of the increments
for all positions, the DE position stood out as having some of the largest deviations from the average. Further, the use of this position may depend on the individual operator and their seat adjustment position. The noise at this location may also be influenced by the close proximity to the side glass and door belt seal. Regarding the spectra, several positions had unusually high levels in the frequency bands above 1,250 Hz. This was particularly apparent in the RO position on both the mumble and conventional ground strips. For the RC position, this was only pronounced for the mumble strips. Some variation was also noted in the spectra around the frequencies of the mumble and conventional ground strip repetition rates and their harmonics, which were attributable to the interior cavity modes. As far as microphone setup, positions along the centerline of seat travel are typically easiest to define in the vehicle. Positioning the microphone at the CC location (primary) or the FC location (secondary) produced similar results.
Vehicle Vibration
For vehicle vibration measurements, spindle locations generally provided the most consistent levels across the eight test vehicles. However, these levels did not necessarily correlate to responses that the operator would perceive at the interior interface points. These responses also varied significantly among the test vehicles. The steering column, steering wheel, and seat are vehicle subsystems, which have their own response, somewhat independent from the input created by the rumble strips. As a result, their relative response can vary considerably from vehicle to vehicle for these subsystems. While the subsystems, such as the steering wheel, may be indicative of the vibrational inputs that the operator experiences in a specific vehicle, they do
not necessarily provide a consistent characterization of the input from the rumble strips across different vehicles. Unlike the subsystems, the seat track location provides a clearer indication of the energy in the structure that can excite the subsystems. The vibration of subsystems will be modified by their individual vibration modes, confounding the evaluation of the input from the strips. As a result, the seat track location provides a more consistent measure of the ability of the rumble strip design to alert the operator. The suggested interior vibration monitoring locations would be the seat track (primary) and the steering column (secondary).
Suggested OBSI
The pavements at both test sites in California were dense grade asphalt concrete (DGAC) of varying ages, with the pavement at the mumble strip site being fairly new and at the conventional ground rumble strip site being older. The difference in OBSI levels was 5.4 dB between these pavements with the newer DGAC being quieter. This difference in OBSI level will produce equivalently higher off-rumble strip pass-by levels, which can influence the on/off-strip increment (Donavan and Lodico 2009). This was an important factor during subsequent testing of the strips measured, as discussed in Chapters 3 and 4. For this reason, OBSI testing in accordance with the AASHTO Standard Method of Test T 360 is suggested as part of the test procedure (AASHTO 2016).


