Developing a Guide for On-Bridge Stormwater Treatment Practices (2024)
Chapter: Appendix C: Task 3 Laboratory Report 1: Permeability and Clogging Study
TABLE OF CONTENTS
2. Filtration Media Procurement
TABLE OF FIGURES
Figure 3 Stratification of Filtration Media
Figure 4 Hazardous Material Trap on Loop 360 in Austin, TX
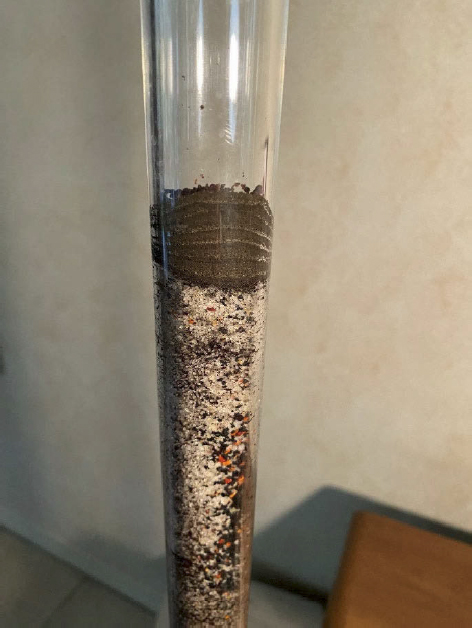
Figure 5 HMT Sediment in Water
Figure 6 Falling Head Permeameter
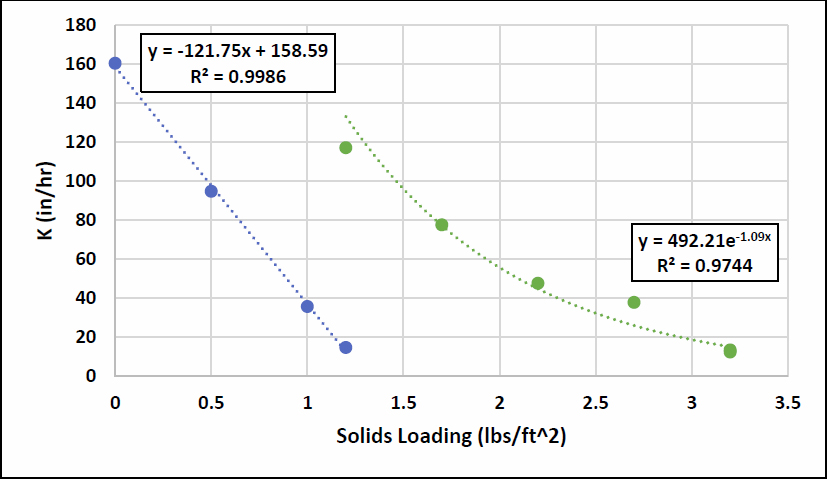
Figure 7 Permeability as a Function of Solids Loading for Run 1
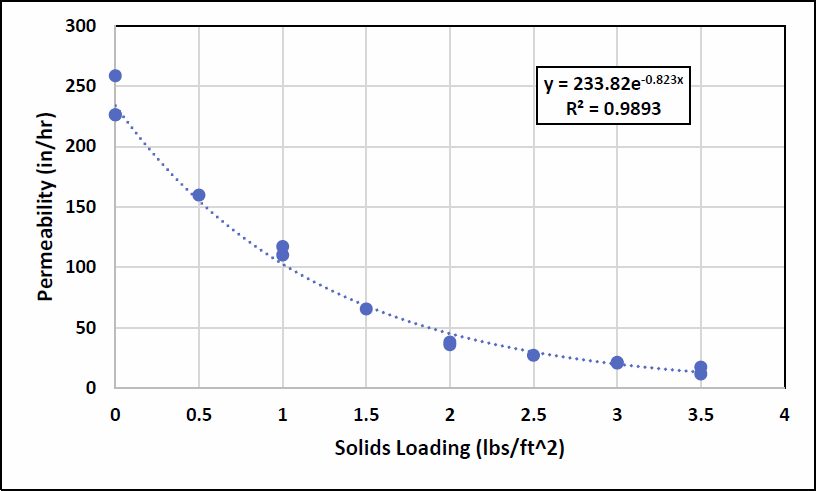
Figure 8 Permeability as a Function of Solids Loading for Run 2
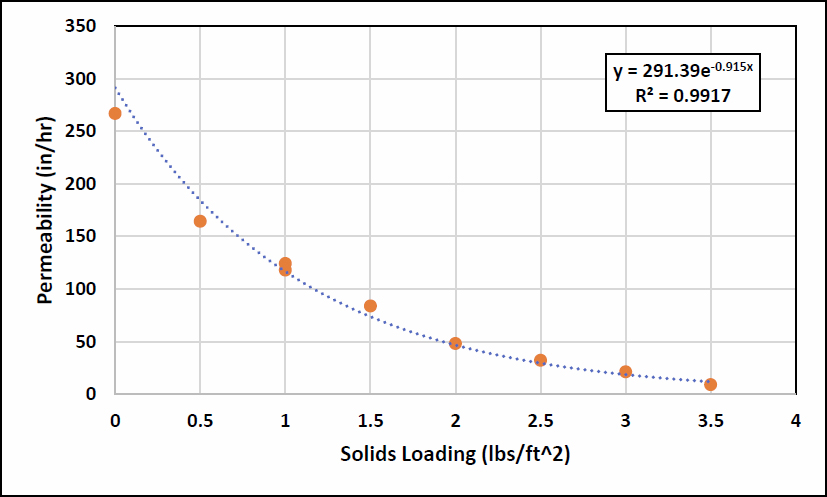
Figure 9 Permeability as a Function of Solids Loading for Run 3
Figure 10 Combined Run 2 and Run 3 Data
1. Introduction
The permeability and clogging tests provide guidelines with respect to maintenance frequency. The experimental approach involved running a series of falling head, rigid wall hydraulic conductivity tests with sequential additions of stormwater solids. Changes in permeability with addition of the solids was used to determine the relationship between solids loading and permeability (K). Permeameter cells were set up for the selected media blend and the effective hydraulic conductivity was determined. After the measurement, a defined mass of stormwater solids was loaded in the permeameter with the media and the permeability was re-measured. This procedure was repeated until the filtration rate fell below 25 inches/hr, which allowed us to determine the relationship between solids loading and hydraulic conductivity. The test was run in triplicate for the selected media.
2. Filtration Media Procurement
Interim Report I described a recommended filtration media for testing. Geosyntec sourced the recommended filtration media from Walrath Landscape Supply company in Tacoma, Washington. The mix was customized to meet the needs of this project with respect gradation and composition. The mix consistent of the following components by volume:
- Sand (60%) – Lane Mountain 20/30 Silica Sand. This sand product has a tight particle size distribution, with particulates mostly retained on the #20 (0.85 mm) and #30 (0.6 mm) sieves. It is substantially coarser than typical bioretention sand. It is commonly used in golf course sand traps and aquarium filters. It is sourced from Eastern Washington. Similar sand products are believed to be available from specialty suppliers around the country, as driven by the golf course and water filtration industries. Due to its relatively large percentage by volume and its higher unit weight than coconut coir or granular activated carbon, this component would be the most important to source locally in order to reduce shipping costs.
- Coconut Coir Pith (20%) – Botanicare Cocogro (owned by ScottsMiracle-Gro, Inc.). To our knowledge, this is the most common commercially available coconut coir pith. It can be purchased in bales from ecommerce sites. The raw material is sourced from Sri Lanka and freshwater processed in the US. This product has been commonly used in alternative media blends in Washington State.
- Granular Activated Carbon (15%) – Carbon Activated Corporation COL-L 60 Coal Base Reagglomorated Activated Carbon. This product is designed for water purification. This is the primary GAC stocked by Walrath for stormwater treatment applications. It has an 8x30 gradation, meaning it primarily contains particles passing the #8 (2.36 mm) sieve and retained on the #30 (0.6 mm) sieve. Carbon Activated Corp has facilities in Texas, New York, Florida, Arizona, and Canada as well as operations in other countries. Products can be shipped throughout the country.
- Activated Alumina (5%) - Axens Solutions ActiGuard AAFS50. This product is an iron enhanced activated alumina. It has a gradation of 0.5 to 2.5 mm (similar to 8x30, but not
identical). This product has been used in pilot media in Western WA. Axens is a worldwide company and ships products throughout the country.
Approximately 8 gallons of mixed material was produced for this project. It was blended by shaking in buckets. At a larger scale, Walrath would use commercial blending methods such as a pug mill to thoroughly blend the materials. Blended media could be produced and delivered by truck in bulk or shipped in 1 cubic yard supersacks by truck or rail. Figure 1 shows pictures of each product, individually. Figure 2 shows the blended media.


3. Permeameter Packing
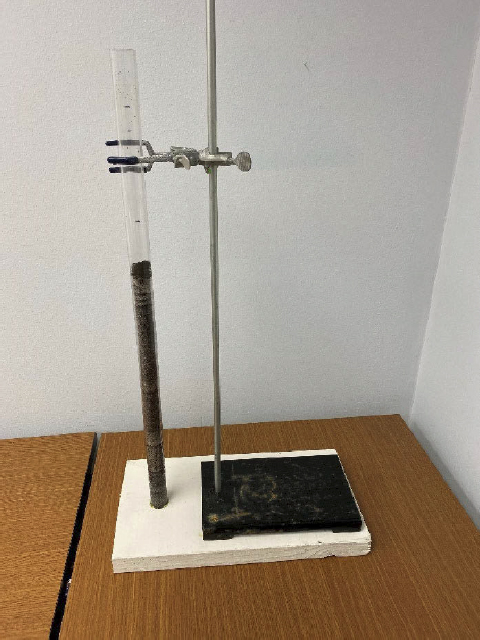
A falling head permeameter was constructed using clear plastic tubing with an internal diameter of 1.0 inches. The length of the permeameter was 30 inches to provide space for 18 inches of media
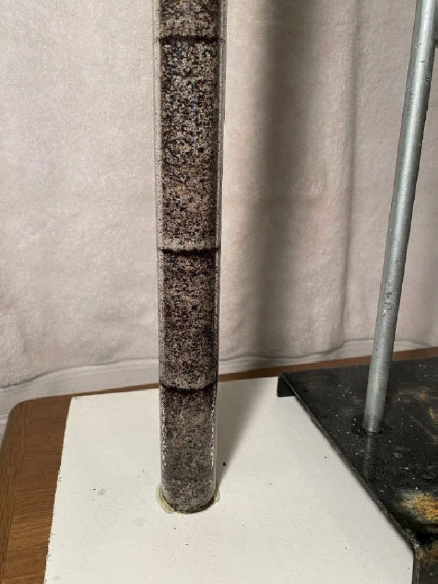
topped with 8 inches of water. Dropping the media through the air from about one foot or less above the base produced a density stratification in the material with the less dense components forming a dark band at the top of each lift as shown in Figure 3
4. Sediment Addition
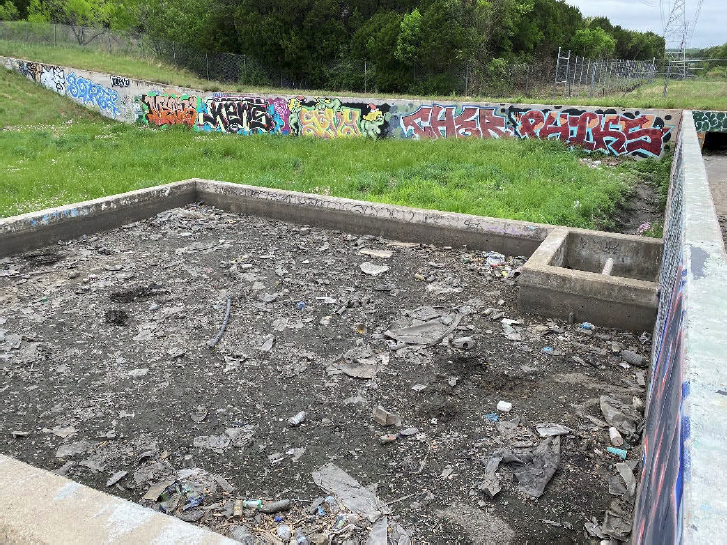
Stormwater solids were collected from the bottom of a hazardous material trap (HMT) located in a best management practice (BMP) exclusively receiving highway runoff from Loop 360 in Austin, TX (Figure 4). The HMT is an 8,000 gallon basin that captures the first flush of runoff and retains it until maintenance staff drains it. Its purpose is to capture spills (when not raining), but to the research team’s knowledge, there has not been a spill at that location. The material collected from the HMP was dried and then passed through a 210 μm sieve to remove the larger material (pieces of glass, leaves, and other debris) as well as sand particles large enough to be retained in a pretreatment basin.
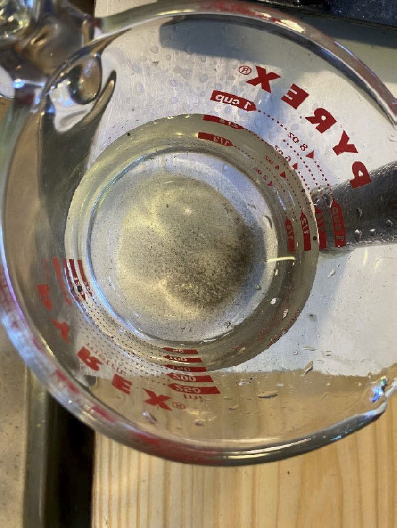
When the sieved solids were dispersed in water they appeared to be extremely hydrophobic and tended to clump together and float on the surface for as long as overnight. A substantial amount of stirring and agitation was required to fully disperse the solids and have them sink to the bottom. Figure 5 shows the solids mostly on the bottom of a Pyrex container with virtually no impact on turbidity. This means that the solids collected from the HMT do not include much of the clay fraction that may have been present in the original runoff. Consequently, the sediment added to the permeameter was primarily silt sized material. The water also did not show any oil or grease sheen when the sediment was added.
5. Permeability Measurements
Typically, it is the permeability under fully saturated conditions that is of interest and displacing all of the air in the media requires operating the permeameter in an upflow mode (water introduced at the bottom). In this case we are operating in a downflow mode, which is more representative of the configuration of the BMP and allows the addition of solids to determine clogging rate. Consequently, these experiments determine the effective permeability we would expect to observe in the field.
Permeability is calculated in a falling head permeameter according to the following formula:
Where:
K = Permeability
a = Inside area of the standpipe
L = Length of the sample (18 inches)
A = Area of the specimen
t = Elapsed time of test
h1 = Elevation of water in the standpipe at t = 0 (measured from base of the column)
h2 = Elevation of water in the standpipe at time equal to t
In our test configuration the area of the specimen is equal to the area of the standpipe, so the equation simplifies to:
The falling head times (t) were recorded based on a drop in water level of 6 inches, from 8.0 inches above the media (h1) to 2.0 inches above the media (h2). A picture of the permeameter is provided in Figure 6. In operation it is placed over a sink for drainage.
Several permeability tests were conducted during Run 1 on the clean media over 24 hours. Over this period, there was a general decrease in K from 220 in/hr to 160 in/hr. This may be due to particle settling and rearrangement. (This behavior was not observed in Runs 2 and 3). Subsequent permeability measurements were conducted after the equivalent of 0.5 lbs/ft2 (1.2 gm) of sediment was added to the column.
One of the questions we wanted to address is what effect how the solids were added had on the observed permeability. In this first of three runs the solids were added to water to create a suspension with solids concentrations that might be observed in highway runoff. In this first run, the concentration of solids in the water dosed to the column was 300 mg/L resulting in a reduction of K from about 160 in/hr to 95 in/hr. The second dose had a concentration of 600 mg/L causing a further reduction to 36 in/hr. The last dose again used a concentration of 300 mg/L resulting in the final value of 15 in/hr.
The column was then allowed to sit undisturbed for a week. Over that time the permeability rebounded from 15 in/hr to 117 in/hr. Solids were again added, but this time the minimum amount of water was used to disperse the solids (accelerated aging). The relationship using this solids dosing regimen produced the data show in green in Figure 7. Failure, defined as K < 19 in/hr (filtration rate of 25 in/hr), is predicted at between 3 and 3.5 lbs/ft2. In this run there were two measurements taken at 3.25 lbs/ft2 at eight days apart with no rebound in permeability as observed when dosing with the lower solids concentrations. All the data for this and the following experiments is provided in Appendix A.
The permeameter was then emptied, cleaned and new media installed. Based on the results from Run 1, the UT research team decided to do the entire test using the accelerated aging method of solids dosing. The results of which are shown in Figure 8. We should point out that there were three measurements of the clean media (0.0 lbs/ft2) and two each at 1, 2, 3, and 3.5 lbs/ft2. The last two measurements were taken about 4 days apart and no rebound in permeability was observed. In fact, there was a slight reduction over that time. A sediment load of between 3 and 3.5 lbs//ft2 reduced the permeability to less than 19 in/hr (equivalent to a filtration rate of 25 in/hr), which we defined as failure.
The permeameter was then once again emptied, cleaned and new media installed. As in Run 2 the accelerated aging method of solids addition was employed. The results of Run 3 are provided
in Figure 9. The results are very similar to Run 2 with clogging again occurring with a solids loading of between 3 and 3.5 lbs//ft2.
Since Runs 2 and 3 used the same methodology and produced similar results the results of both runs were plotted on the same graph and a trendline developed that used both data sets. These results are provided in Figure 10. Failure (K < 19 in/hr) is again predicted to occur with a solids loading of between 3 and 3.5 lbs//ft2.

The permeability relationship for Runs 2 and 3 was then converted to filtration rate using Darcy’s Law,
Where:
q = Filtration rate
K = Permeability
dH = Water column length (media depth + height of water above media)
dL = Media depth
Eighteen inches of media and a six-inch water depth over the media leads to the results for filtration rate show in Figure 11.

6. Discussion
Type of filtration observed.
As discussed in the Interim Report (Task 1a memorandum), a media filtration design that promotes depth filtration (i.e., migration of sediment particles into the media particles) is more likely to have longer lifecycle than a design that promotes cake filtration (accumulation of sediment particles on the surface of the media). Figure 12 is a photograph of the top of the filtration media at the end of Run 2. These tests show that a layer about ½ inch thick of
retained sediment is clearly visible at the top of the column, so it appears that cake filtration is the dominant process for particle removal rather than bed filtration.
The presence of cake filtration shows that the limiting hydraulic layer will be found near the media surface. This will tend to produce unsaturated flow below the restrictive layer. An outlet control below the media bed should be used to help promote saturated flow in the lower part of the column below the surface restriction.
The presence of cake filtration suggests that the media bed filtration capacity can be restored by maintenance can be restored by scraping or otherwise removing the top 2 to 3 inches of the media bed.
A mulch layer could also help provide irregularity of the surface, providing greater pathways for water to move through the sediment cake as sediment builds up on the surface.
Representativeness of stormwater loading.
The material obtained from the hazardous material trap does not contain significant colloidal size particles as these are washed through. Additionally, oil and grease would tend to float through the hazardous material trap and not be present in the solids used in this experiment. Finer particles and oils and greases from roadway runoff may cause clogging at a lower amounts of sediment loading. Therefore, this should be considered an optimistic estimate of the load that a media bed can receive without clogging.
The accelerated aging method may have resulted in somewhat greater prevalence of cake filtration than would be expected when particles are added to the bed more gradually. However,
the comparison between Run 1 (lower sediment addition rates) and Runs 2 and 3 (accelerated aging) suggests that the rate of sediment addition did not substantially change the eventual load to clog.
Effect of failure threshold on sediment load capacity.
To interpret these tests, we have assumed failure would occur at a filtration rate of 25 in/hr. If instead, we set the failure at a filtration rate of 50 in/hr, the load to clog would be 2.5 lbs/ft2 instead of 3 to 3.5 lbs/ft2. A higher filtration rate would enable a greater amount of tributary area to drain to a BMP of a given size, which would then increase the unit sediment loading rate per media bed footprint area. Therefore, increasing the design filtration rate has a compounding effect on shorter maintenance intervals by increasing the loading rate per bed area and reducing the amount of sediment accumulation that is tolerable. However, a higher design filtration rate could reduce the size and weight of on-bridge structures by half, which may be a necessary tradeoff in some cases. The data from this laboratory study will be used in subsequent research efforts to help explore these tradeoffs.
Comparability to similar previous studies.
Pitt and Clark (2010) studied various media blends in a column study and subsequently monitored the full-scale BMP that was constructed based on their column study (Pitt and Colyar, 2020). They found a clogging load of 2 to 2.5 lbs/ft2 for a somewhat finer media blend to drop from about 30 in/hr to 8 in/hr (a similar percentage reduction as a drop from 200 in/hr to 50 in/hr). Based on synthesis of multiple studies from NCHRP Report 922 (NAS, 2019), a decline from 200 in/hr to 50 in/hr would occur at about 1 lb/sq-ft of loading (median of 9 data points in this K range) with an interquartile range of 0.6 lb/sq-ft to 4 lb/sq-ft for data in this K range). The interquartile range of studies evaluated in NCHRP Report 922 suggests that there could be high variability and uncertainty.
Fairbaugh (2022) summarized the sediment loading capacity of high rate biofilters. These systems, such as the Contech Filterra® system typically have an approved hydraulic capacity of around 100 to 150 inches per hour, so are of a similar nature to the recommended media tested in this project. Fairbaugh found that the Filterra high rate biofilter could withstand about 20 lb/sq-ft of loading with stormwater dosed with Sil-Co-Sil (an artificial, inert sediment), but could only withstand about 2 lbs/sq-ft of particulate loading when loaded with stormwater dosed with natural sediment, organic material, and motor oil.
Biofouling of media beds has been observed as a hydraulic failure mechanism, particularly where seasonal rainfall maintains continuously wet conditions (personal communication, Jim Lenhart). This study included accelerated aging and did not attempt to simulate the full loading conditions found in the highway environment. Therefore, the scope of this study did not support evaluation of potential biofouling. High-rate media filters, such as Filterra®, StormFilter ® and Modular Wetlands® have been used successfully in wet climates, so this is not an inevitable outcome. However, it poses an additional risk of premature failure.
Overall, we believe the findings of past studies are all relatively similar, and the findings of this study are generally comparable to previous studies. While there is significant uncertainty in the lifespan of media associated with variability in stormwater characteristics, loading rates, and other factors, our clogging tests show that this media is similar to prior high-rate media tests with respect to its susceptibility to clogging.
7. References
Fairbaugh, CM (2022). Mass Capacity Analysis of Stormwater Control Measures Using Synthetic Stormwater With Silica, Organic and Hydrocarbon Constituents. Dissertation. Portland State University.
Pitt, R., and Clark, S., 2010. Evaluation of Biofiltration Media for Engineered Natural Treatment Systems. Prepared for The Boeing Company. Submitted to Geosyntec Consultants. Santa Barbara, CA.
Pitt, R., and Colyar, M., 2020. Can Laboratory Column Studies Really Predict Field-Scale BMP Performance? A Comparison of 10 Years of Field-Scale Performance Data With Original Bench-Scale Test Results. California Stormwater Quality Association Annual Conference, September 15, 2020. https://www.casqa.org/asca/can-laboratory-column-studies-really-predict-field-scale-bmp-performance-comparison-10-years
National Academies of Sciences, Engineering, and Medicine 2019. Stormwater Infiltration in the Highway Environment: Guidance Manual. NCHRP Report 922. Washington, DC: The National Academies Press. https://doi.org/10.17226/25705. Appendices available at: http://www.trb.org/Main/Blurbs/180229.aspx
Clogging Test Data*
| Sediment mass loaded (lbs/ft2) | Time to drop from 8 inches to 2 inches depth, t (seconds) | K (cm/s) | K (cm/hr) | K (in/hr) | Calculated Filtration Rate at 6 inches head (in/hr) |
|---|---|---|---|---|---|
| Run 1 | |||||
| 0 | 73.9 | 0.16 | 560 | 220 | 294 |
| 0 | 74.3 | 0.15 | 557 | 219 | 292 |
| 0 | 85.2 | 0.13 | 486 | 191 | 255 |
| 0 | 83.7 | 0.14 | 494 | 195 | 259 |
| 0 | 101.5 | 0.11 | 408 | 160 | 214 |
| 0.5 | 171.8 | 0.07 | 241 | 95 | 126 |
| 1 | 456.4 | 0.03 | 91 | 36 | 48 |
| 1.2 | 1111 | 0.01 | 37 | 15 | 20 |
| 1.2 | 139 | 0.08 | 298 | 117 | 156 |
| 1.7 | 210 | 0.05 | 197 | 78 | 103 |
| 2.2 | 342 | 0.03 | 121 | 48 | 64 |
| 2.7 | 431 | 0.03 | 96 | 38 | 50 |
| 3.2 | 1320 | 0.01 | 31 | 12 | 16 |
| 3.2 | 1211 | 0.01 | 34 | 13 | 18 |
| Run 2 | |||||
| 0 | 72 | 0.16 | 575 | 226 | 302 |
| 0 | 63 | 0.18 | 657 | 259 | 345 |
| 0 | 72 | 0.16 | 575 | 226 | 302 |
| 0.5 | 102 | 0.11 | 406 | 160 | 213 |
| 1 | 139 | 0.08 | 298 | 117 | 156 |
| 1 | 148 | 0.08 | 280 | 110 | 147 |
| 1.5 | 249 | 0.05 | 166 | 65 | 87 |
| 2 | 429 | 0.03 | 96 | 38 | 51 |
| 2 | 454 | 0.03 | 91 | 36 | 48 |
| 2.5 | 601 | 0.02 | 69 | 27 | 36 |
| 3 | 766 | 0.02 | 54 | 21 | 28 |
| 3 | 792 | 0.01 | 52 | 21 | 27 |
| 3.5 | 940 | 0.01 | 44 | 17 | 23 |
| Sediment mass loaded (lbs/ft2) | Time to drop from 8 inches to 2 inches depth, t (seconds) | K (cm/s) | K (cm/hr) | K (in/hr) | Calculated Filtration Rate at 6 inches head (in/hr) |
|---|---|---|---|---|---|
| 3.5 | 1406 | 0.01 | 29 | 12 | 15 |
| 3.5 | 1496 | 0.01 | 28 | 11 | 15 |
| Run 3 | |||||
| 0 | 61 | 0.19 | 678 | 267 | 356 |
| 0.5 | 99 | 0.12 | 418 | 165 | 219 |
| 1 | 131 | 0.09 | 316 | 124 | 166 |
| 1 | 138 | 0.08 | 300 | 118 | 157 |
| 1.5 | 194 | 0.06 | 213 | 84 | 112 |
| 2 | 338 | 0.03 | 122 | 48 | 64 |
| 2.5 | 505 | 0.02 | 82 | 32 | 43 |
| 3 | 764 | 0.02 | 54 | 21 | 28 |
| 3.5 | 1775 | 0.01 | 23 | 9 | 12 |
* The colors distinguish between the three runs


