Transit Traction Power Cables: Replacement Guidelines (2024)
Chapter: 3 Survey and Interviews

CHAPTER 3
Survey and Interviews
3.1 Survey Description/Questions and Responses
1. The data collection process was carried out with transit agencies and practitioners in the industry using a survey and case studies; research results were collected and analyzed.
The survey process was carried out to determine current practices at various locations in the United States. In the process, old, new, large, and small systems were covered. The survey was sent to participants to determine their practices. Table 3.1 presents details obtained from the survey. In total, 60 respondents participated. Some participants did not respond to all the questions; on the other hand, some questions were answered through selecting multiple parameters, depending on the nature of the question. Responses for each question are quantified and explained with graphs.
2. What type and size of transit power cables are used? How many taps per hundred feet are in your cables? Maximum number of taps allowed per circuit?
Figure 3.1 shows the type and size of cables used by the transit agency respondents. The responses for size ranged from 250 MCM to 2,000 MCM, with the most popular sizes being 500 MCM, 750 MCM, and 1,000 MCM. According to respondents, MCM cables are far more widespread than diesel locomotive cables, so common practice is the use of MCM cables, which would mean they are involved in more common problems faced by the agencies. Cables of 500 MCM, 750 MCM, and 1,000 MCM are the most commonly used by the agencies.
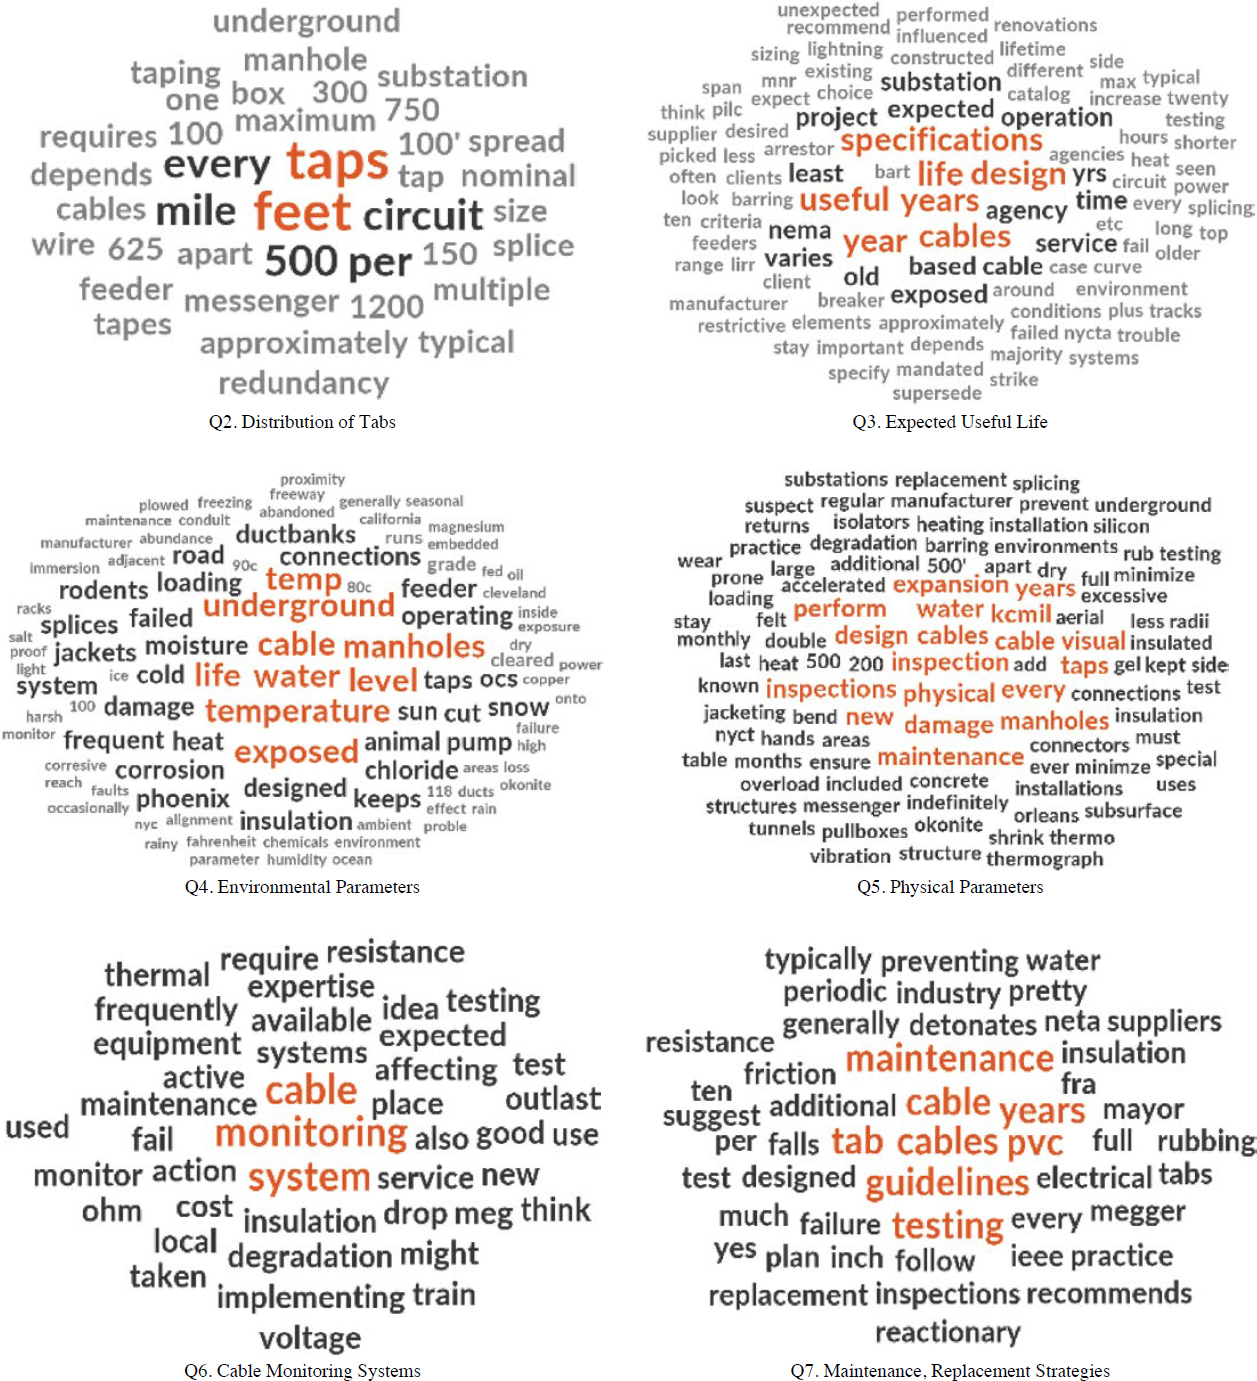
Figure 3.2 shows the usage of taps on cables. This usage varies widely depending on the condition of the system, from no taps to 10 taps per circuit. While most responses indicate tap usage, it is worth noting that the majority of the responses indicated that one to five taps are used in their systems. With that in mind, it is important to describe the problems related to the taps. Respondents indicated that taps are critical for the cable life. Therefore, the number of the taps used is important.
Other important information is the distribution of the taps, which is shown in Figure 3.3. The most common spacing between taps is 100 ft to 500 ft, but some respondents indicated a spacing of over 2,000 ft. After that, 500 ft to 1,000 ft is the second most common distance between the taps. Generalization about the distances between the taps can be made with these provided ranges.
Table 3.1. Details from the data collection process.
| Region | System Size | Old-New/~Years | System Installation | System Length (miles) | DC | AC |
|---|---|---|---|---|---|---|
| Midwest | Small | Very old/70+ | 1950s | 36 | x | |
| Northeast | Very Large | New/2000 | 2005 | 625 | x | |
| Northeast | Large | New | 2009 | 30 | x | x |
| Ohio Valley | Large | Very old | 1900s | 600 | x | |
| West | Medium | Old | 1985 | 42.2 | x | |
| The South | Large | Old/60+ | 1960s | 33.4 | x | x |
| California | Large | Old/60+ | 1970s | 125 | x | x |
| Mid-Atlantic | Medium/+ | Old/50+ | 1973 | 14 | x | |
| Ohio Valley | Large | Old/60+ | 1955 | 38 | x | |
| The South | Large | Very old/1893 | 1893 | 33 | x | |
| Northeast | Medium | Very old/105 | 1900s | 30 | x | |
| West | Very large | New to old/5-30 | 2000-2015 | 200/50 | x | |
| Ohio Valley | Very large | Old | 1920s | 220 | x | |
| Northeast | Very large | Old/1904 | 1904 | 245 | x | |
| Ohio Valley | Very large | Old and new | 1900-2000 | 225 | x | x |
| South | Medium | New/5 years | 2014 | 22.7 | x | |
| Northwest | Large | Old/20 | 2000s | 62 | x | |
| Northeast | Large | Old/49 | 1989/1969 | 34/15 | x | |
| Mid-Atlantic | Large | Very old | 1920s | 125 | x | x |

Figure 3.1. Type and size of transit power cables used in the system.

Figure 3.2. Number of taps used.

Figure 3.3. Average distance between taps.
3. What is the expected useful lifetime of the cables that you use? Do you follow any practices to increase the useful life of the cables? Please explain.
Most of the respondents expected the useful lifetime of cables to be 30 to 40 years, as illustrated in Figure 3.4. Only one response indicated 10 years, and only one indicated 70 years. It is possible these outliers use specific, special-purpose cables that are not frequently used by others, giving them the vastly different life expectancy from the norm. With the exception of special-case scenarios, it can be assumed that expected cable lifespan is 30 to 40 years.
Steps to maximize cable life are:
- Design to minimize heating of cables due to overload,
- Design to minimize damage during installation (large bend radii, pull boxes less than 500 ft apart), and
- Ensure that cables and taps are kept dry.
Commonly used practices to increase the useful lifetime of cables center around the design of the system. These design considerations include minimizing the heating of cables due to overload. Thus, any system design should consider the odds of an overload, the frequency of overloading, and the damage caused by overloading. Additionally, care should be taken so that lines and taps are kept dry or have adequate ventilation to quickly dry if they do get wet. Other

Figure 3.4. Distribution of expected useful life.
design considerations should be given to minimizing the possibility of damage during installation. Potential solutions to reduce this possibility include large bend radii on curves.
4. What are the environmental parameters, such as temperature, animals (birds, rodents), water, above or below the water level, and so forth, affecting the useful life of transit power cables?
The environmental parameters selected by respondents were:
- Temperature,
- Vibration,
- Water,
- Rodents,
- Salt,
- Dust,
- Chemicals,
- Corrosion, and
- Ultraviolet (UV) light.
These parameters play an essential role in the useful life of cables. Figure 3.5 represents the distribution of environmental parameters affecting the useful life of transit cables. Responses varied widely to this question, and respondents could select multiple parameters in their responses. However, the two standout factors affecting the useful life of transit power cables were water and temperature. According to the respondents, these factors are the most damaging environmental factors, and thus the most important to consider.
5. What are the physical parameters, including jacketing and insulation, affecting the useful life of transit power cables?
Figure 3.6 depicts the various physical parameters affecting the life of cables. The most common physical parameters were jacketing, conduits, and insulation. In the graph, jacketing has the highest number of responses, followed by conduits and insulation with the same number of responses. The other physical parameter is cable structure. As such, jacketing, conduits, and insulation are the most significant physical parameters for cable design, and all design recommendations should focus on these physical parameters. Additionally, some participants have

Figure 3.5. Environmental parameters affecting cable life.

Figure 3.6. Physical parameters affecting cable life.
suggested different parameters such as smoke, the presence of dielectrics, lead-coated cables, gas pipe installed, circuit use, and hexane.
Following are some recommended actions given by the responders related to physical parameters that can improve the useful life of cables.
- “Cable insulation/jacket designed for wet locations.”
- “Insulation rated for well above system voltage to handle transient surges.”
- “Properly designed duct bank (drainage, depth) to maintain dry and cool cables.”
- “Proper separation and support of cables in manholes.”
- “Design duct bank for minimal cable-pulling stress (broad sweeps, frequent pull boxes).”
6. How do you determine the degree of degradation of insulated cables? Do you have cable monitoring systems?
Figure 3.7 shows the most commonly employed methods for determining the degradation of insulated cables. These methods are the megger test, visual inspection, and the run-to-fail method. Figure 3.8 shows the percentage of respondents using a cable monitoring system. The variety of cable monitoring methods indicates a lack of a universally agreed-upon best practice in the industry. This, coupled with the infrequent use of a monitoring system, as seen in Figure 3.8, further demonstrates the need for comprehensive, easy-to-understand procedures for cable maintenance, complete with guidelines for monitoring and replacing when necessary. The majority (88%) stated that they do not use a monitoring system, and 12% stated that they use a monitoring system.

Figure 3.7. Methods for determining degree of degradation.
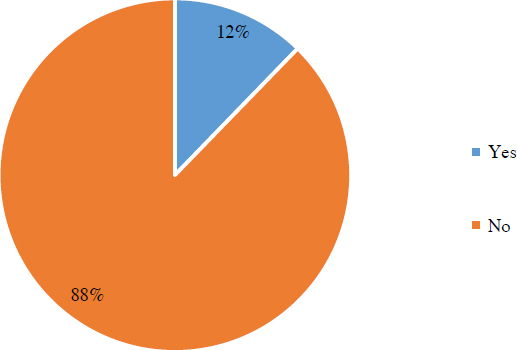
Figure 3.8. Use of cable monitoring systems.
7. Is there a lifetime guarantee by the suppliers? Are there any maintenance, testing, or replacement schedules suggested by the suppliers?
As Figure 3.9 shows, there is rarely a lifetime guarantee provided by suppliers. Respondents indicated that the lack of lifetime guarantees is likely due to suppliers being unable to control whether the cables are correctly installed or how carefully designed the system is to ensure the longevity of the cables. Survey responders mentioned that it is challenging for suppliers to control the construction environment and detect parameters that affect the system. A couple of comments were: “There are no lifetime guarantees. No cable supplier would guarantee a lifetime because there are so many variables affecting the life that [are] dependent on the installation”; and “Lifetime guarantees can be proposed, but the installation also determines the quality of the conductors and cables… .”
Figure 3.10 shows whether maintenance, testing, and replacement schedules are provided by suppliers. There were no comments from respondents related to maintenance, testing, and replacement schedule recommendations. However, respondents indicated that suppliers provide
Note: N/A = not available.
Figure 3.9. Lifetime guarantee.

Note: N/A = not available.
Figure 3.10. Maintenance, testing, and replacement schedules.
support to agencies when problems occur and that agencies contact suppliers for ongoing projects or when planning a new project. Agencies determine cable needs for their projects and obtain the suppliers’ input when needed. Depending on the project budget, agencies make the plan and prepare the project details. Suppliers ensure that the delivery is on time and that all needed materials are provided. Delivered material and quantities are identified through labeling.
8. What are the diagnostic tests carried out on cables? How often do you need to run these tests?
Figure 3.11 shows the diagnostic tests that respondents reported carrying out on cables. Multiple answers were possible if agencies used more than one test. Megger, visual, and hi-pot testing were the most regularly implemented diagnosis tests. However, a large proportion of respondents were not using any diagnosis testing on transit cables.
This lack of testing represents a considerable unknown infrastructure cost that could be incurred at any time. The status is unknown for these portions of the cables, which can lead to failures at inopportune times and budget shortfalls.

Figure 3.11. Diagnostic tests used.

Figure 3.12. Frequency of diagnostic tests.
In Figure 3.11, the megger test got the most responses, followed by visual and hi-pot testing. Cable inspection plans, thermography, and IR testing were the next most common.
Figure 3.12 shows the frequency of diagnostic tests carried out by the transit agencies. The most common response from agencies was that they conducted diagnostic tests when a failure occurred. The next most common responses were 5-year tests and annual inspections. Annual inspections may be more costly and impossible to budget for and may create delays and service interruptions as lines are repaired or replaced.
A minority of participants stated that they conducted tests either only at the beginning of the installation, each month, or every 10 years. These responses are mainly due to maintenance budget issues.
9. What are the costs to run each type of test, as well as the number of operators and time length? Do you have to stop operations, and what are the other limitations of the testing process? Do any of the tests have the potential to cause damage?
While most participants stated that the cost to run tests varies, they did emphasize that the most common crew sizes are one to three and three to five, as seen in Figure 3.13. Some of the respondents mentioned that testing safety procedures require stopping operations completely.

Figure 3.13. Crew size.
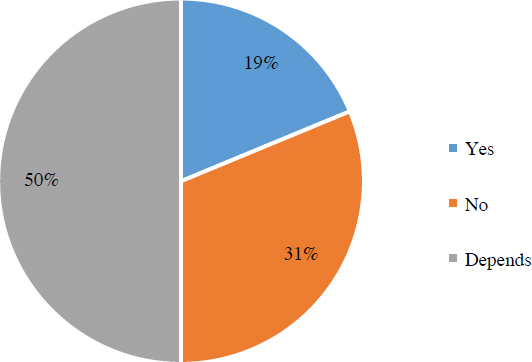
Figure 3.14. Stopping operations.
This creates additional costs in the form of power outages, service interruptions, and crews kept from performing other tasks. Even though the most common test, the megger test, only takes 10 minutes, preparation and the return to normal operation typically take longer than the test itself.
Also worth noting is that some tests have the potential to damage the cables, sometimes even more than normal wear and tear will. The most frequent result of this type of damage is minimally intrusive shutdowns. It is therefore not recommended to perform unnecessary insulation testing because it may overstress the cable insulation. Respondents stated that the main limitation of testing is safety precautions, which require operations to be stopped prior to testing, resulting in power outages and service interruptions.
In Figure 3.14, response percentages are given for whether agencies need to stop operations during tests. Half of the respondents said that it depends; 31% indicated that they do not need to stop operations during the tests, and 19% said that they do stop operations. In Figure 3.15, response percentages are displayed for whether there is any damage potential from the tests. While 44% said yes, 37% said no to this question.
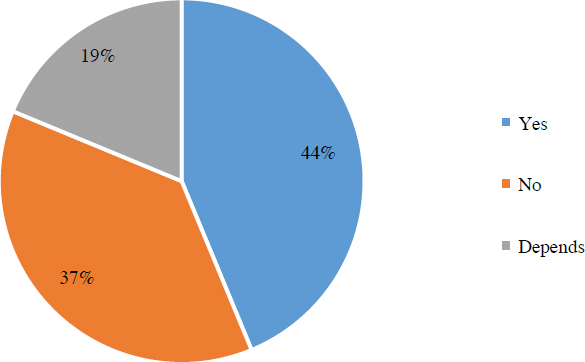
Figure 3.15. Potential damage.
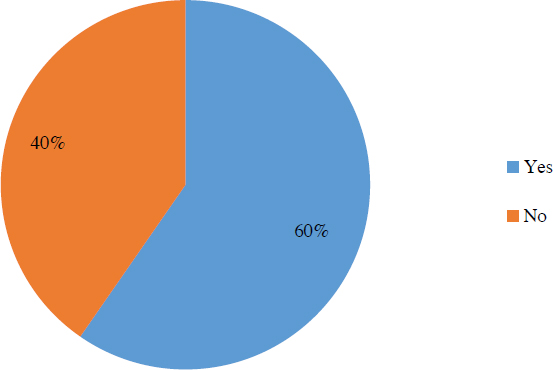
Figure 3.16. Cable inspection and maintenance procedures.
10. Do you practice any cable inspection and maintenance procedures? If so, please describe your procedures, including intervals and types.
Figure 3.16 shows that 40% of the respondents indicated that they do not practice inspection and maintenance procedures. This further illustrates the need for an established guide for cable inspection and maintenance procedures. Without widespread adherence to universal standards across the industry, it is not easy to plan appropriately for future maintenance and repair or replacement projects, especially across separate entities. Figure 3.17 shows how often participants conduct cable inspection and maintenance procedures.
As seen in Figure 3.17, among those who perform regular inspections, the frequency of these inspections is categorized as annually, biannually, and randomly. A majority perform inspections annually, which allows for simple scheduling and easy tracking of cable health over time. However, some agencies perform their inspections on a biannual basis, or even randomly. With a standardized approach, the same inspection schedule can be followed to provide better practice. This would also allow better comparison of cable health over time across a wider variety of conditions.
Figure 3.18 shows the main inspection methods. The most common method is visual inspection. This is a relatively quick, easy, and simple inspection, but its applications and accuracy are

Figure 3.17. Procedure intervals.
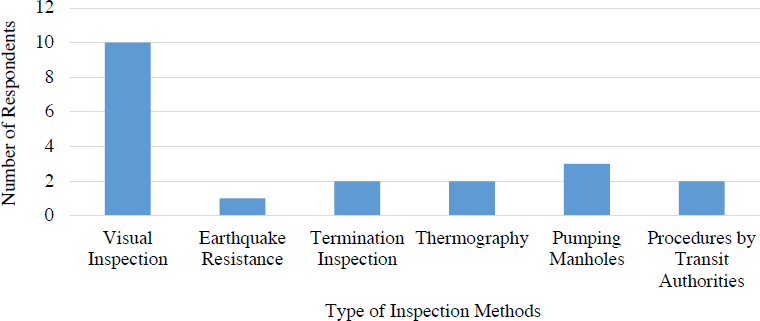
Figure 3.18. Main inspection methods.
limited. Visual inspections can only be performed on accessible cables, and thus this type of inspection is not applicable for buried cables or those in duct banks. Additionally, the inspector could easily miss a flaw or small failure during the inspection, leading to unexpected service interruptions down the road.
Other tests performed include termination inspections, thermography, and pumping manholes. Each of these tests have benefits and drawbacks. Each agency has its own practices used according to the needs of the system.
11. What types of repairs are made? Under what circumstances do you choose repairing the cable compared to replacing? What are the diagnostic indicators for replacing insulated cables? What are the general costs and durations of repair and replacement? Are there any cost-effective applications you practice for repair and replacement?
Figure 3.19 shows the circumstances under which practitioners chose repair over replacement. Most respondents indicated that the most important factor to consider when determining whether to repair or replace a damaged cable was the accessibility of the cable.
Respondents chose to repair rather than replace a damaged cable if the cable was accessible and not in duct banks. If the cable was accessible, the best practice was to repair the damage.
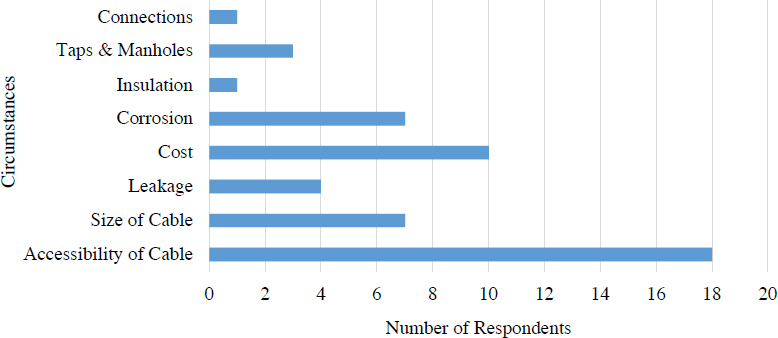
Figure 3.19. Circumstances for choosing repair over replacement.
The size of the cable was also indicated as having an impact on the decision to repair or replace a cable.
Not only is repairing a more cost-efficient solution, but it provides a safety net: if the repair were to fail, the cable could easily be repaired again. Repairing inaccessible cables incurs significantly more costs, and thus it is more feasible to replace the cable rather than risking failure of the repair or causing damage. While the quality of a replaced cable is higher than that of cable that has been repaired, budgetary considerations sometimes necessitate a more economical solution.
In cases where there is corrosion in the cable, it is recommended to determine where the corrosion is located prior to choosing whether to repair the cable. If the funds are available, most respondents prefer a replacement over repair. According to the responses, repair type is limited to splicing the cables.
In general, the cost and duration of repair or replacement vary depending on the size and location of the fault in the cables as well as the number of conductors per circuit. The fault diagnosis is usually conducted when green cable corrosion is found floating in water-filled manholes during an inspection test or when a ground short is detected during inspections of insulated cable.
A concentric 1,250 kcmil (kilo circular mils) copper, paper-insulated, lead-covered (PILC) cable is significantly more expensive than a concentric ethylene-propylene rubber (EPR) cable. A concentric 1,250 kcmil copper PILC cable costs approximately $120 per foot, over $2,000 per splice kit, and $10,000 for a class 1 termination (pothead terminal), while a concentric EPR cable costs approximately $85 per foot, $1,000 per splice kit, and $800 for a class 1 termination. Prices for nonconcentric 1,250 kcmil cable drop to $55.5 per foot for EPR and $58.5 per foot for XLPE cables, with both phase and return conductors accounted for, and there are significant drops in cable splice and termination prices as well. These prices are based on estimates from various manufacturers and provide a basis for a cost comparison. Prices will vary depending on the size of the cable, length purchased, required lead times, metal prices, and other factors (Levi and Shah 2018).
According to Fitzgerald (2014), the high costs associated with cable testing can be justified when the costs of alternatives are considered. These include the costs of service outages, passenger inconvenience, political fallout, emergency repairs, and busing logistics. A typical cable test crew, performing daily cable testing, has an easily budgeted annual cost. Although this cost may appear high, it outweighs the costs of a cable burnout with complete service shutdown, passengers stranded in nonpowered trains in subways, and evacuation of trains with passengers walking along rights-of-way and tunnels. The latter category of costs is unpredictable, unbudgeted, and can vary widely. The former category is predictable, preventive, and can be built into a schedule so as not to interrupt normal operations. Example costs of a cable test crew are given in Table 3.2.
Table 3.2. Cost of cable test crew.
| Staff | Cost per Year |
|---|---|
| Engineer (2) | $170,000 |
| Lineman (2) | $155,000 |
| Cable splicer (4) | $343,200 |
| Cable crew (one foreman, six linemen, and one cable helper) | $620,000 |
| Total | $1,288,200 |

Figure 3.20. Existence of a replacement strategy.
12. Is there any replacement strategy, including a smart replacement strategy, that you are implementing for insulated cables?
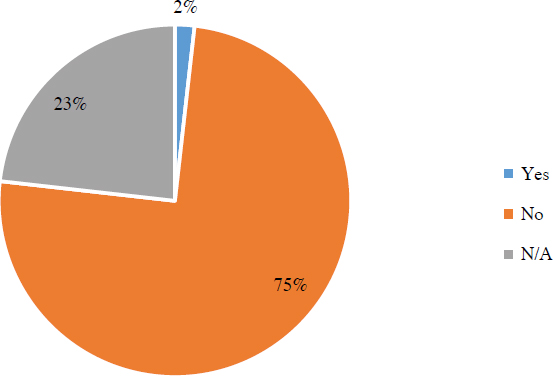
Figure 3.20 shows that 25% of respondents use a replacement strategy. The remainder of the respondents do not use a replacement strategy.
Figure 3.21 shows the distribution of replacement strategies employed. As shown in the figure, 20% of the strategies qualified as “smart,” 20% of the strategies were on an as-needed basis, and 60% did not qualify as smart replacement strategies. If further information on the benefits of smart replacement strategies was distributed, perhaps an increase could be seen in the use of these strategies.
13. Do you need to stop operations completely during repair and replacement?
One of the most significant drawbacks to repairing and replacing cables is the possible downtime in regular operations. Figure 3.22 displays how widespread this issue is, with 9% percent

Figure 3.21. Types of replacement strategies.

Figure 3.22. Stopping operations during repair or replacement.
of respondents reporting that operation is stopped during repairs and replacement, and 62% indicating that it depends on the size of the repair or replacement. Only 29% stated that they do not need to stop operations. Figure 3.23 shows the distribution of agencies that stop operations during repair and replacement. A portion of the respondents did clarify that the stoppage in operation can depend on many interconnected factors, such as the location, the cable type, the track type, the switch type, and what time of day the repair or replacement is to occur. The location of the cable and nonrevenue hours are noted accordingly. Those that do not stop operations during repairs and replacement cited the inherent redundancy in their system design as the main factor in maintaining full operations. The factors to stop operations are determined by the agencies. If it is just a minor repair, operations are not stopped during the repair.
14. Were there any failures experienced by your agency? Are the reasons behind the failures known? How do you diagnose failures? Did you have any experience that you can share with us?
More than half of all respondents reported experiencing cable failure, as seen in Figure 3.24. The reasons for the failures are shown in Figure 3.25. The most common failures are at manholes and joints due to water intrusion. More durable sealants around manholes and at joints would help reduce the occurrence of failure in these areas. Better designed or redesigned systems could minimize the number of manholes and joints, reducing the potential for failure along the cable.

Figure 3.23. Factors involved in determining whether to stop operations.
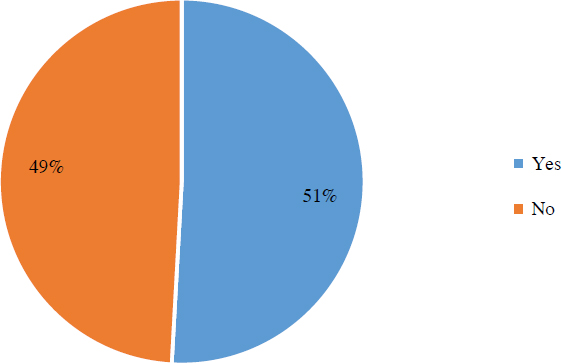
Figure 3.24. Cable failures experienced.
Additionally, some respondents stated that some failures arise from insulation wearing, improper taps, damage during installation, mechanical issues, and the aging of cables. By giving proper installation guides and directions, damage could be reduced. By designing systems to protect existing cables better, the aging process could be slowed down and the wear on the cable insulation could be reduced, providing long-term savings and ensuring the continued operation of service.
According to the survey responses, the industry assesses these aspects of cable failures:
- Technical merits;
- Field characteristics, history, and data;
- Repairability;
- Operating obstructions; and
- Consequences.
Some diagnostic methods were mentioned, as follows and as shown in Figure 3.26:
- Arcing event
- Visual inspection
- Continuous monitoring
- Rate-of-rise (ROR)
- Hi-pot
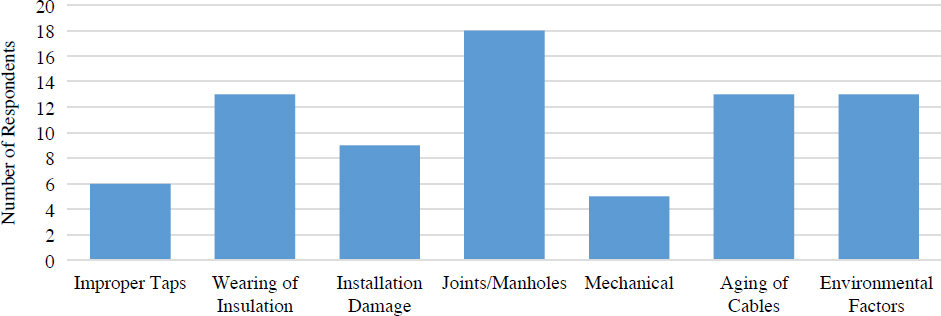
Figure 3.25. Failure reasons.
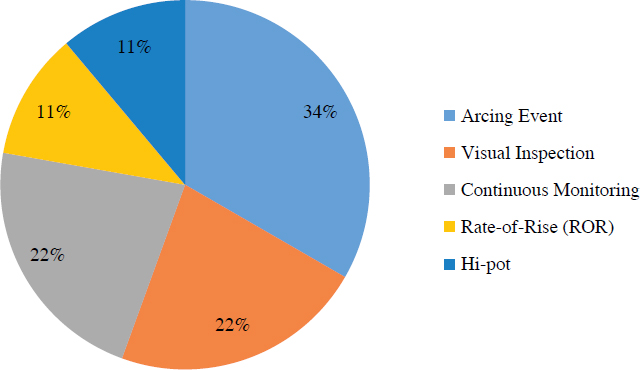
Figure 3.26. Diagnostic methods.
3.2 Statistical Analysis
To evaluate the survey results, a statistical analysis was carried out to determine correlations between the different responses. In the statistical analysis, qualitative relationships between the responses were examined. Comparisons of qualitative variables were tested using the Pearson chi-square test and Fisher’s exact test. As shown in Table 3.3 and Figure 3.27, the test results showed that experiencing a cable failure did not significantly correlate to using a monitoring
Table 3.3. Correlation results between monitoring systems and experiencing cable failure.
| Experienced Failure | Total | P-value | |||
| Yes | No | ||||
| Monitoring System | Yes | 3 | 4 | 7 | |
| No | 26 | 24 | 50 | 0.71 | |
| Total | 29 | 28 | 57 | ||
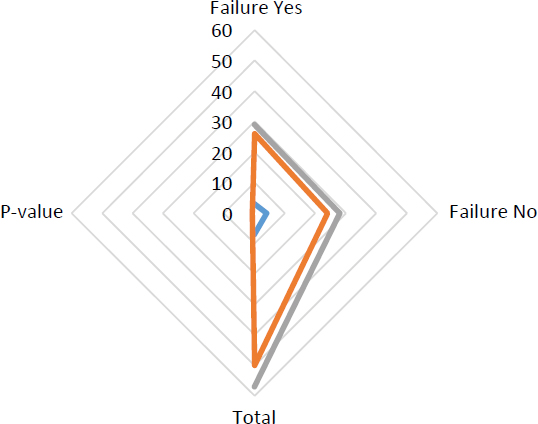
Table 3.4. Correlation results between monitoring systems and performing cable inspection and maintenance.
| Cable Inspection and Maintenance | Total | P-value | |||
| Yes | No | ||||
| Monitoring System | Yes | 4 | 3 | 7 | 1.00 |
| No | 30 | 20 | 50 | ||
| Total | 34 | 23 | 57 | ||

system (p > 0.05). The significance level p was found to be 0.71. Since this is greater than 0.05, using a monitoring system and experiencing a cable failure were not correlated. Out of the 50 that did not have cable monitoring system, 26 experienced cable failure. Three responders that had a cable monitoring system experienced cable failure. In Table 3.4 and Figure 3.28, a cross-table analysis shows the number of units in which subcategories of the two variables are observed together. The test results revealed that performing cable inspection and maintenance did not significantly correlate to using a cable monitoring system (p > 0.05). Out of the 50 that did not have a monitoring system, 20 did not perform inspection and maintenance. As shown in Table 3.5 and Figure 3.29, the Fisher’s exact test revealed that using a cable replacement strategy did not significantly correlate to using a cable monitoring system (p > 0.05). The significance level p was found to be 0.67. Out of the 50 responders that did not have a monitoring system, 37 had no cable replacement strategy. None of the seven with cable monitoring systems had a cable replacement strategy.
Table 3.5. Correlation results between monitoring systems and replacement strategies.
| Replacement Strategy | Total | P-value | |||
| Yes | No | ||||
| Monitoring System | Yes | 1 | 6 | 7 | 0.67 |
| No | 13 | 37 | 50 | ||
| Total | 14 | 43 | 57 | ||

3.3 Model Analysis
Model analysis was conducted using content analysis of the survey results to determine the presence of certain words, themes, or concepts within some given qualitative data. Since the survey was formed using open-ended questions, determining the most commonly used words was important in evaluating the results. Two types of modeling were conducted: (1) tree map analysis, and (2) word cloud analysis. The content analysis was based on the technical terms used in the individual survey responses.
The model analysis can assist in developing an understanding of common practices in different areas of the United States, and also in identifying differences in common practices. Based on this analysis, insight can be gained on strategies and solutions for defining best common practices as well as assisting in harmonization and coordination across the states. This approach is valuable in fostering effective communication between practitioners in different locations. The content analysis methodology is given in Figure 3.30.
The content analysis was performed using qualitative analysis software according to the methodology shown in Figure 3.30. The steps of the content analysis for each question are shown in Figure 3.31, which shows the six steps of the process: (a) survey responses were imported, (b) answers were coded, (c) analysis criteria were set, (d) technical terms were set, (e) tree map analysis was carried out, and (f) word cloud analysis was performed.


The process began with importing all survey question and answer data that needed to be analyzed. Coding took place for each answer in subcategories, analysis criteria were set for each code, and technical terms that needed to be analyzed were reviewed. As a result of these steps, tree map and word cloud analysis results were generated. Evaluating the results entailed simply reviewing the most common words found in the analysis, which becomes easier with the word clouds.
With the methodology shown in Figure 3.30 and Figure 3.31, tree maps of the survey questions were created. Content analysis diagrams were then constructed. In Figure 3.32 and Figure 3.33,


tree map analysis results are shown for all survey questions. In Figure 3.34 and Figure 3.35, content analysis results are shown for all survey questions. In these figures, the most common words can be seen, and tendencies can be understood for determining best practices.
3.4 Selected Responses from the Survey
Question 4. What are the environmental parameters, such as temperature, animals (birds, rodents), water, above or below the water level, etc., affecting the useful life of transit power cables?
Some comments on the environmental factors affecting the useful life of transit power cables follow:
- “The majority of the transit systems have constructional issues that are unchangeable. For instance, the cable feeds from the DC switchgear line breakers to the track are always outdoors. Thus, they need to be able to withstand standing water, harsh chemicals, UV light, physical damage, and temperature variations that are normal conditions.”
- “Most cables are embedded and within duct banks, so the environmental temperature is not a significant factor. We have seen no problem with birds or rodents with TE [traction electric] cables.”
- “Water that can get to the copper of the cable is a definite problem. Occasional water to the cable jacket is not an issue. TE cable connections exposed to moisture/water are the most frequent failure point.”
- “For some agencies, the temperature plays a more significant factor in our bare copper conductors more than the feeder cable. Besides, salt in the winter can play a factor with the equipment for the bridges over the water.”
- “Deterioration of the bridges and components plays a role.”
- “Rodents would also be a problem for the fiberoptic cables where the cable is running in an overhead raceway.”
- “For light-rail systems, for manholes in which the feeder cables exit the substation into the manholes and run through the conduit to the overhead system, there is a typical issue with rainwater filling these manholes and have been known to cause failures.”


Question 5. What are the physical parameters, including jacketing, insulation, and duct banks, affecting the useful life of transit power cables?
Some comments on classifying the physical parameters altering the useful life of transit power cables follow:
- “Cable insulation/jacket designed for wet locations.”
- “Insulation rated for well above system voltage to handle transient surges.”
- “Properly designed duct bank (drainage, depth) to maintain dry and cool cables.”
- “Proper separation and support of cables in manholes.”
- “Design duct bank for minimal cable-pulling stress (broad sweeps, frequent pull boxes).”
Question 7. Is there a lifetime guarantee by the suppliers? Are there any maintenance, testing, or replacement schedules suggested by the suppliers?
Some responses related to lifetime guarantees from suppliers follow:
- “There are no lifetime guarantees. No cable supplier would guarantee a lifetime because there are so many variables affecting the life that are dependent on the installation.”
- “Lifetime guarantees can be proposed, but the installation also determines the quality of the conductors and cables on how it would stand.”
Question 8. What are the diagnostic tests being carried out on transit cables? How often do you need to run these tests?
Several responses related to diagnostic tests follow:
- “The most common test is insulation resistance (meg-ohm) testing.”
- “Power factor/Doble testing provides better data on insulation condition.”
- “The frequency of testing should increase as cables age. Perhaps every 5 years with new cable, but annually for older cables. The frequency of cable failure should be factored into testing frequency schedule.”
- “As for the electrical tests, the first task listed is to test for high resistance connections by either the resistance test across the bolted connections or by verifying ‘nearly equal currents’ in multiple cables with a clamp-on ammeter.”
- “The benefits of performing a resistance test on non-exposed bolted connections are outweighed by the costs associated with taking apart and restoring sealed connections. Moreover, the use of a clamp-on ammeter to verify ‘nearly equal currents’ is nearly impossible due to the highly variable nature of the DC loads.”
Question 9. What are the costs to run each type of test, including the number of operators and time length? Do you have to stop operations, and what are the other limitations of the testing process? Do any of the tests have potential to cause damage?
Some responses are as follows:
- “To megger a cable (take resistance to ground) generally requires a cable crew to isolate the cable and typically has time-of-day restrictions when cable can be taken out of service. To test three cables (one set of feeders), figure a crew of three linemen and one technician plus travel time.”
- “The actual megger/insulation test wouldn’t take more than 10 minutes, but the preparation takes more time than the actual test and it depends on each system.”
- “To perform any test, the operation has to be stopped. Power outage and service interruption are the main limitations to any test due to safety precautions.”
Question 10. Do you practice any cable inspection and maintenance procedures? If so, please describe your procedures, including intervals and types.
Some responses for the cable inspection and maintenance procedures are as follows:
- “Yearly visual inspections are performed on cables, and regular track structure to earth resistance testing is performed biannually.”
- “We would typically do a hard visual inspection on cables during the megger process. Now we do a visual inspection on feeder cables inside the substation during our annual track feeder breaker inspections.”
Question 11. What types of repairs are made? Under what circumstances do you choose repairing the cable in comparison to replacing? What are the diagnostic indicators for replacing insulated cables? What are the general costs and durations of repair and replacement? Are there any cost-effective applications you practice for repair and replacement?
Several responses are as follows:
- “Repairs to DC traction power cables are challenging. Best solutions are welded splices but are limited to locations where the welding process can best be applied. Post weldment treatment of the splice is important. Reinsulating of the splice is possible but not inexpensive. The use of crimp type connections in DC applications is ineffective in the long run.”
- “Cable repairs are dependent upon the type and extent of damage plus the type of cable used i.e., shield or non-shielded. A simple cut in a cable that doesn’t involve electrical arcing damage can usually be spliced. There are splice kits available that work very well. In most cases it takes an experienced electrical technician or engineer to evaluate the damage on a case-by-case basis.”
- “Cable repairs are limited to replacement or splicing the cable. I would choose repairing (splicing cable) over replacing due to the low cost. Short to ground is number one diagnostic for insulated cable failure, and if you can’t see visual damage, it means the damage is somewhere along the duct bank and it means cable replacement. Cost for replacement depends on the length of the circuit and access plus labor and equipment. Repairing (splicing) is the most cost-effective, if it is visual. The splice kit costs about $500.00.”
- “As a cost-effective application, if splicing cable is allowed, start cut the cable in sections at each pull box/manhole and test each section individually till you find the failed cable and replace that bad section and splice.”
- “If can be done in house or need a contractor. Could be days or a week or more. The cost driven up by not having in stock, and of need contractor.”
- “10k to 40k, mostly labor.”
- “It all depends on the type and extent of the defect.”
- “It’s mostly about time, not cost.”
- “When possible, we remove underground taps.”
Question 12. Is there any replacement strategy, including the “smart replacement strategy,” that you are implementing for insulated cables?
Two relevant responses follow:
- “Monitor substation feeder breaker tripping and perform thermal infrared camera inspection on cables and connectors to determine heat signature on cable current flow.”
- “Electrical DC taps, we are trying to bring taps above ground, the outside contractor will install new insulated cables.”
Question 13. Do you have to stop operations completely during repair and replacement?
Some responses about stopping the operations are as follows:
- “A minor repair could be done with single tracking, but major repair shall stop rail operation on both tracks.”
- “Sometimes we need to stop operations service for repair and replacement.”
- “Only if it’s a single-track area, we stop operations.”
- “Not entirely because traction substations are designed for contingency.”
- “Not always and mostly not for the whole replacement process.”
Question 14. Were there any failures being experienced by your agency? Are the reasons behind the failures known? How do you diagnose failures? Did you have any experience that you can share with us?
One note from a respondent is the following:
- “Metros seem to have a problem with cable damage in particular track-work sections. This damage is physical to the cables by rolling stock. Actual cable failures would usually be related to increased amperage, which is usually caused by poor connection procedures/practices. Other common causes for cable failures are by track gage regulators and other equipment used to maintain the track structure. In a perfect world, cables attached to the running rail would be best protected by coming from beneath the rail base and left protected by the rail profile. This is similar to the methodology employed in Europe when using precast concrete panels for the track structure on AC traction power systems.”
3.5 Conclusions
For the survey, transit agencies, practitioners, and suppliers were contacted to determine their current practices. The 14 survey questions were prepared based on the research objectives. The collected responses were used to create an effective data gathering process. From the responses, existing problems and solutions were obtained. Summaries of survey answers are provided in Table 3.6.
While transit power cables have many types and applications, the survey results showed that a few cable sizes and usage situations are more common. These include 500 MCM cable, 750 MCM cable, and 1,000 MCM cable, with either no taps used or with taps used; the taps are frequently placed every 100 ft to 500 ft. Therefore, the main focus should be on these types of cables.
The survey results show that the provider average lifespan of 30 years for cables is in line with the expected/observed lifespan of cables in service. This confirmation helps establish a timeline in the guidelines for repair and replacement, which could be used to help weigh the costs and benefits of replacing a section of cable instead of repairing it. For example, it may be more economical to replace an older damaged cable instead of repairing it. Construction difficulties also play an important role in decision-making. In some cases, it is difficult to reach cables for repair. In such cases, replacing a cable is the only viable option.
Some of the environmental and physical parameters commonly reported to be negatively affecting the life of the cables are water intrusion, poor jacket insulation, and wide temperature fluctuations, the most detrimental of these being water. Water is the single largest cause of the failure of power cables. When cables are located overhead, water can combine with other elements, causing cable failure. When cables are located underground, water can make its way down manholes and into duct banks, causing unseen damage. Unfortunately, a large majority of survey respondents indicated that they had no cable monitoring system in place to detect this damage and operated in a run-to-fail manner that increased the likelihood of unplanned service interruptions.
When cables fail, there are different diagnostic tests available. Some of them are common, such as the megger test and the hi-pot test, while others see only occasional use, such as the Doble test and loop resistance test. With such a wide variety of tests employed, a standardized approach would be helpful. More accurate recommendations on repair or replacement can be made when more cables are tested. Typically, agencies do not have established replacement strategies, and only a few use a smart replacement strategy. By defining and distributing information on smart replacement strategies, there would be more demand for them.
Table 3.6. A summary of survey answers.
| No. | Question/Subject | Sample Replies/Reply Summaries |
|---|---|---|
| 1 | Data collection process description | The participants were selected from various locations and asked to define their practices. |
| 2 | Type and size of transit power cables | Sizes ranged from 250 MCM to 3,000 MCM, with the most popular sizes being 500 MCM, 750 MCM, and 1,000 MCM. |
| How many taps per hundred feet? | From no taps to 10 taps per circuit | |
| Maximum number of taps | Spacing between taps is 100 ft to 500 ft. | |
| 3 | Expected useful lifetime of cables | 30 to 40 years |
| Practices to increase useful life | Design considerations include minimizing the heating of cables due to overload. | |
| 4 | Environmental parameters affecting the useful life of transit power cables | Two standout factors are water and temperature. |
| 5 | Physical parameters of the cable design | Jacketing and conduit insulation |
| 6 | How is the degree of degradation determined? | Include the megger test, visual inspection, and a run-to-fail method. |
| Cable monitoring systems | A majority of the participants indicated that they do not have a monitoring system. | |
| 7 | A lifetime guarantee from suppliers | There is no lifetime guarantee provided by suppliers. |
| Maintenance, testing, replacement schedules suggested by the supplier | Suppliers provide support to agencies in case any problems occur. | |
| 8 | Diagnostic tests carried out on transit cables | Megger, hi-pot, and IR testing are the most commonly implemented tests. |
| How often do you need to run these tests? | Agencies generally conduct diagnostic tests when a failure occurs. | |
| 9 | Costs to run each type of test, including the number of operators and time length | Crews usually comprise three to five people. |
| Do you need to stop operations? | If it is a major repair or a replacement, operations need to stop and crews are kept from performing other tasks. | |
| Do any of the tests have the potential to cause damage? | Some tests have the potential to damage the cables. | |
| 10 | Cable inspection and maintenance procedures | Half of the respondents indicated that they did not have established inspection and maintenance procedures. |
| How often do you conduct cable inspection and maintenance? | Most common application is annually. | |
| Types of inspection tests | Most common application is visual inspection. | |
| 11 | What types of repairs are made? | Most common repair is splicing cables. |
| Under what circumstances do you choose repairing the cable in comparison to replacing? | Accessibility of cable for repair | |
| Diagnostic indicators for replacing insulated cables | When cable corrosion is found floating in water-filled manholes during an inspection test, or when a ground short is detected during insulated cable inspections | |
| General costs and durations of repair and replacement | Varies depending on the size and location of the fault in the cables, as well as the number of conductors per circuit | |
| 12 | Is there any replacement strategy, including a “smart replacement strategy”? | Mainly no replacement strategy is applied; 75% of respondents indicated that no strategy is used. |
| 13 | Do you have to stop operations completely during repair and replacement? | In some cases, operation is completely or partially stopped during repairs and replacement. It depends mainly on the location of work. |
| 14 | Failures experienced | About half of the respondents reported experiencing failure. |
| Are the reasons behind the failures known? | The most common failures occur at manholes and joints due to water intrusion. | |
| How do you diagnose failures? |
|


