Transit Traction Power Cables: Replacement Guidelines (2024)
Chapter: 4 Case Studies

CHAPTER 4
Case Studies
4.1 Case Study Structure
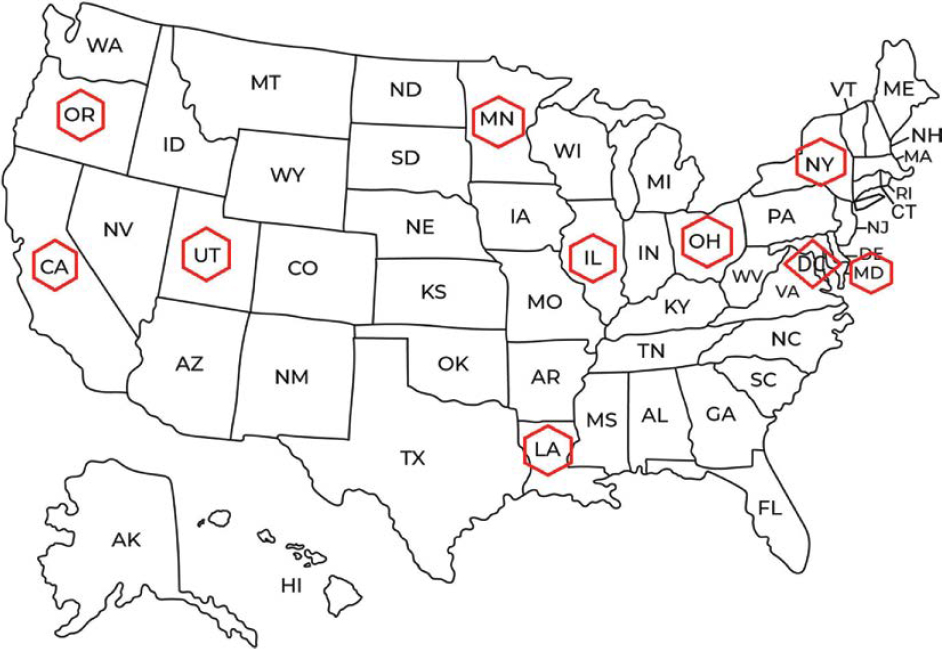
Following on from the survey results, 10 case studies were developed. These case studies were developed to demonstrate maintenance practices from a variety of systems (small, large, old, and new) by engaging industry subject-matter experts experienced in the design, construction, maintenance, and operation of transit traction power systems. Interviews were carried out in the selected locations for the case studies. The case studies were the replacement of Amtrak cables case study and those for agencies in New Orleans, Cleveland, California, New York, Oregon, Utah, Maryland, Minnesota, and Washington, DC. The selected case study locations are shown in Figure 4.1, and the relevant tables are shown in the following:
- Case Study 1: Greater Cleveland Regional Transit Authority (Table 4.1).
- Case Study 2: New Orleans Regional Transit Authority (Table 4.3).
- Case Study 3: Bay Area Rapid Transit (Table 4.5).
- Case Study 4: New York City Transit (Table 4.14).
- Case Study 5: Amtrak (Table 4.15).
- Case Study 6: Tri-County Metropolitan Transportation District of Oregon (Table 4.17).
- Case Study 7: Utah Transit System (Table 4.24).
- Case Study 8: Maryland Transit Administration (Table 4.25).
- Case Study 9: Washington Metropolitan Area Transit Authority (Table 4.26).
- Case Study 10: Metro Transit (Table 4.27).
The interview process was developed as shown in the process flowchart in Figure 4.2. In Figure 4.3, development of the case study procedure is provided. Case studies cover different parts of the country and a variety of applications. Interview details were sent to each interviewee before the interview to ensure that the interviewee understood each question. When a time for the interview was established, the research team either visited or had a teleconference with each interviewee. All the answers and related information were documented.


4.2 Case Study 1: Greater Cleveland Regional Transit Authority
Table 4.1. Greater Cleveland Regional Transit Authority.
| Type of Service | Length (miles) | Age (years) | Electrification System (voltage, current type, contact system) | |
|---|---|---|---|---|
| Tram (streetcar, trolley) | — | — | — | |
| Light rail | 17 | 44 for Blue Line and Green Line and 23 for Waterfront Line | Overhead catenary system. 600 V DC | |
| Rapid transit (metro, subway, underground) | 20 | Approx. 50 | Overhead catenary system. 600 V DC | |
| Concept | Current Practice | |||
| Quick view | A weekly (riding) visual inspection is performed in which maintenance workers observe the overhead catenary system for defects. Every 6 months, a walking inspection is performed (in the fall and spring) where maintenance workers can work at a slower pace and visually inspecting for defects from the ground. Defects noted during either inspection are then inspected more closely and repaired as soon as possible by a secondary crew. There is also a hands-on inspection performed using work equipment with an elevated platform so that crews can physically touch and inspect the overhead catenary system. Bolted connections and overhead equipment such as section insulators, pullovers, splices, and feeder cables are inspected during this annual preventive maintenance task. Manhole inspections are performed every 6 months, and manholes are routinely checked in between inspections to pump any water from the holes. Issues with manholes are some of the most significant because of their locations. Many are in or near parking lots and roadways, and some issues with roadway salt have been seen during winter months. | |||
| Summary | Degree of degradation | The agency determines the degradation and condition of feeder cables through routine maintenance. It inspects the overall appearance of the cable and its bolted electrical connections. It looks for signs of weathering, fire or heat damage, and cuts/tears in the jacket that may have been caused by accidents or damage from falling tree limbs. These inspections have various intervals, ranging from every 6 months for routine visual inspections to a more in-depth hands-on inspection annually. In the manholes mentioned previously, it looks for indications of failure due to heat in the manhole or steam coming from potential water. It looks at the water to observe its color (green could indicate failure), and observes the cable for degradation. | ||
| Diagnostic indicators | The agency does not perform diagnostic testing on feeder cables. The recommendation from APTA is specific for cables in conduits, duct banks, and troughs, because these cables may be susceptible to rodents or degradation due to moisture and electrolysis. Insulation-resistance testing is also only recommended when the integrity of the cable is suspect. The current inspection and maintenance schedule is adequate to inspect the feeder cable to observe any potential issues and damage to the existing cables. | |||
| Influencing factors | Temperature plays a more significant factor in bare copper conductors than in feeder cables. However, the agency has many bridges that run along the right-of-way so salt in the winter can play a factor with the equipment. The agency sees more deterioration of the bridges and components attaching to the bridges than they do to the cables, but it does play a role. It has also had issues in the past with rodents with fiberoptic cable where the cable ran in an overhead raceway. It has since removed the cable from that suspension system and has not had any further issues. On the light-rail system, there are manholes in which feeder cables exit the substation into the manholes and run through conduits to the overhead system. | |||
| Replacement strategies | The agency does not currently have a cable replacement program. Cables in recent years have really only been replaced as part of substation renewal projects through the engineering department, and the cost information is not made available to the maintenance division. The types of costs are shown in Table 4.2. | |||
| Smart replacement strategy | The agency does not currently have a smart replacement strategy. | |||
Table 4.2. Cost categories and parameters for cable replacement.
| Category | Parameters |
|---|---|
| Failure or unplanned interruption cost | Average hourly power consumption |
| Average unplanned interruption time in hours | |
| Power outage costs | |
| Time-dependent power outage cost | |
| Average failure costs | |
| Maintenance cost | The average cost of diagnostic tests and inspection is negligible compared to repair and replacement cost. |
| Average maintenance cost for cable | |
| Repair cost | The average repair cost of a single failure |
| The average repair cost of multiple failures | |
| Cost of replacement | Cost of new cable |
| Cost of installation | |
| Replacement cost of cable |
4.3 Case Study 2: New Orleans Regional Transit Authority
Table 4.3. New Orleans Regional Transit Authority.
| Type of Service | Length (miles) | Age (years) | Electrification System (voltage, current type, contact system) | |
|---|---|---|---|---|
| Tram (streetcar, trolley) | 625 | 20 | DC | |
| Light rail | — | — | — | |
| Rapid transit (metro, subway, underground) | — | — | — | |
| Commuter rail | — | — | — | |
| Other (please state the type) | — | — | — | |
| Concept | Current Practice | |||
| Quick view | Traction power personnel perform complex and specialized troubleshooting, preventive and corrective maintenance, and overhauls of the traction power substation and overhead contact system and their associated subsystems. The traction power maintenance team is responsible for ensuring that all equipment is working and aligned properly to prevent damage to the system and rail vehicles. The team also provides emergency response and can be called on for support in other areas, such as light-rail service, special events, streetcars, and public safety and service. | |||
| Summary | Degree of degradation | There is no procedure to determine the degree of degradation. Cables are checked physically at a certain period. The majority of the cables are underwater, and that makes the determination procedure difficult. | ||
| Diagnostic indicators | The agency checks the substations. If there is a heat increase in the substation, this is an indicator for the maintenance crew. They do not have time to stop operations for regular check-ups. Therefore, they check the substations regularly. They visual inspect manholes and taps. | |||
| Influencing factors | For overhead cables, trees are the main environmental factors. They create some problems in case of extreme weather conditions. The other problem is that the city is below sea level, creating a situation where cables are underwater in their service life. Over time, water penetrates the cables. | |||
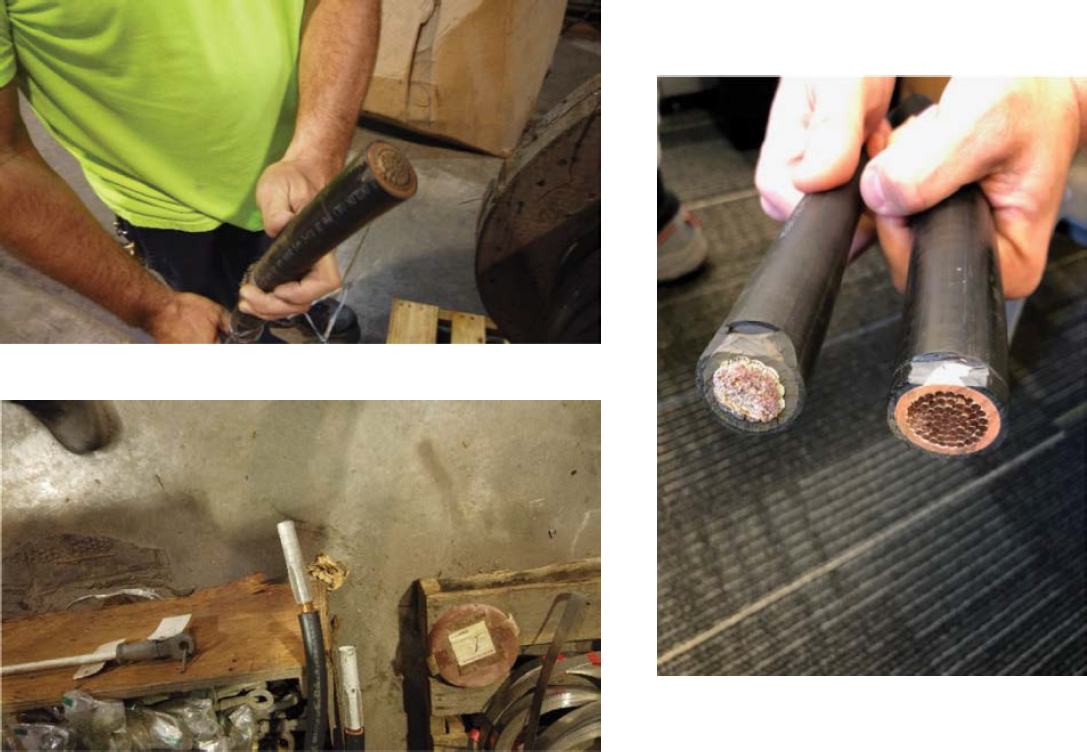
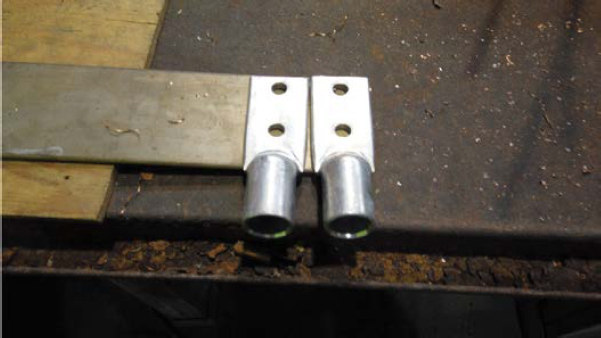
| Replacement strategies | The agency created a cable jacket to increase the cable life cycle, as seen in Figure 4.4. It designed its own taps, which help prevent water from entering the taps. It places the taps in PVC-sealed cages. It uses a specific type of taps for aluminum cables, as seen in Figure 4.5. Figure 4.6 shows the tap connectors used by New Orleans Regional Transit Authority. Table 4.4 presents cable replacement problems and outcomes. | |||
| Smart replacement strategy | The agency does not currently have a smart replacement strategy. | |||
Table 4.4. Cable replacement problems and outcomes.
| Possible Problem | Outcome | Occurrence |
|---|---|---|
| Declining cable reliability | Same reliability as new cable | Based on condition |
| Spending more than $10/ft to solve power cable reliability problems | 50% cost reduction | Rarely seen |
| Insufficient maintenance budget for cable failures | Shift cost of cable failures | Majority of the cases |

4.4 Case Study 3: Bay Area Rapid Transit
Table 4.5. Bay Area Rapid Transit.
| Type of Service | Length (miles) | Age (years) | Electrification System (voltage, current type, contact system) | |
|---|---|---|---|---|
| Tram (streetcar, trolley) | — | — | — | |
| Light rail | — | — | — | |
| Rapid transit (metro, subway, underground) | 121 | 45 | AC, DC, and third rail | |
| Commuter rail | — | — | — | |
| Other (please state the type) | — | — | — | |
| Concept | Current Practice | |||
| Quick view |
Bay Area Rapid Transit (BART) trains run on 100% electric power. Its 30-year-life assets are 45 years old. The system has 68 traction power substations, over 700 high-voltage circuit breakers and switchgears, and over 1.5 million linear feet of cabling. San Francisco and Transbay Tube are the most fragile parts of the system and have failed previously. BART does not have standby traction power capability. Table 4.6 presents the system’s traction power maintenance plan. Table 4.7 presents actions and procedures and power removal, and Table 4.8 shows maintenance-of-way actions and procedures. In Table 4.9, procedures for red tag holders, restoration of power, safety, security, and maintenance are shown. In Table 4.10, the primary objectives of the preventive maintenance program are given. Figure 4.7 presents substation inspection, maintenance, and safety. Table 4.11 gives procedures for training and configuration. In Table 4.12, the traction power technician definition and responsibilities are presented. In Table 4.13, a weekly checklist is provided. |
|||
| Summary | Degree of degradation | The agency does not monitor degree of degradation. Regular failures of any type will begin a process to replace all such cables. | ||
| Diagnostic indicators | Hi-pot, meggering, and thumb test. The agency only tests cables in less busy periods to not cause any problems in the service. | |||
| Influencing factors | Experience shows temperature has the most effect on the system. For the BART system, cable structure, such as pipe-type cables, have most effect; changing all to EPR increases the useful life. | |||
| Replacement strategies | Typically, if a cable is damaged, splicing with new cable is done if it’s EPR; otherwise the whole section is replaced. Cost and duration depend on the size and location of the fault. | |||
| Smart replacement strategy | The agency is implementing a new monitoring system. | |||
Table 4.6. Summary of BART traction power maintenance plan.
| The traction power maintenance plan documents the operations and maintenance procedures necessary to deliver transit services in a safe, dependable, and efficient manner, and provide quality transit service. | |
| Actions | Explanation |
| Traction power maintenance | The agency should have maintenance procedures in place to maintain all traction power components within the system. A well-established traction power maintenance program that operates according to rigorous standards in an effort to provide high-quality and highly reliable support for streetcar service should be maintained. The agency should perform scheduled inspections and corrective maintenance and overhauls of traction power substations, the overhead contact system, and its associated subsystem and streetcar signalization. |
| The agency’s traction power substation, overhead contact system, and street signalization scheduled maintenance programs are designed to sustain reliability by detecting potential defects and correcting them before a failure. |
|
| Maintenance details | The details of each inspection activity should be described, as necessary, in step-by-step internal agency maintenance documentation and vendors’ maintenance manuals as well as agency standard practice bulletins, standard operating procedures, and maintenance directives located at the maintenance facility. |
| Completed preventive and corrective maintenance activities are documented on the maintenance reporting forms, reviewed, and submitted to the supervisor on duty and entered into the maintenance reporting system. | |
| It is a good practice to have preventive maintenance inspections completed before returning substations back online. | |
| Lock out, tag out | Red tag form: A form that details areas and responsibilities for removal and restoration of traction power permitted areas. |
| Red tag holder: Individual who accepts and releases work authorization. | |
| Voltmeter: The device used to prove removal/restoration of power to the overhead catenary system. | |
Table 4.7. Actions and procedures for power removal and restoration.
| Power Restoration | |
|---|---|
| Case | Procedure |
| 1 | Agency personnel may have power removed when necessary to perform any activity where the potential exists for personnel or equipment to come in contact with dangerous voltage. |
| 2 | Agency personnel removing power for their own maintenance activities are not required to fill out a red tag form. All other steps in this procedure apply to their scope work. |
| 3 | Requests for scheduled power removal and restoration must be made in writing through the trackway allocation process and authorized by the director of safety and security. |
| 4 | The concerned personnel will govern authorization for power removal and restoration under all circumstances. |
| 5 | The governing body may perform removal and restoration of power should the request be granted. |
| Power Removal | |
| Case | Procedure In an emergency, the request for power removal may be granted immediately. |
| 1 | Ensure that all streetcars are clear of affected area prior to removal of power. |
| 2 | Ensure that flags and cones are installed indicating area that is to have power removed. |
| 3 | Initiate power removal by contacting maintenance-of-way and requesting the governing breaker or sectionalizing switches to be opened, locked, and tagged. |
| 4 | Ensure that qualified personnel check the circuit or apparatus with a voltmeter to ensure power removal prior to authorizing the next step in the procedure. |
| 5 | Ensure that grounding devices are applied. |
Table 4.8. Maintenance-of-way actions and procedures.
| Action | Procedure |
|---|---|
| 1 | Notify the operation crew of intended actions. |
| 2 | Receive authorization from operation crew and proceed as directed. |
| 3 | Place flag protection at boundaries of affected operation crew section. |
| 4 | Verify voltmeter by using a live–dead test. |
| 5 | Open, rack to test position, and install lock and do-not-operate tag onto appropriate DC breaker. |
| 6 | Operate sectionalizing and bypass switches, as appropriate. |
| 7 | Retest line using voltmeter to verify that there is no current in the line. |
| 8 | Test overhead catenary system to ensure power removal. |
| 9 | Install grounds onto overhead catenary system at locations that provide protection for personnel and equipment, and where they are visible to work crew. |
Table 4.9. Procedures for red tag holders, restoration of power, safety, security, and maintenance.
| Items | Procedure |
|---|---|
| 1 | Is thoroughly familiar with the red tag procedure. |
| 2 | Signs receipt of red tag form from maintenance-of-way (MOW); understands that it is their protection from power restoration. |
| 3 | Maintains direct communications with the operation crew. |
| 4 | Ensures that all personnel and equipment comply with procedures. |
| 5 | Complies with all rules and directions received from the operation crew and MOW. |
| 6 | Stays at work site with red tag form. |
| 7 | Clears personnel and equipment from the right-of-way in a timely manner. |
| 8 | Relinquishes red tag form at agreed-upon time to MOW. |
| 9 | Coordinates with the operation crew on issues concerning work permit and red tag form prior to entering work area. |
| Restoration of Power | |
| Action | Procedure |
| 1 | MOW accepts red tag from the assignee, ensuring that all personnel and equipment are clear of the affected area. |
| 2 | Notify operation crew of the intended actions to ensure that personnel and equipment are clear of the right-of-way. |
| 3 | Remove grounds after receiving authorization. |
| 4 | Remove the lock and lock-out tag from the affected breaker/switch. |
| 5 | If another lock or lock-out tag is on equipment, stop and notify the operation crew. |
| 6 | Switch the breaker to the closed position. |
| 7 | Removes red flags/cones from the affected area. |
| Safety, Security, and Maintenance | |
| Safety and security | Safety and security are the primary goal. All efforts will be taken to ensure that streetcars, facilities, infrastructure, and equipment are maintained and operated to the highest standards in accordance with federal and state regulations and industry best practices. The agency services will comply with safety oversight regulations to ensure reliable service to the agency’s passengers. |
| Infrastructure maintenance | The agency MOW manager will be responsible for managing the right-of-way and infrastructure. |
Table 4.10. Primary objectives of preventive maintenance program.
| Action | Procedure |
|---|---|
| Objective | Maximize the safety, comfort, and convenience of passengers and employees.. |
| Protect property and equipment. | |
| Minimize system downtime. | |
| Minimize operating costs. | |
| Ensure operational safety and dependability. | |
| Minimize system maintenance costs | |
| Preventive Maintenance | |
| Maintenance | Preventive maintenance programs are in place to detect and correct potential problems before they cause an asset to fail in service. Preventive maintenance practices also provide the opportunity to perform essential routine tasks, including lubrication, measurement, and adjustment, at regular intervals. Preventive maintenance is a program of progressive scheduled inspections and servicing. |
| Inspection | Inspections are performed by the agency’s traction power maintenance technicians under the supervision of maintenance management. The inspection comprises a visual inspection as outlined and recommended by APTA standards to identify potential safety defects or abnormal conditions. Essential items to be inspected are overhead feeder clamps, contact wire wear, fasteners, frogs, crossovers, and current actors. Inspection, cleaning, lubrication, and servicing are scheduled tasks and performed at specified intervals. |
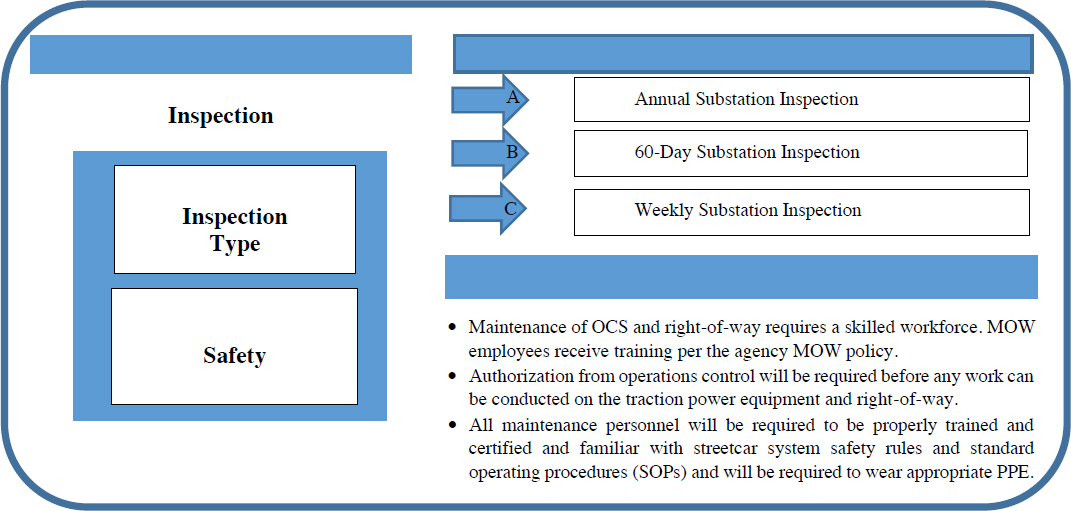
Figure 4.7. Substation inspection, maintenance, and safety.
Table 4.11. Training procedures and configuration.
| Training Program Training for traction power substation crew employees includes classroom training, testing, and hands-on job training from the approved agency. Employees will be required to participate in 64 hours of training |
||
| Training Module 1 | Training Module 2 | Training Module 3 |
| Electrical concepts Electrical formulas Electrical power systems Commonly used symbols Abbreviations Device table definitions |
Safety summary Safety precautions Electrical shock |
Building configuration General information Theory of operation Fire alarm system Master panel 350 kVA rectifier transformer 1,120 kVA rectifier transformer |
| Theory of operation Operation and maintenance manual for dry-type transformer 12-pulse rectifier 300 kW 600 VDC 12-pulse rectifier 1,000 kW 600 DC 600 V DC switchgear 1,000 V DC main circuit breaker 1,000 V DC feeder circuit breaker |
||
Table 4.12. Traction power technician definition and responsibilities.
| Definition The traction power technician, under minimal supervision, will perform complex and specialized troubleshooting, preventive and corrective maintenance, and overhauls of traction power substation and overhead contact systems and their associated subsystems. The traction power technician will be responsible for ensuring that all equipment is working and aligned properly to prevent damage to the system and rail vehicles. The traction power technician will provide emergency response and will be called on to provide support for other activities and areas of the system, such as light-rail service, special events, streetcars, and public safety. |
| Responsibilities |
Maintains, troubleshoots, and repairs all equipment related to the rail power system. This includes all rail mainline and rail maintenance facilities, such as high-voltage AC/DC switchgears, rectifiers, transformers, breakers, active disconnect devices, interlocks, and overhead contact system, including 1,000 MCM wire tensioned at 3,000 lbs and associated hardware such as poles, fasteners, hangers, arms, insulators, disconnect switches, feeder cables, and gliders. |
Table 4.13. Weekly maintenance checklist.
Date: ____________________________________
Location: _________________________________
Electrician(s): _____________________________
Work Order Number: _______________________
| Technician Initials | Procedures | Description |
Comments
Electricians Signature(s):
Agency Supervisor(s) Signature:
4.5 Case Study 4: New York City Transit
Table 4.14. New York City Transit.
| Type of Service | Length (miles) | Age (years) | Electrification System (voltage, current type, contact system) | |
|---|---|---|---|---|
| Tram (streetcar, trolley) | — | — | — | |
| Light rail | — | — | — | |
| Rapid transit (metro, subway, underground) | — | 100+ | 625 V DC third rail | |
| Commuter rail | — | — | — | |
| Other (please state the type) | — | — | — | |
| Concept | Current Practice | |||
| Quick view | Installation considerations: cable pulling, cable weight, duct fill ratio, ampacity, and splicing. | |||
| Summary | Degree of degradation | There is no cable monitoring. There is no testing unless cables are temporarily disconnected and inactive. | ||
| Diagnostic indicators | No tests are done regularly. | |||
| Influencing factors | Operating temperature is freezing to above 100-degrees Fahrenheit; wet or dry. 625 volts circuit use 2,000 VDC insulation level, typically pulled in fiberglass cover from duct banks. |
|||
| Replacement strategies | Cable repair would only be done in an emergency. Cables would be replaced during scheduled maintenance. Historically, some failures have been experienced because of mechanical damage. In 2010, New York City Transit (NYCT) decided to implement communications-based train control (CBTC) based train control and signals. Prior to this, trains operated 15 to 18 tons per hour (TPH) 600 V DC electric motors in series parallel mode. To implement this change, NYCT bought new 143 train cars that use AC induction motors with insulated-gate bipolar transistor (IGBT) inverters and CBTC input for modulation and brakes. However, the substations, which are roughly a mile apart, and associated power 1,000 V DC positive and negative cables, were not modernized as part of capital program. The DC trains use roughly 5,500 A to start and 2,600 A to run; AC trains use 8,000 A to start and 3,000 A to run. With CBTC, 30 TPH can be run, making better use of right-of-way and reduced crowding on trains. The cost is that the cables run very hot and there are more cable and substation overloads. |
|||
| Smart replacement strategy | There is no smart strategy. | |||
| Review and update | Performance criteria are set as electrical characteristics, thermal performance, and resistance to water ingression and moisture. | |||
4.6 Case Study 5: Amtrak
Table 4.15. Replacement of Amtrak’s 12 kV PILC traction power cables.
| In this case study, in addition to interviews, a study by Levi and Shah (2018) was used in the examples. The case study is the replacement of Amtrak’s 12 kV PILC traction power cables. PILCs have higher dielectric strength, a lower dissipation factor, and lower dielectric loss than XLPE or EPR. XLPE performs better than EPR. PILC does not suffer from thermal expansion like EPR and XLPE. EPR has better overload tolerance than XLPE. Lead leakage from PILC cables is the main concern. The PILC lead sheath is completely impermeable; moisture ingress can occur at a rapid rate if the PILC sheath is damaged. EPR has better moisture resistance properties than XLPE. Figure 4.8 illustrates the Amtrak 12 kV distribution for this case study. |
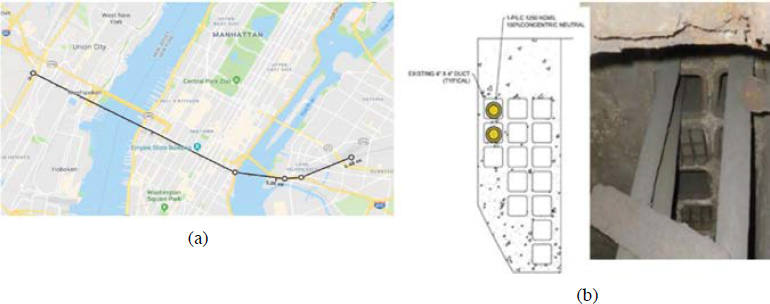
Figure 4.8. Amtrak 12 kV distribution (a) Amtrak MV cable system, (b) existing square duct configuration. |
|
PILC cables have been used since the late 1800s. They are resilient. Amtrak PILC cables have been used for nearly 90 years. The concerns are mainly a lack of splicer skills and that the cables are difficult to maintain. Underground cable design has evolved. Aging increases the probability of failure. PILC cable life is 44 years typically. The oldest installations are 70 to 90 years old; the mean age is 80 years (Levi and Shah 2018). Current design life of EPR cables is predicted to be 40 years (New York Department of Public Service 2021). In Figure 4.9, a sample PILC cable failure is seen. Thermal failure, primarily due to moisture ingress, tends to increase insulation conductivity and accounts for approximately 40% of failures. The electrical phenomenon is partial discharge, which accounts for approximately 60% of failures. Table 4.16 and Figure 4.10 present a comparison of cables in use. |
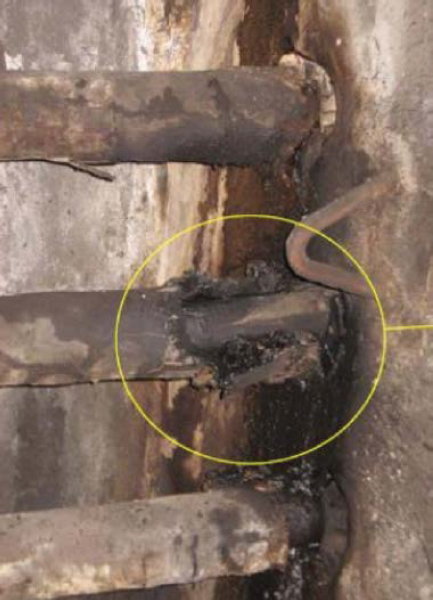
Figure 4.9. A sample PILC cable failure. |
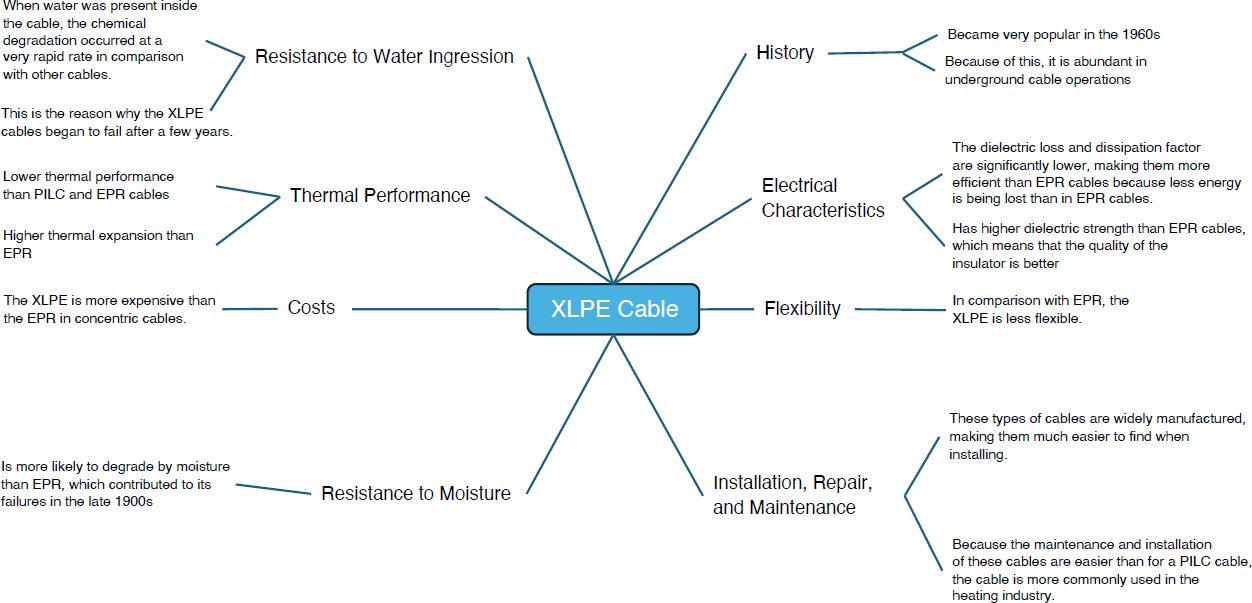
Table 4.16. Comparison of PILC, EPR, and XLPE cables.
| PILC Cables | History | PILC cable has longer usage history, and there is more information on reliability than for EPR and XLPE cables. The first PILC cables were installed in 1890, and some are still in use. |
| Characteristics | The impregnated paper insulation of PILC cable has excellent electrical properties, such as higher dielectric strength, a lower dissipation factor, and lower dielectric loss than EPR and XLPE. | |
| Resistance to water ingression | Of all the water-blocking sheaths, including the polymeric sheath in EPR, the lead sheath is the only one that is completely impermeable to water ingression and humidity diffusion. | |
| Thermal performance | Impregnated paper insulation does not expand during heating, unlike polymeric insulation, including EPR. | |
| Flexibility | PILC cable is more rigid than the EPR and XLPE cables, especially in larger sizes. | |
| Resistance to water | The impregnated paper insulation of PILC cables is highly susceptible to deterioration if the lead sheath gets damaged and water gets past the sheath. | |
| Installation, repair, and maintenance | Installation, repair, and maintenance of PILC cables are more intensive, complicated, and time-consuming than for EPR and XLPE cables. | |
| Costs | The initial and maintenance costs of PILC cable are higher than for EPR cable. | |
| EPR Cables | History | The development of EPR cable only began in 1960. EPR cable has the smallest share of underground cables in operation. |
| Characteristics | EPR cable has lower dielectric strength, a higher dissipation factor, and higher dielectric loss than PILC cable. | |
| Resistance to water | EPR cable has less resistance to water ingression than PILC cable does. | |
| Thermal performance | EPR cable has lower thermal performance than PILC cable and higher thermal performance than XLPE in terms of overload capability and longevity. | |
| Flexibility | The superior flexibility of EPR cable is a great benefit in larger sizes. | |
| Resistance to moisture | EPR is a solid dielectric insulation, and it is highly resistant to deterioration. | |
| Installation, repair, and maintenance | EPR cable is easier to install, repair, and maintain than PILC cable. EPR cable is lighter than PILC and uses commercially available splicing and terminating components. | |
| Costs | EPR cable has much lower initial and maintenance costs than PILC cable. | |
| XLPE Cables | History | XLPE gained popularity during the 1960s. It was the material of choice due to its ease of processing and handling. The share of XLPE is higher than EPR |
| Characteristics | The dielectric strength of XLPE is much higher than that of EPR. The dissipation factor and dielectric loss of XLPE are also significantly lower than those of EPR. | |
| Resistance to water | XLPE cable is prone to water-tree degradation at a much more rapid rate than EPR. | |
| Thermal performance | As with EPR, XLPE applications are limited by thermal constraints. However, XLPE has higher thermal expansion than EPR. | |
| Flexibility | XLPE cable is less flexible than EPR cable of the same size. | |
| Resistance to moisture | XLPE has a higher degree of susceptibility to moisture-related degradation than EPR. | |
| Installation, repair, and maintenance | The installation, splicing, repair, and maintenance methods of XLPE and EPR cables are comparable. | |
| Costs | Nonconcentric XLPE is more expensive than nonconcentric EPR. |

4.7 Case Study 6: Tri-County Metropolitan Transportation District of Oregon
Table 4.17. Tri-County Metropolitan Transportation District of Oregon.
| Type of Service | Length (miles) | Age (years) | Electrification System (voltage, current type, contact system) | |
|---|---|---|---|---|
| Tram (streetcar, trolley) | — | — | — | |
| Light rail | 62 | 20 | 750 V DC overhead catenary system | |
| Rapid transit (metro, subway, underground) | — | — | — | |
| Commuter rail | — | — | — | |
| Other (please state the type) | — | — | — | |
| Concept | Current Practice | |||
| Quick view | The agency typically does a hard visual inspection on cables during the meggering process. It also does a visual inspection on feeder cables inside the substation during annual track feeder breaker inspections. | |||
| Summary | Degree of degradation | Degradation has not been something the agency has been able to quantify. No cable monitoring systems are in use. | ||
| Diagnostic indicators | In the past, the agency measured insulation resistance by meggering, but results were varied, and failures occurred on supposedly good cables, so currently it is in a run-to-fail mode. | |||
| Influencing factors | Splices and taps are subjected to seasonal water immersion in underground vaults. | |||
| Replacement strategies | There is no replacement strategy. The agency tries to do replacement work during nonrevenue hours or in combination with other work outages. The failed cable can be taken out of service and operations can resume. | |||
| Smart replacement strategy | None | |||
| Review and update | Considerations in practice: cable life, cable failure modes, installation, environmental issues, manufacturability, and cost. | |||
| Examples | Figure 4.11 presents samples of physical and animal damage. Figure 4.12 summarizes the megger test procedure. Figures 4.13 and 4.14 present responses to questions that were sent to agencies. Figures 4.15 to 4.18 show images related to construction practices. Figures 4.19 and 4.20 show examples of cable failures. Figure 4.21 shows a rail-to-ground voltage monitor display, and Figure 4.22 shows splice details. Figure 4.23 presents electrification details. | |||

Feeder Cable Meggering Procedure
Technicians log readings at 1 min, 3 min, and 5 min to allow the readings to stabilize as the cable is subjected to 1,000 V DC. However, many cables are not that long, the voltage is not that high, and the readings typically stabilize within a minute. (Modern digital meggers are much better than the ones built in the 1970s.) Currently, the readings are logged once stable. Feeder cable meggering is a straightforward procedure; steps are listed in Figure 4.12.

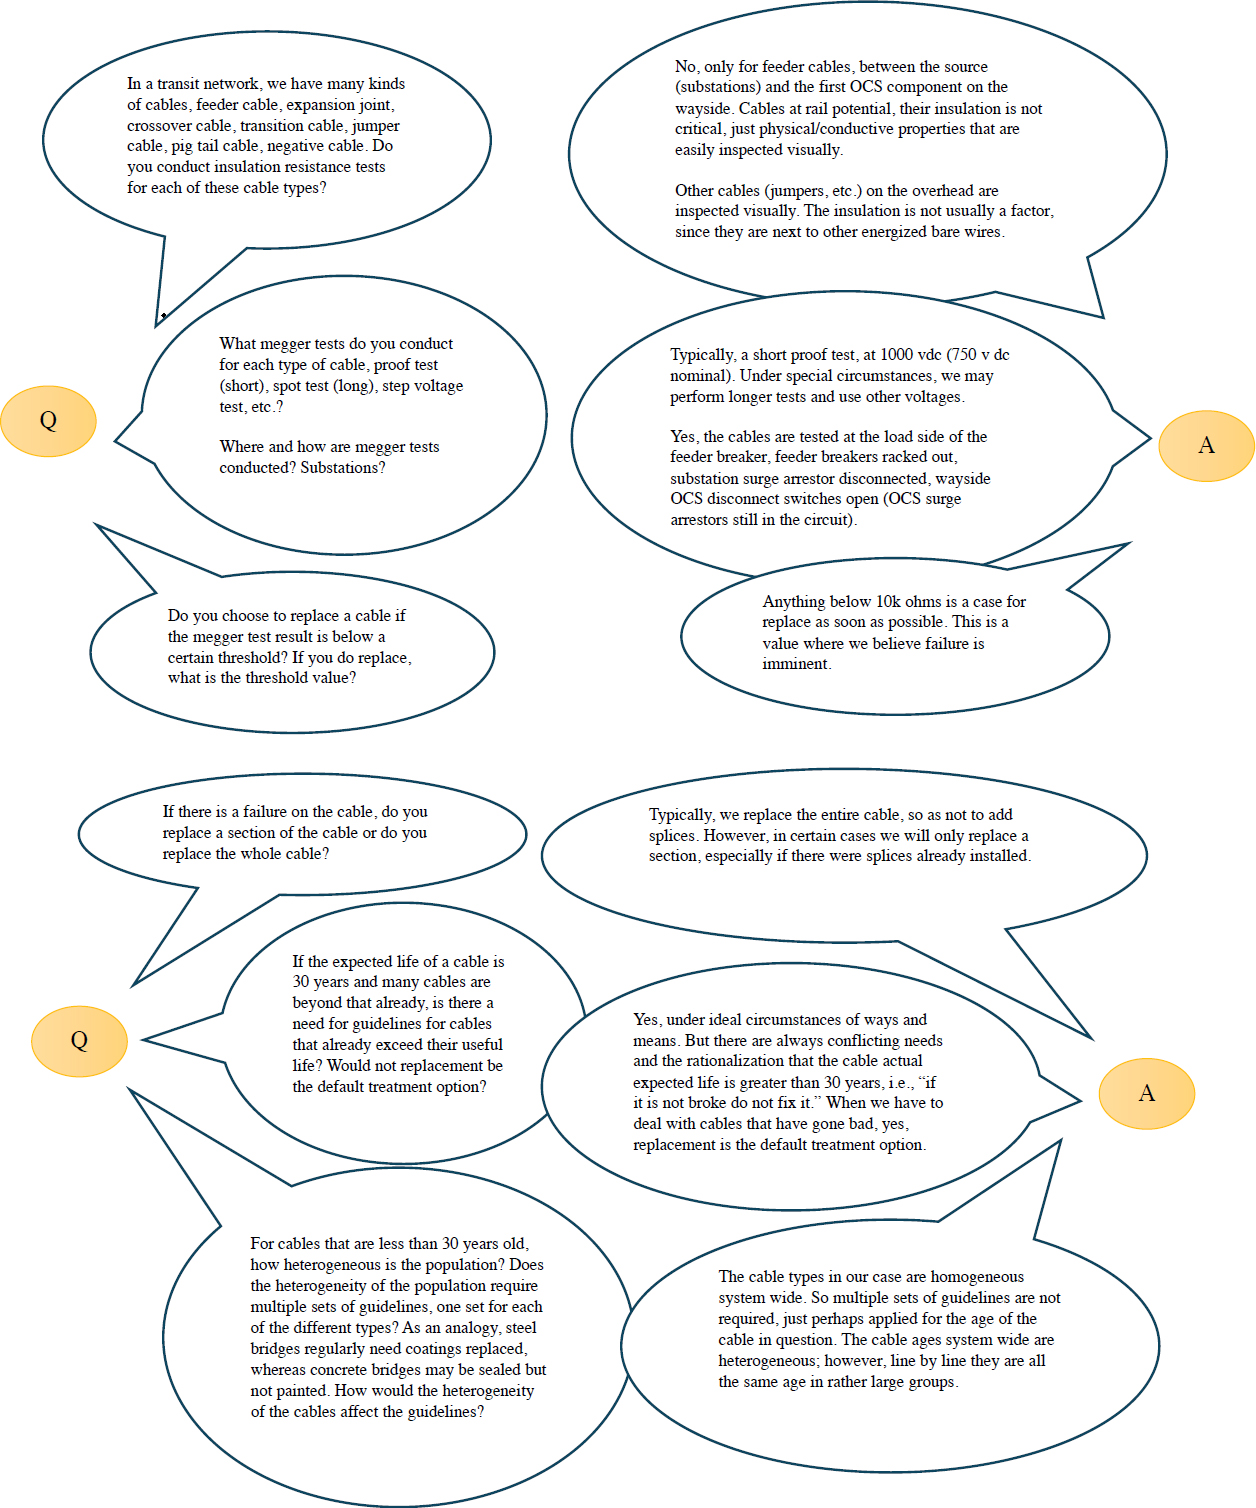
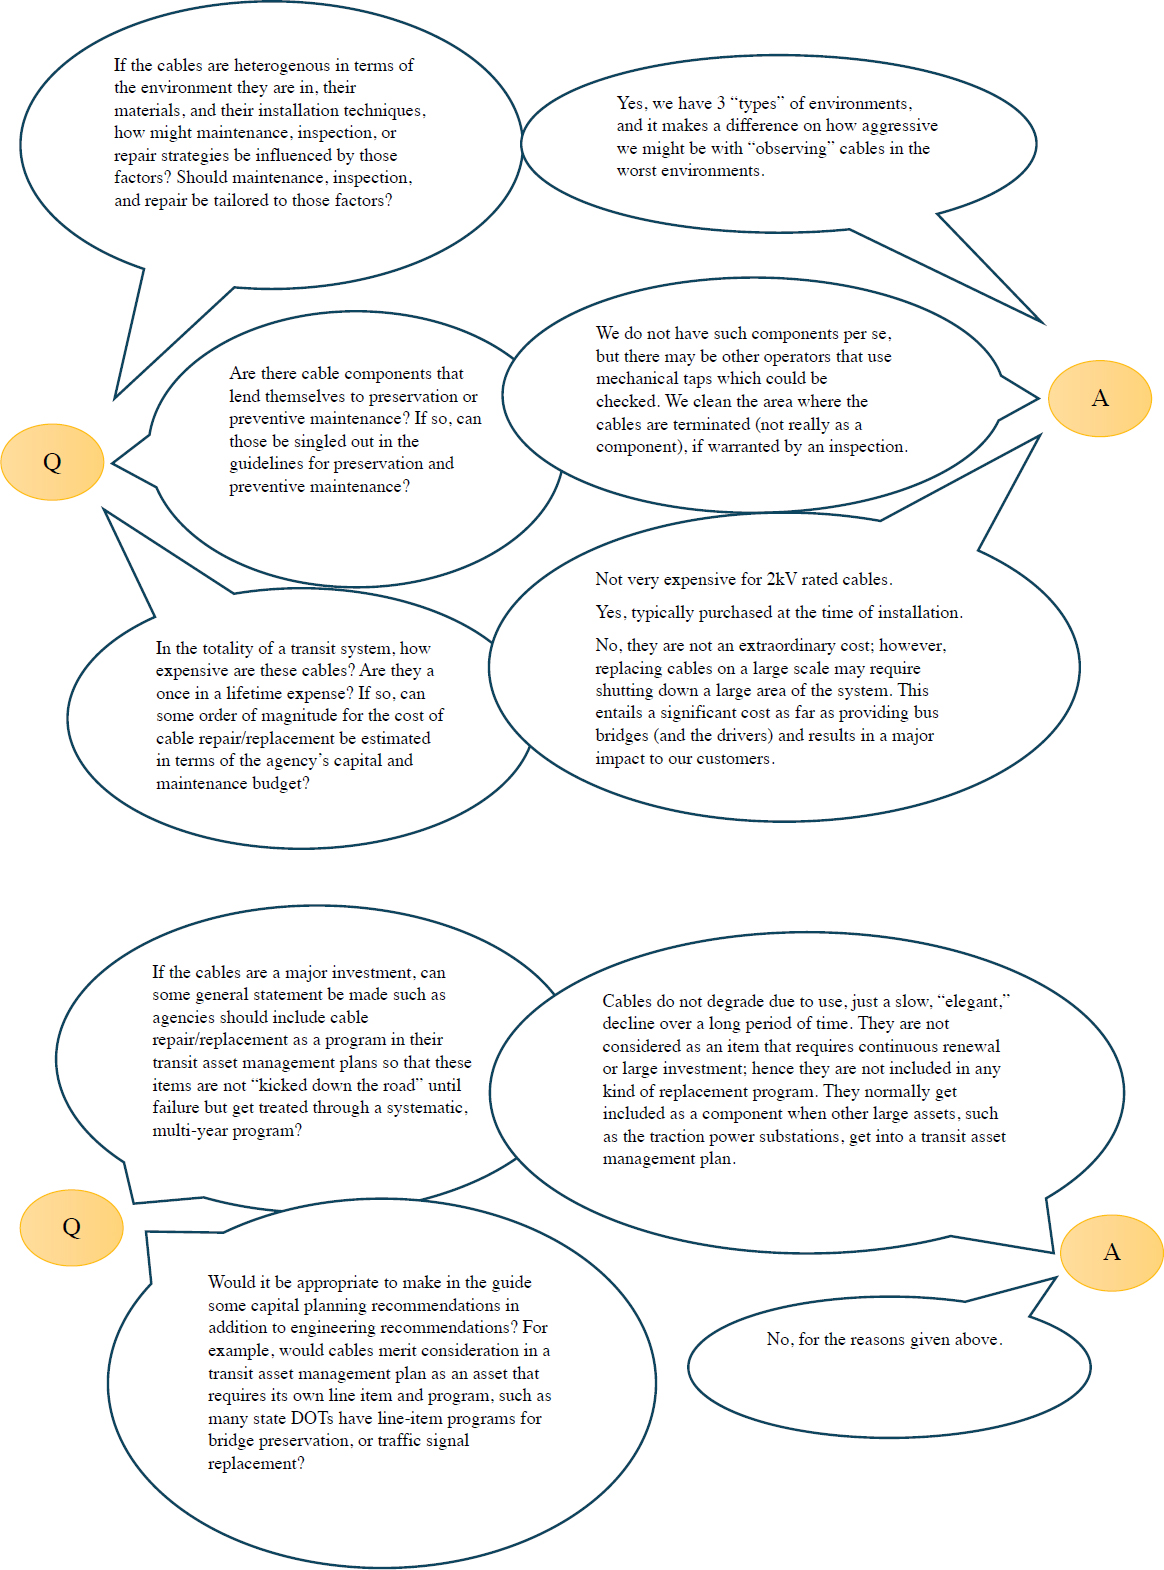

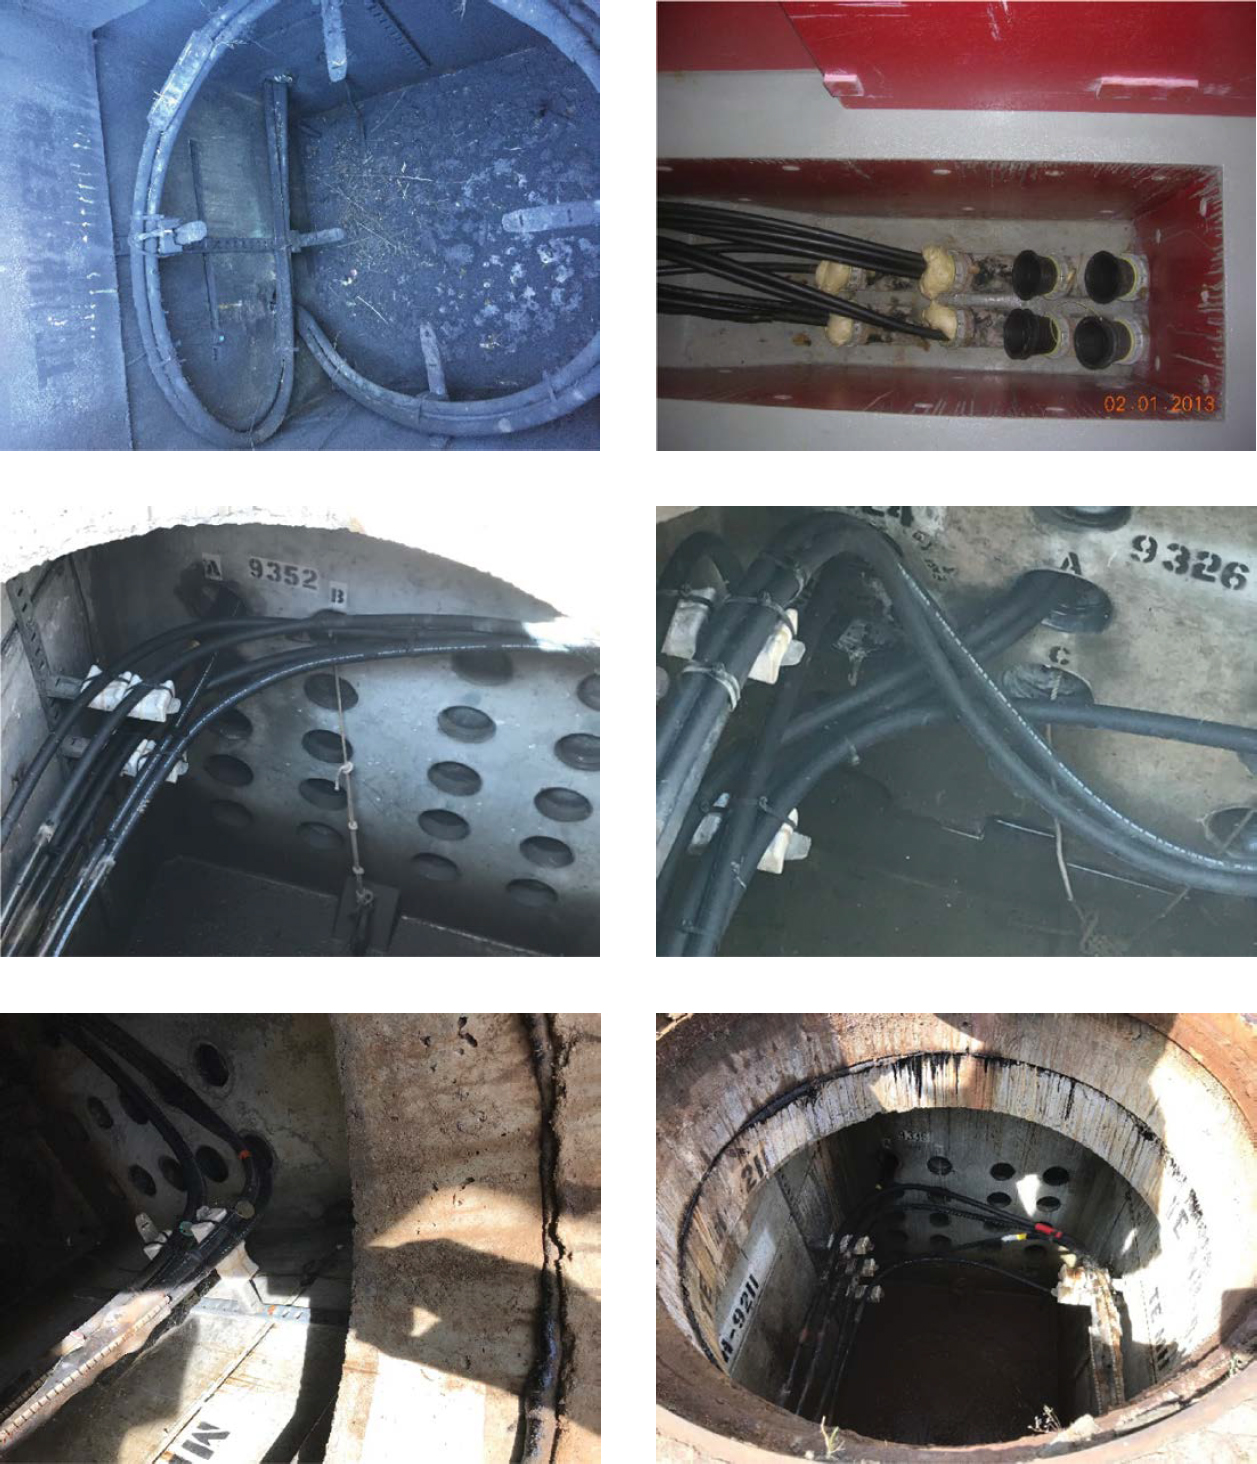


Figure 4.21. Rail-to-ground voltage monitor display.

Figure 4.22. Splice details.

Figure 4.23. Electrification details.
Table 4.18 through Table 4.23 present typical records of feeder cable meggering; Figures 4.24 to 4.29 show the change in cables. In Table 4.18 and Figure 4.24, East Portal #19 feeder cable megger log information is presented. The second log at East Portal is given; this was when the F1 cable failed, and the log was part of the troubleshooting process. In Table 4.19 and Figure 4.25, Bybee #61 cable megger log information is presented. In Table 4.20 and Figure 4.26, for Sunset #23, the cables are in a duct bank and would be rated good to very good as far as seasonal water exposure. In Table 4.21 and Figure 4.27, Hawthorn Farm #34 provides another dataset. There is moderate seasonal water exposure. Both substations were built in 1997/1998. In Table 4.22 and Figure 4.28, Fuller #54 cable megger log information is presented. The Fuller duct bank has moderate to severe water intrusion. In Table 4.23 and Figure 4.29, Steel Bridge #3 cable megger log information is presented. The duct bank is in fair shape.
Table 4.18. East Portal #19 feeder cable megger log.
| Feeder Cable Megger Log | ||||
|---|---|---|---|---|
| Substation East Portal #19 | ||||
| Date | F1 Cables (Ω) | F2 Cables (Ω) | F3 Cables (Ω) | F4 Cables (Ω) |
| 2/15/2005 | P 220 M | P 6.75 G | N/A | P 10.1 G |
| 1/20/2007 | P 428 M | P 10.9 G | N/A | N/A |
| 3/8/2007 | N/A | N/A | N/A | P 10.0 G |
| 11/20/2013 | N/A | N/A | N/A | P 13.4 G |
| 11/24/2013 | N/A | 15 G | N/A | N/A |
N/A = not available; P = point.
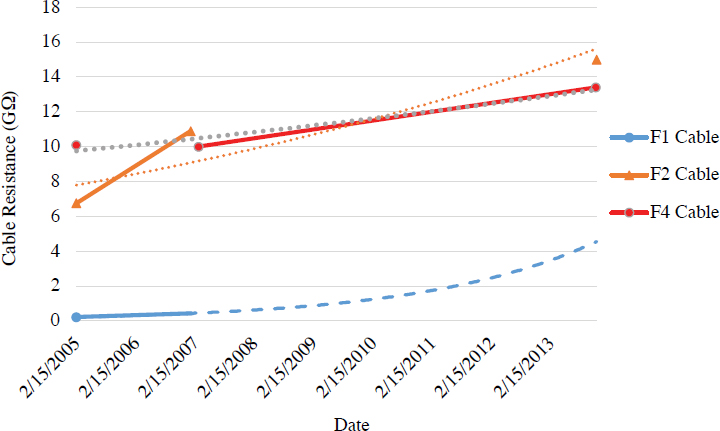
Table 4.19. Bybee #61 cable megger log.
| Feeder Cable Megger Log | ||||
|---|---|---|---|---|
| Substation Bybee #61 | ||||
| Date | F1 Cables (Ω) | F2 Cables (Ω) | F3 Cables (Ω) | F4 Cables (Ω) |
| 1/14/2016 | 34 M | N/A | N/A | N/A |
| 1/14/2016 | N/A | 27.8 | N/A | N/A |
| 7/30/2016 | 38 M | 78 M | N/A | N/A |
| 7/19/2017 | 884 K | 650 K | N/A | N/A |
Note: N/A = not available.
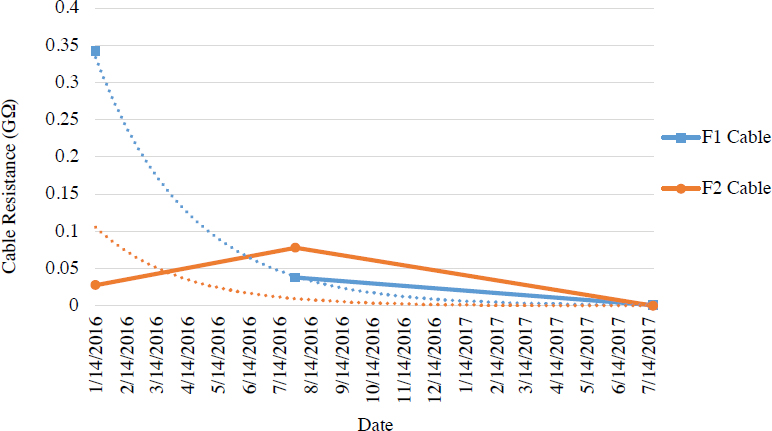
Table 4.20. Sunset #23 cable megger log.
| Feeder Cable Megger Log | ||||
|---|---|---|---|---|
| Sunset #23 | ||||
| Date | F1 Cables (Ω) | F2 Cables (Ω) | F3 Cables (Ω) | F4 Cables (Ω) |
| 8/30/2006 | 6 G | 7.5 G | N/A | N/A |
| 7/6/2007 | 8.1 G | 9.5 G | N/A | N/A |
| 7/23/2008 | 7.6 G | 8.9 G | N/A | N/A |
| 7/10/2009 | 7.2 G | 9.2 G | N/A | N/A |
| 10/31/2011 | 2.12 G | 5.4 G | N/A | N/A |
| 10/18/2012 | 1.8 G | 6.5 G | N/A | N/A |
| 10/28/2013 | 2.6 G | 7.1 G | N/A | N/A |
| 10/9/2014 | 1.42 G | 5.8 G | N/A | N/A |
| 4/25/2017 | 2.2 G | 6.0 G | N/A | N/A |
| 4/28/2018 | 3.76 G | 6.5 G | N/A | N/A |
Note: N/A = not available.

Table 4.21. Hawthorn Farm #34 cable megger log.
| Feeder Cable Megger Log | ||||
|---|---|---|---|---|
| Substation Hawthorn Farm #34 | ||||
| Date | F1 Cables (Ω) | F2 Cables (Ω) | F3 Cables (Ω) | F4 Cables (Ω) |
| 12/28/2005 | 3.08 G | P 6.75 G | N/A | P 10.1 G |
| 10/10/2006 | 3.04 G | P 10.9 G | N/A | N/A |
| 9/12/2007 | 3.70 G | N/A | N/A | P 10.0 G |
| 9/29/2008 | 4.96 G | N/A | P 13.4 G | |
| 9/22/2009 | 2.58 G | N/A | N/A | N/A |
| 7/11/2011 | 2.18 G | (2 min) 15.0 G | N/A | (2 min) 14.3 G |
| 7/2/2012 | 3.16 G | 2 min | N/A | N/A |
| 7/1/2013 | 1.47 G | N/A | N/A | |
| 7/1/2014 | 1.13 G | N/A | N/A | |
| 7/1/2015 | 2.26 G | N/A | N/A | |
| 1/11/2018 | 2.45 G | N/A | N/A | N/A |
Note: N/A = not available; P = point.

Table 4.22. Fuller #54 cable megger log.
| Feeder Cable Megger Log | |||||
|---|---|---|---|---|---|
| Fuller #54 | |||||
| Date | F1 Cables (Ω) | F2 Cables (Ω) | F3 Cables (Ω) | F4 Cables (Ω) | |
| 09/22/2003 | 1 min. | 800 M | 1 G | N/A | N/A |
| 3 min. | 1 G | 1.5 G | N/A | N/A | |
| 5 min. | 1 G | 1.5 G | N/A | N/A | |
| 09/04/2004 | 1 min. | 800 M | 800 M | N/A | N/A |
| 3 min. | 1 G | 1.1 G | N/A | N/A | |
| 5 min. | 1 G | 1.1 G | N/A | N/A | |
| 2005 | 1 min. | 1 G | 800 M | N/A | N/A |
| 3 min. | 1 G | 800 M | N/A | N/A | |
| 5 min. | 1 G | 1.1 G | N/A | N/A | |
| 09/23/2006 | 1 min. | 500 M | 750 M | N/A | N/A |
| 3 min. | 700 M | 800 M | N/A | N/A | |
| 5 min. | 700 M | 900 M | N/A | N/A | |
Note: N/A = not available.

Table 4.23. Steel Bridge #3 cable megger log.
| Feeder Cable Megger Log | ||||
|---|---|---|---|---|
| Steel Bridge #3 | ||||
| Date | F1 Cables (Ω) | F2 Cables (Ω) | F3 Cables (Ω) | F4 Cables (Ω) |
| 7/11/2000 | ||||
| 1 min. | 56.9 | 56.8 | N/A | N/A |
| 3 min. | 86.8 | 86.8 | N/A | N/A |
| 5 min. | 106.8 | 106.8 | N/A | N/A |
| 9/18/2003 | ||||
| 1 min. | 2 + | 2 + | N/A | N/A |
| 3 min. | 2 + | 2 + | N/A | N/A |
| 5 min. | 2 + | 2 + | N/A | N/A |
Note: N/A = not available.

4.8 Case Study 7: Utah Transit System
Table 4.24. Utah Transit System.
| Type of Service | Length (miles) | Age (years) | Electrification System (voltage, current type, contact system) | |
|---|---|---|---|---|
| Tram (streetcar, trolley) | 10 | 20 | DC pantograph | |
| Light rail | 60 | 4–8 | DC pantograph | |
| Rapid transit (metro, subway, underground) | 55 | 60 | DC pantograph | |
| Commuter rail | 20 | 8 | DC pantograph | |
| Other (please state the type) | — | — | — | |
| Concept | Current Practice | |||
| Quick view | Positive Feeder Cable and Negative Rail Return Cable Description: Power feeder cable and negative return cable shall be insulated, non-shielded, single copper conductor, suitable for wet or dry locations, with ethylene-propylene rubber insulation, 2000 V, 900 C conductor temperature for normal operation, 1300 C for emergency operation, and 2,500 C for short-circuit conditions, unshielded as indicated. Size of cables is to be 500-kcmil, or as shown on the contract drawings. Conductors: Conductors for positive feeder cable and negative return cable shall be coated, soft-drawn copper, complying with ASTM B3, covered with double-wrapped separator tape or extruded semi-conducting EPR screen. Conductor voltage size rating stranding material 500 kcmil 2,000 Class C or D copper. |
|||
| Insulation: Positive feeder cable and negative return cable shall be insulated with low-smoke, flame-retardant, ozone-resistant, ethylene-propylene rubber compound, complying with AREMA Signal Manual, Part 10.3.19 and ICEA S-95- 658, and rated for 900 C normal operating temperature and 1,100 C hot spots. The insulation thickness shall be as follows: conductor voltage ethylene-propylene size rating rubber 500 kcmil 2,000 Class C 90 mil. Jacket: Low-smoke, flame-retardant, ozone-resistant, non-halogen, polyolefin thermosetting compound, meeting the flame test requirements of UL 1581 and ICEA T-30-520. Minimum jacket wall thickness shall be 65 mils. Color shall be black. If 500 MCM messenger wire is used, single tap. If underground 2–500 MCM messenger is used, tap every 400 ft to 800 ft for the whole wire run length. Single trolley wire is used in the downtown areas for aesthetics. |
||||
| Summary | Degree of degradation | No cable monitoring system. Insulation resistance tests at reduced voltage. For instance, 1 kV on 2 kV–rated cable. | ||
| Diagnostic indicators | Most agencies do not do any testing after the initial installation testing is performed and documented. Insulation resistance and hi-pot test. Hi-pot at 2.5 kV on 2 kV–cable. | |||
| Influencing factors | Ultraviolet rays, temperature, birds, rodents, below water level, toxic manufacturing areas such as foundries, chemical plants, coating plants with acid baths. Salt spray from freeway bridges onto the right-of-way. | |||
| Replacement strategies | When there are budgetary restraints, cable is repaired instead of being replaced. Cable is replaced when there is a sufficient budget for replacement or the replacement is vital for operations. | |||
| Smart replacement strategy | None | |||
| Review and update |
For maintenance, testing has to be performed when operation of the trains has ended. Cables have to be disconnected. The negative return cable poses the largest problem, depending on how and where it is terminated. Cad-welded cables are not usually tested because of the difficulty of removing and reattaching the cables to the rail. Cembre-bolted connection types are easier to remove, but embedded track areas leave little room to disconnect and isolate the cables. In Figure 4.30, the Utah transit map, with revisions, is provided. |
|||
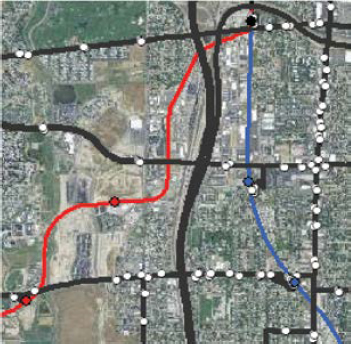
Figure 4.30. Utah transit map with revisions. |
|
|||
| Utah Transit Map | Recently completed revisions | |||
4.9 Case Study 8: Maryland Transit Administration
Table 4.25. Maryland Transit Administration (MTA).
| Type of Service | Length (miles) | Age (years) | Electrification System (voltage, current type, contact system) | |
|---|---|---|---|---|
| Tram (streetcar, trolley) | — | — | — | |
| Light rail | 34 | 29 | 750 V DC, catenary | |
| Rapid transit (metro, subway, underground) | 15 | 49 | 750 V DC, third rail | |
| Commuter rail | — | — | — | |
| Other (please state the type) | — | — | — | |
| Concept | Current Practice | |||
| Quick view |
The agency uses 1,000 MCM traction power cables, running four 1,000 MCM cables to each third-rail section per breaker. No taps are used; the agency runs directly to the third rail to the jumper at each section of the third rail. See Figure 4.31 for an MTA sketch that presents details of the power supply configuration. In Figures 4.32 and 4.33, MTA testing procedure details are provided. In Figures 4.34 to 4.37, MTA standard operating procedure data sheets are shown. All failures have resulted from wearing through the outer insulation due to vibration and expansion/contraction. The failure diagnoses were via an arcing event, tripped breaker, fire, and so forth. |
|||
| Summary | Degree of degradation | Every 10 years, the agency performs cable testing as mandated by the power supplier. It performs physical inspection of the cables to prevent accelerated physical degradation due to expansion and vibration. It adds additional jacketing in areas known to have excessive wear, such as in aerial structures where the cables must be able to expand and thus rub the side of the concrete structure. | ||
| Diagnostic indicators | The agency performs hi-pot testing for new cables. Cables are replaced when large sections are damaged and can no longer be repaired. Utilizing connections reduces connection issues in the field. These cables are all special procurements, so prices change based on industry costs. | |||
| Influencing factors | The crew sets up its cable test set at a location determined by the parameters of the cable to be tested. As the test set requires 600 volts DC to operate, the location is usually in a substation or on the right-of-way with a 600-volt DC source. | |||
| Replacement strategies/smart replacement strategy | The agency does not have a cable monitoring system in place. It does a physical inspection of the cable and initiates a 10-year test plan. It repairs a cable if that option is available. Cost of repair or replacement is based on length and installation access. Thus, every cable presents a different cost. Mandated cable testing costs $4.4 million to test all signal and traction power cables system-wide at Metro. Light rail will cost approximately the same amount. |
|||

Figure 4.31. Maryland power supply configuration.

Figure 4.32. MTA testing procedure details.

Figure 4.33. Maryland testing procedure.

Figure 4.34. MTA standard operating procedure data sheet—I.

Figure 4.35. MTA standard operating procedure data sheet—II.

Figure 4.36. MTA standard operating procedure data sheet—III.
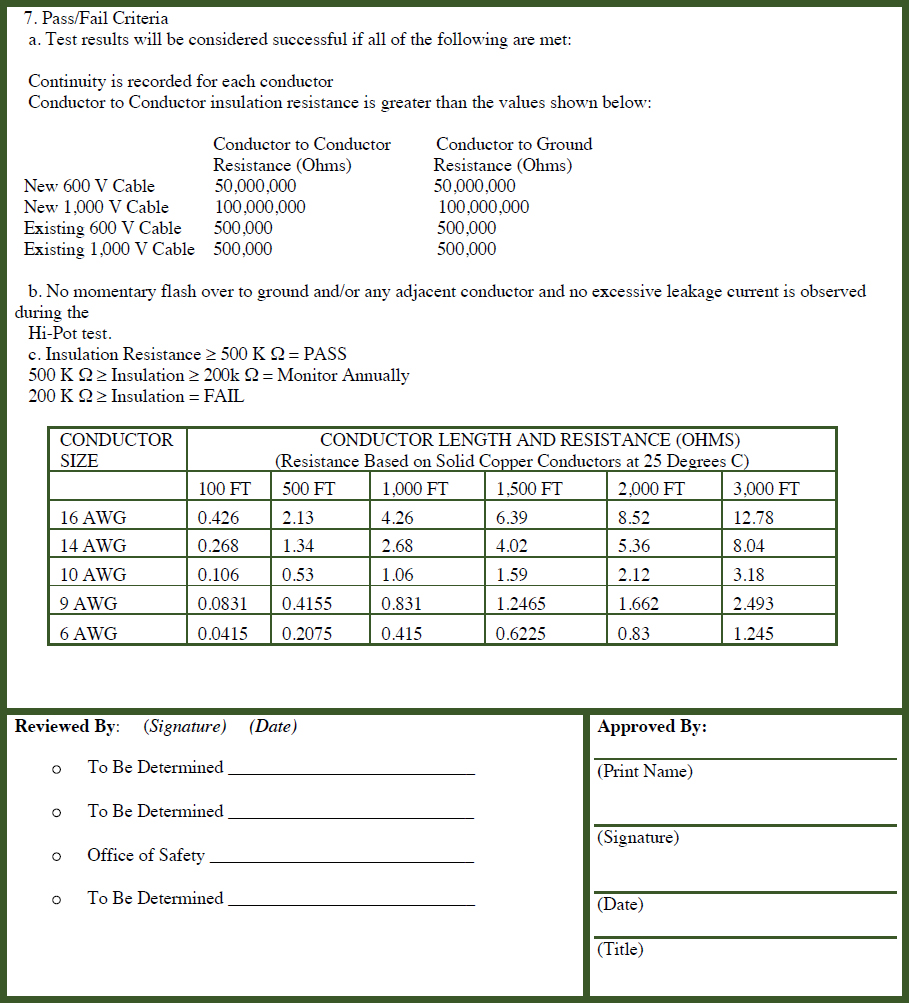
Note: AWG = American Wire Gauge.
Figure 4.37. MTA standard operating procedure data sheet—IV.
4.10 Case Study 9: Washington Metropolitan Area Transit Authority
Table 4.26. Washington Metropolitan Area Transit Authority findings and actions.
| Findings | Possible Actions |
|---|---|
| Multiple Washington Metropolitan Area Transit Authority (WMATA) departments are responsible for critical traction power electrification (TPE) system inspection, maintenance, and repair activities, so there is not always clear ownership of the TPE system and identification of systemic issues and priorities. | WMATA may want to conduct an assessment to determine if all TPE system program components should be integrated into a single department with sole responsibility for managing, inspecting, maintaining, repairing, and upgrading the TPE system. This assessment could include those elements of TPE system inspection, maintenance, and repair currently performed by traction power maintenance (TRPM); third-rail inspection and maintenance work currently performed by traction system test (TRST); negative return system inspection and maintenance activities performed by automatic train control (ATC) system; cable replacement activity performed by intelligent railcar condition monitoring (IRCM); engineering services provided by Pacific Western Rail Systems (PWRS); and lock-out/tag-out procedures implemented by the Rail Operations Control Center (ROCC). |
| Proactive management of TPE concerns during emergencies is important. | Emergency removal and restoration of third-rail power mainline to consider: (1) removal of power during smoke conditions, especially with corresponding third-rail power outages caused by unknown conditions; and (2) a requirement to deenergize third-rail power at the adjacent power substation or tie breaker, provided the situation does not strand a train that needs to be moved from the smoke condition. |
| Increased resources may help to support the testing, inspection, and maintenance of WMATA’s TPE system. | WMATA may want to evaluate options for using contractors to complete its TPE system corrective maintenance backlog and outstanding preventive maintenance requirements in the near-term and implement results. |
| WMATA departments are responsible for any action for traction power cables. | When traction power cables are loose on the ground, they are subject to contamination, vibration, and damage from movement. |
| Negative return systems should run properly. To make sure the system runs properly, regular maintenance should be performed. | A consistent program regarding the negative return system’s testing, inspection, and maintenance is important. |
| Insulation resistance should be tested to prevent hazards such as electric shock and short-circuits. | It is important to test cables to ensure insulation resistance. |
Cable conditions at various stages are shown in Figure 4.38.

4.11 Case Study 10: Metro Transit
Table 4.27. Metro Transit.
| Metro Transit is the primary public transportation operator in the Minneapolis–Saint Paul area of Minnesota and the largest operator in the state. The system is a division of the Metropolitan Council, the region’s metropolitan planning organization (MPO). | |
| Metro (styled as METRO) is a high-capacity rapid transit network serving the Minneapolis–Saint Paul metropolitan area. Its transit operations are summarized in Figure 4.39. As of 2020, the system consists of two light-rail lines (Blue and Green Lines) and three bus rapid transit lines (Red Line, A and C Lines). The five lines connect downtown Minneapolis and Saint Paul with Bloomington, Minneapolis–St. Paul International Airport, Roseville, and Brooklyn Center, with several new lines and extensions in the planning stages. | |

Figure 4.39. Transit operations for Metro Transit. |
|
| Minnesota Public Utilities | The Minnesota Public Utilities Commission (PUC) is the consumer protection agency in Minnesota charged with regulating public utilities such as electric and telephone services. |
| Integrated Distribution Plan | Minnesota Public Utilities Commission began a project to file an annual Integrated Distribution Plan, first published in 2019. The plan includes reviewing and evaluating the current system and planning to meet future needs. When traction power cables are concentrated, they are most often installed underground in groups of banks of pipes encased in concrete that are commonly called “duct banks.” |
Planning engineers use software tools to determine maximum cable capacities for circuits installed in duct banks. The planning criteria aim to maintain feeder utilization rates at or below 75% to help ensure a robust distribution system capable of providing electrical service under first contingency conditions. Therefore, to assess the robustness of the system over time, planning engineers analyze historical utilization rates and projected utilization rates based on demand.
Unlike overhead conductors, which are exposed to air and wind, underground cables have a difficult time dissipating heat. To ensure that cables do not become overloaded, planning engineers model the cables’ true ampacity with the help of these software tools. Cable failures are the main reason for outages. Proactively replacing cables may prevent outages caused by cable failures. As a result of existing asset health cable replacement program, the failure rate for underground cables has been flat to slightly declining, averaging approximately 0.25 failures per mile for each year. Cable replacement can be time-intensive and complex work. When cables begin to fail, this can lead to subsequent failures that can reoccur in rapid succession, thus affecting the customers’ reliability experience. Proactive replacement allows the agency to replace cables before they fail, preventing emergency replacement. Emergency replacements leave the system with less redundancy and switching options, possibly leading to lengthy outages if additional failures occur. An asset health cable replacement program focuses on replacing those underground cable systems that have had multiple failures. While this strategy has successfully reduced cable failures, it overlooks proactive assessment of the condition of the overall cable population. Asset
Table 4.28. Cable fault types and causes.
| Defects in an open circuit | This failure is caused when the carrier is pulled out of the joint or when the conductor is broken, which causes the current to stop flowing. |
| Short-circuits or cross faults | This failure is caused by damage to the insulation between two cables or two multicore cables. In this failure, the load is short-circuited as the current stops flowing through the main core but will pass from one cable to another. |
| Land or earth faults | This failure is caused by damage to the cable insulation. This causes the current to stop flowing with the following loads, but current continues to flow from the body of the cable to the earth or cable protector. |
health cable replacement programs would use cable assessment technology to assess and rehabilitate cable through partial discharge diagnostics to precisely assess the overall condition of the cable system and make recommendations on how to rehabilitate cables to like-new manufacturer standards. Cable systems that meet these standards perform like new and have an expected useful life of an additional 30 to 40 years after rehabilitation.
This assessment helps to determine precisely what defects exist and where they are within the cable system. It is then possible to replace only the defective portions of the cable system, such as terminations, splices, or weak points in the cable, as opposed to a wholesale replacement, which replaces portions of the cable that still have years of useful life left. It is expected that this will result in an improved reliability experience and cost savings. Underground cable failures can be challenging to locate and repair because the cables are often difficult to access. By implementing targeted assessment and replacement of underground cables and associated termination points and splices, it is possible to reduce the failure rate of cables. Several types of cable faults are discussed in Table 4.28.
4.12 Conclusions
This chapter presented 10 case studies from the agencies interviewed. Selected agencies were investigated in detail to determine their maintenance practices. The case studies were inclusive and covered a wide range of systems from small to large and from old to new. The assessment of the degree of degradation is approached differently by the case study agencies. Some agencies have no cable monitoring systems in use. They generally disconnect and deactivate the system in case of any failure, sometimes for weeks. The process to replace cables is only initiated once a cable failure occurs. Others do routine maintenance, and in most cases, agencies do periodic physical checks and inspections where they look for signs of weathering, fire or heat damage, and cuts/tears in the jackets. Some agencies perform tests like insulation resistance tests at reduced voltage. They add additional jacketing in areas known to have excessive wear, such as in aerial structures where the cables must have the ability to expand and thus rub the side of the concrete structure. Some agencies have insufficient resources to support testing, inspection, and maintenance. Agencies have a maintenance schedule to inspect the feeder cable in a timely manner to observe any potential issues and damage to the existing cable. Some diagnostic indicators are to be observed as indicators to the maintenance crew, including heat increase in the substation. Agencies perform visual inspections in manholes and taps, and run hi-pot, meggering, and thumb tests. Insulation resistance and hi-pot tests are commonly run by the agencies. Some agencies run no tests and take a run-to-fail approach.
In the investigation process, several factors need to be observed and controlled if possible, depending on the environment and usage of the cables in each case. The influencing factors include temperatures that are the most effective and the most common among all cases.
Temperature plays a more significant role on bare copper conductors than on feeder cables. Treeing, water damage, level of degradation of the insulation, and aging increase the probability of failure. The life cycle of the cables is relatively long, and one agency has a 10-year test plan with an asset health cable replacement program focusing on replacing underground cable systems that have had multiple failures. Thermal failure; moisture ingress; partial discharge; splices and taps subjected to seasonal water immersion in underground vaults; ultraviolet rays; birds; rodents; being below the water level; proximity to toxic manufacturing areas such as foundries, chemical plants, and coating plants with acid baths; and salt spray from freeway bridges are the main concerns of the agencies. Smart replacement systems are not common yet at the agencies studied. Only one agency had a smart new monitoring system and replacement strategy. Most agencies studied did not have a cable replacement program. Cables have only been replaced as part of substation renewal projects, when capital development allocates funds for cable renewal in the budget, or when cable failures have a major impact on operations. In some cases, agencies created techniques to enhance the cable lifespan. These techniques include cable jacketing, specially designed taps, and polyvinyl chloride–sealed (PVC-sealed) cages. Cables are repaired mainly by being spliced with a new cable. However, replacing the whole section is a possibility in some cases, such as when the system needs to be replaced or when it is economically possible or a better option. Repair of cables or replacement are the options for the agencies, and it is a decision-making process for them.
During scheduled maintenance can be a good time to determine what is needed related to cables and to start this decision-making process. In general, agencies attempt to work during nonrevenue hours or in combination with other work outages. A summary of the case studies is given in Table 4.29.
Table 4.29. Summary of the case studies.
| Case Study: | 1 | 2 | 3 | 4 | 5 | 6 | 7 | 8 | 9 | 10 | |
|---|---|---|---|---|---|---|---|---|---|---|---|
| Maintenance schedule | Heat increase observed | • | |||||||||
| Visual inspections | • | • | • | ||||||||
| Meggering and thumb tests | • | • | |||||||||
| Insulation resistance and hi-pot test | • | ||||||||||
| Partial discharge diagnostics | • | ||||||||||
| No test (run-to-fail mode) | • | • | • | ||||||||
| Investigation process (Several factors need to be observed and controlled if possible.) | Temperature | • | • | • | • | ||||||
| Treeing | • | • | |||||||||
| Water damage | • | • | • | • | • | • | • | ||||
| Level of insulation degradation | • | • | • | • | • | • | • | • | |||
| Aging | • | ||||||||||
| Cable replacement strategies | When cable failures have a major impact on operations | • | • | • | • | ||||||
| Smart replacement system | • | ||||||||||
| Part of substation renewal projects | • | • | • | ||||||||
| Techniques to enhance cable lifespan | Cable jacketing | • | • | ||||||||
| Specially designed taps | • | ||||||||||
| PVC-sealed cages | • | ||||||||||


