Sustaining Zero-Fare Public Transit in a Post COVID-19 World: Conduct of Research Report (2024)
Chapter: APPENDIX C: SCENARIO DEVELOPMENT AND EVALUATION
APPENDIX C
SCENARIO DEVELOPMENT AND EVALUATION
The body of this report is organized into four parts:
- Characteristics/Context of Agencies Impacting Analysis of Fare-Free Implementation – A large number of different agencies have implemented fare-free operations. While there are many different characteristics of these agencies, the research findings have revealed some specific aspects that are clear differentiators.
- Recommended Scenarios and Potential Benefits/Costs – Four scenarios will be built from the section above to represent not only a broad perspective but also the differences that will impact the analysis the most. The areas of possible benefits and costs (maybe better described as positives and negatives) will also be identified. It is important to note that some of these aspects will have quantitative results, and some will remain qualitative.
- Proposed Method for Evaluating Benefits/Costs – The specific method of analyzing the scenarios will be described.
- Application of the Method – The analysis methodology will be applied to the four scenarios. This will be very beneficial in the development of the practitioners’ tool.
CHARACTERISTICS/CONTEXT OF AGENCIES IMPACTING ANALYSIS OF FARE-FREE IMPLEMENTATION
Each State DOT and Transit Agency has unique characteristics, and the full spectrum is represented in the implementation of fare-free operations. It is important in the selection of scenarios to cover as broad a set of options as possible to best test the analysis methodology. Based on the review of the literature and the analysis of outreach interviews, the following characteristics/context rose to the top as the most important differentiators:
- Agency Size: Rural/Tribal, Small Urban, Large Urban/Metro (Larger agencies appear to have a larger dependency on fares for ongoing operations and have very limited data available; based on FTA funding category population ranges.)
- Funding Sources: 5307, 5311, Sales Tax, State Funds, Local/County Funds, Development District (Some funding outside of FTA funds may be at risk due to decision-maker reprioritization impacted by fare-free operation.)
- Modes/Transit Services Operated Fare-Free: Demand Response, ADA/Paratransit, Micro-transit, Bus, Streetcar, Light Rail, Commuter Rail, Heavy Rail (Micro-transit has potential challenges associated with the cost of no-shows, and rail has been separated from bus/paratransit in some fare-free implementations.)
- Peak Hour Capacity Demands: Heavy/Capacity loading in peak periods (Higher loads during peak hours bring the risk of overcrowding with fare-free operation.)
- Fare Recovery: Low, Medium, High (Higher fare recovery appears to reflect greater dependence on fares for ongoing operations.)
- Regional Services: Inconsistent fare-free policies (Fares collected in some modes/transit services or geographic areas and not in others may greatly impact cost savings for fare collection and intended fare-free policy outcomes.)
- Service Agreements/Fare Dependence: Intra-agency service coordination agreements or direct funding for university, major employer, or resort service (Direct funding for service may be at risk if there is no fare charged; in addition, some agencies are more dependent on fares than others.).
RECOMMENDED SCENARIOS AND POTENTIAL BENEFITS/COSTS
Recommended Scenarios
Building on the previous discussion of the characteristics and context for fare-free implementation, the four scenarios were developed loosely modelled after real-world agencies and settings found while conducting the research. These scenarios are shown in Table 1 (Updated in response to Panel comments and further analysis).
Table 1 - Recommended Scenarios
| Agency Size | Rural/Tribal | Small Urban/Rural | Regional | Large Urban |
|---|---|---|---|---|
| Description | Demand Response and/or fixed route | Fixed Route Bus and Paratransit with University service | Fixed Route Bus and Demand Response/Paratransit | Fixed Route Bus, Streetcar, and Paratransit |
| Modes Operated Fare-Free | All | All | All, with risk, one area may not participate | All |
| Funding Source | 5311, State | 5307/5311, Local, University | 5307 & 5311, State | 5307, Local Taxes, State, Development Agreement |
| Fare Recovery | Low | Low | Medium | High |
| Peak Hour Capacity Demands | Low | Moderate | Moderate | High |
| Regional Services, Service Agreements, Dependence on Fare Revenue | None | Includes a large university/local-funded service component | Service boundary with possible different policies on fare-free | Very dependent on fares to support operations |
| Example Systems | Tri-Valley Transit, VT | Oxford University Transit, MS | Green Mountain Transit (Rural and Urban), VT | KCATA, KS, and MO |
The rationale for the choice of these scenarios is based on the desire to cover a reasonable range of alternatives that will guide the development of the practitioners’ tool and help identify important aspects of fare-free implementation.
- Rural/Tribal – This scenario is reflective of small rural transit districts that often have fairly low fare revenues and a high cost of fare collection. Capacity issues are generally not critical, and the sensitivity to outside funding is minimal. Ridership is often low, and
- Small Urban/Rural with University Support – Transit agencies operating near large college/university campuses have a great opportunity for ridership and are often financial partners with the institutions in various forms. This scenario is reflective of the importance to an agency of preserving these financial partnerships (which could also be large employer agreements or municipal/county support) if fare-free service is implemented. Systems serving colleges and universities often have high concentrations of ridership on the routes linking student housing to the campus.
- Regional – This scenario is reflective of the risk of having a part of a regional system go fare-free while another part does not. In this case, the urban portion of the system has discussed not continuing fare-free operation. Many of the benefits of fare-free operations in one area can be fully or partially negated if an adjacent area does not continue fare-free operations. If any fares are collected, then the fare collection processes must all be in place. This also greatly impacts the intended policy goals. The differing needs of a system with both urban and rural elements can drive conflicting goals.
- Urban – Services may include bus, paratransit, and fixed guideway services. This scenario is reflective of the importance of fares in the overall finances of a larger urban area. These areas also have a greater potential for security issues and increased disabled/paratransit service costs (paratransit fare being formally double the fixed route fare). This alternative also includes participation by a development district and streetcar operation. In this specific example, the agency serves parts of two states, which carries the risk of different support for fare-free implementation and the subsequent loss of benefits. Vehicle overcrowding is also a consideration.
the proportion of low-income riders may be higher than other types of systems.
One change from the original recommendations was the removal of LA Metro/Washington DC as a scenario and the addition of Green Mountain Transit, VT. In both cases, only partial fare-free implementation is being considered. In LA Metro, the fare-free service is targeting specific audiences. While the District of Columbia is working toward a fare-free bus system, the change did not apply to WMATA buses outside the District of Columbia or on all parts of the metro rail system. In addition, the limited information on fare elasticity for full fare-free operation is even more limited for partial service. Most of the considerations are the same, but this one element has very limited data.
While the focus of this project has been on full implementations of fare-free operation, there is certainly some industry experience with partial fare-free implementation. Examples include free youth and/or seniors fares, passes, etc. Payment cards, automatic fare capping, and automatic application of fare discounts provide the mechanism to manage these policies. Micro-transit was often found to be a service recommended not to be included in the fare-free implementation program due to the high cost and service impact of “no-shows.” The concepts and methods defined in this project can be used to assist with evaluating a partial fare-free option.
Potential Benefits and Costs
The research findings have revealed a broad range of positive and negative considerations in the implementation of fare-free operations. It is important to note that these considerations are both quantitative and qualitative. The degree to which these different aspects are considered and weighted is a policy decision at the State and/or local level. The listings below show the different areas for analysis.
Operations Efficiency and Ridership
Ridership is discussed often as a key benefit, and the research bears that out. Research has shown that there are many potential operational challenges and benefits from fare-free operation, as exemplified below:
- Increased ridership: Fare-free implementation generally increases overall ridership. Data are available for complete or nearly complete implementation, although estimating the ridership sensitivity to changes in fares with partial implementation is very complex and beyond our scope.
- Operational efficiencies: Reduced boarding times and improved on-time performance.
- Possible security impacts:
- Reduction in driver/rider conflicts over fare disputes.
- Increase in passenger/passenger conflicts with disruptive/all-day riders.
- Service quality impacts:
- Exacerbated overcrowding during peak periods.
- Increased ease of use for first-time users or visitors to the area.
- Workforce impacts: Improved driver job satisfaction and reduced turnover.
- Increased demand for ADA/paratransit trips.
- Increased cost for micro-transit service due to scheduled but unused trips: care must be taken if this type of service is used (stand-alone or in lieu of fixed route service) due to limited data availability.
- Security: In most cases, but not all, security issues were not found to overwhelm the system. There are potential additional impacts to address perceived security issues and the need for the implementation of mitigation measures to address disruptive or all-day riders.
Cost Impacts/Savings
In some agencies, the cost to collect fares can actually exceed revenues received. In other agencies, the fares are so critical to covering operating costs that their removal has a dramatic impact. Analyzing the cost impact and savings must carefully account for the following:
- Farebox revenue.
- Revenue from contracted service agreements: Universities, large employers, development agreements, resort contributions.
- Fare collection expenses: Cash counting, cash handling, armored car services, credit card fees, fare media, the potential to repurpose space and personnel.
- Fare collection equipment purchase, maintenance, and replacement expenses.
Funding/Financing
Most discussions regarding fare-free operations focus on the loss of fare revenue. It is very important also to consider the “color of money” and the potential risk to other funding streams:
- Bond/debt covenants committing fare revenue to debt repayment: This may be a hard decision point without contract renegotiation.
- Loss of funds eligible for use as a grant match.
- Loss of support from policymakers without the contribution from fares.
- Impact on funding for NEMT due to reimbursement restrictions.
- Mode or project-specific farebox recovery policy requirements (e.g., commuter rail or bus rapid transit line.)
Transportation Equity
Fare-free policies and programs very positively address many aspects of transportation equity. Care must be taken to ensure that well-intentioned fare-free programs do not create or exacerbate current challenges. Relevant challenges and benefits include:
- Removal of limitations for underserved riders due to being unbanked, having limited or no access to smartphones/data plans, or having a lack of funds to pay fares.
- Improved access to transportation for underserved populations and more opportunities to make multiple, more convenient trips.
- Potential negative second-order impacts if reduced revenues limit the ability to expand service to underserved areas/times or if maintenance/state of good repair is impacted.
- Budget reduction in programs specifically serving people with low incomes and those who may face affordability challenges – placing them at a further disadvantage.
- Impacts due to temporal partial fare-free implementation: While this technique typically aims to minimize fare-free impacts of overcrowding during peak hours, it may inadvertently reduce service at the time that riders with the greatest needs must travel to and from work, childcare, etc.
- Impacts due to spatial partial fare-free implementation: Fare-free implementation, especially in underserved communities such as low-income communities and communities of color, will be beneficial for trips inside that area but may provide limited benefits for those who need to travel outside these areas for work/shopping purposes if the system design does not account for the trips between residential areas and non-residential uses.
- Impacts due to modal partial fare-free implementation: Fare-free implementation for bus/paratransit and not rail service may limit access to the full system for employment and other trips – particularly if the bus system feeds the rail system for access outside a specific area.
Air Quality/Greenhouse Gas Emissions
- Reduced greenhouse gases from the reduced use of single occupant vehicles (SOVs).
- Care should be taken as agencies have reported increased ridership by existing riders making more trips rather than attracting new riders. Only some agencies reported a mode shift away from SOVs.
PROPOSED METHOD FOR EVALUATING BENEFITS/COSTS
Understanding the Design User and Analysis Context
While there will be many potential uses for this information and analysis, it is important to define assumptions on how the ultimate practitioners’ tool is primarily intended to be used. In our case, this tool is being built from the vantage point of the State DOT and the assessment of all aspects of the decision to start, continue, or change fare-free operation. The “design user” is a staff member at the State DOT tasked with conducting an assessment related to fare-free implementation. It is also a tool that can be used by transit agency staff. Examples include:
- In the role of providing technical assistance to an individual transit agency – “Have all aspects of fare-free operation been considered by the transit agency, and is there a likelihood the goals of fare-free operation will be achieved?”
- In assessing a state-wide implementation – “Is the implementation (state-wide or for a group
- In planning for a future health emergency – “What funding level might the State consider to sustain transit operations if fare-free operations are implemented as part of an overall plan in a long-term health emergency?”
of agencies) of fare-free service sustainable in light of the benefits within our funding model?”
In addition to the decision-making support at the front end of the process, this same analysis technique could also be utilized to track post-implementation progress.
Overall Approach
The decision to start, extend, or stop fare-free operation, absent a crisis at a level of the COVID pandemic (with the associated funding), is typically a very localized decision. Funding to overcome the loss of fares is a common thread, but the value decision to commit resources or accept risk must fit the community being served and is very context-specific. This decision is made easier if outside funding from the State or other sources is available, but there are many factors to be considered.
The goal of this approach is not to develop a process that ends with a decision regarding fare-free operation but to provide decision-makers with the information required to make an informed decision. Some of this information may have a quantitative value, and many critical items cannot readily be assigned a numerical value. As an example, the analysis may reveal that the benefit-cost ratio (based only on quantitative elements) is less favorable than expected. If the same fare-free implementation overcomes a specific service delivery issue or equity challenge, the decision to proceed may still happen based on the greater weight placed on this aspect. This is a value decision that only the State and local leaders can make. The analysis facilitated by the practitioners’ tool is intended to allow this decision-making process to take place with as much information as possible, including possible second-order impacts and mitigation strategies. The overall approach is illustrated in Figure 1. Supporting data from the literature review are included in Appendix C-1 (Cost/Benefit Summary).

Specific Analysis Methodology
Each block shown in the overall approach is discussed below. While the practitioner’s tool has not yet been developed, it is envisioned that a report will be generated based on the inputs and the corresponding analysis. This will allow complete, tailored documentation based on local context and needs.
State DOT and Agency Goals
- Clearly defining the goals for the implementation is the starting point to focus the effort and ensure the expectations of all parties are aligned.
- Comparison of the output with these goals is a final check.
Agency Inputs
- Ridership.
- Types of services in operation and those contemplated for fare-free operation.
- Assessment of current operational challenges fare-free operation may change:
- Delays due to boarding time.
- On-time performance.
- High-capacity loads during peak periods.
- Security issues related to disruptive riders and driver conflicts.
- Specific equity challenges.
- Regional service boundaries with potentially different fare-free policies.
- Costs associated with fare collection, cash handling, and fare enforcement.
- Costs associated with the purchase of fare collection equipment, maintenance, and replacement costs. The current state of the fare collection system.
- Latent demand for ADA/paratransit service as calculated from sources such as TCRP Research Report 1581.
- Farebox revenue.
- Revenue from service/support agreements (including assessment of sensitivity to cancellation/reduction if a fare-free operation is implemented).
- Service agreements to support non-emergency medical transport.
- Bond/debt covenants linked to farebox revenue and matching requirements met with farebox revenue.
Operations Efficiency and Ridership
- Assess the likely range of ridership change due to fare-free operation based on literature review findings and outreach interviews.
- The fare elasticity for partial fare-free implementation is not well defined in the literature. This will require agency assessment bounded on the upper limit by the available data for complete fare-free operation.
- Assess additional issues such as boarding times, on-time performance, overcrowding, and ease of use.
___________________
1 Bradley, M. and D. Koffman. 2012. TCRP Report 158: Improving ADA Paratransit Demand Estimation: Regional Modeling. Transportation Research Board of the National Academies, Washington, DC, 2012. https://doi.org/10.17226/22720.
Cost Impacts/Savings
- Calculate savings from unneeded fare collection operations and equipment and related maintenance.
- Partial fare-free implementation and service boundaries with different policies will greatly limit the realization of these savings.
- Potential cost of increased ADA/paratransit utilization. (This was not identified broadly as a cost that was realized by agencies but is a possibility if there is a large latent demand no longer restricted by fare cost.)
- Potential increased or lowered cost for security. (This is also an area not identified broadly as a cost realized by agencies. The perception that there will be an issue may drive the need initially to ramp up supervisors/agency presence to smooth the transition. See also mitigation.)
Funding/Financing
- Assessment of risk to funding streams by removal of budget contributions from farebox revenues.
- Conflict with bond/debt covenants related to farebox revenue or ability to pay debt service.
- Conflict with farebox recovery policy requirements for specific projects such as commuter rail and bus rapid transit.
Transportation Equity
- Improved access to services for underserved communities, particularly low-income populations.
- Improvement of transportation equity for riders who have low income, are unbanked, or who do not have access to smartphones with data.
Air Quality/Greenhouse Gases
- Assess the likelihood/percentage of new riders being generated from a change in mode from SOVs. Note that the research indicates that much of the additional ridership appears to be resulting from the same riders taking more trips versus a mode shift; without substantive support data, this may be a qualitative assessment.
- Utilize values from national values or Metropolitan Planning Organization/State Implementation Plan analysis to estimate.
Second-Order Impacts
- Overcrowding during peak hours may drive the need to increase service and, therefore, costs.
- Equity impacts may result if the lack of funds restricts the ability to expand service to or sustain service in historically underserved areas.
- Manifestation of partial free-fare equity concerns associated with temporal, spatial, and modal implementation.
Mitigation
- Disruptive/All-Day Riders – Establishment of policies (for example) requiring riders to exit the vehicle at the end of each route before fare-free operation begins. Pair with appropriate security measures (escalating to law enforcement only if truly necessary) at the beginning of the operation, possibly tapering down later. This approach appears common
- Improving the likelihood of modal shift – Pair the beginning of fare-free operation with marketing that addresses the benefits of transit and personal cost savings to SOV users.
- Increased ADA/Paratransit Demand (if realized) – Utilize alternatives such as those found in TCRP Research Report 2392 to provide alternatives.
among agencies that did not see significant security issues.
Outputs
- Reasonable ridership change assumption.
- Cost per new rider (quantitative aspects only).
- Benefit/cost ratio (quantitative aspects only).
- Identification of funding risk areas.
- Identification of transportation equity benefits/risks.
- Identification of other qualitative benefits/risks.
- Potential second-order impacts.
- Potential mitigation measures.
SCENARIO ANALYSIS
The scenario analysis provided an opportunity to apply the results of the research to a range of settings and funding scenarios. This test is a precursor to the development of the practitioners’ tool, and the format for the presentation of the results is made in a format to highlight the process and the differences between the scenarios in a ready manner. Some important items to consider in reviewing these results:
- The data set used to establish these scenarios was developed for this research and is focused on agencies that have experience with fare-free service. While the discussion and review of these agencies were thorough, it is possible that the assumptions used in the analysis may extend beyond the actual experiences in these agencies. The intent of the research team is to test the analysis process in the context of a range of actual agencies.
- For illustration, an increase proportional to the total ridership in paratransit utilization was used in this analysis. This will be very dependent on local conditions and the specific population being served. It is an important element to consider when considering the full picture of costs to provide fare-free service.
- It is envisioned that the practitioners’ tool would likely separate the inputs, and different analyses into different tabs for entry and use. A report for use by the analyst would also be generated. The table in Appendix C-2 shows a type of format to consider for the overall results. This format also allows the comparison of the alternatives in an efficient manner. There are many remaining steps to get to the practitioners’ tool, and this analysis has revealed valuable insights.
- There will be some differences in the values between Appendix C-1 (Cost/Benefit Summary) and Appendix C-2 (Scenario Analysis Results) based on assumptions made in the test analysis.
___________________
2 Ellis, E. S. Lasky, R. Mehrotra, W. Rodman, and T. Hansen. TCRP Research Report 239: Provision of Alternative Services by Transit Agencies: The Intersection of Regulation and Program. Transportation Research Board of the National Academies, Washington, DC, 2023. https://doi.org/10.17226/26860.
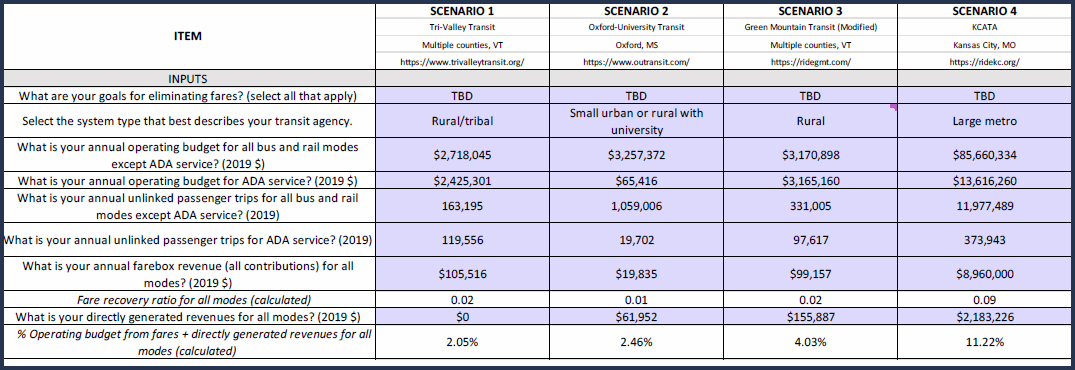
The results of the analysis of the scenarios are shown in Appendix C-2. The table shows the inputs to and the results of the analysis side-by-side to allow for ready comparison. The data (pre-COVID) used for the analysis focused on FY 18 (Green Mountain Transit, change in reporting in FY19) or FY 19 (all remaining). Reasonable assumptions were made to fill in gaps and illustrate the methodology. The scenario analysis shown in Appendix C-2 uses the following conventions:
- Light Blue Shading – User inputs.
- No shading – Calculations or assumed values.
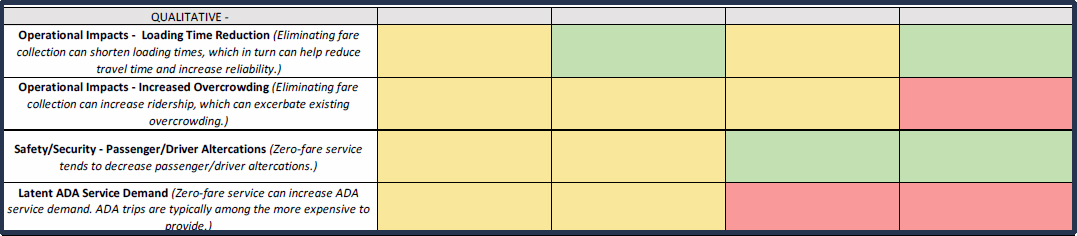
- Red (Negative), Yellow (Neutral), and Green (Positive) – Evaluation of qualitative considerations.
The screenshots below illustrate the presentation of the results.

The scenario analysis revealed a number of findings that will inform the development of the practitioners’ tool:
Quantitative Analysis – If reviewed in isolation, the quantitative analysis (i.e., benefit-cost ratio) paints a difficult picture of the decision to implement fare-free service. Addressing latent paratransit demand can be particularly impactful. This points to the importance of a financial offset to the increased costs and loss of fares to the provision of a sustainable fare-free program. Scenario 2 points to the impact of a key financial partner. The university participation in the service far offsets (by two orders of magnitude) the loss of fare revenue and effectively eliminates the cost aspects as a consideration.
Qualitative Analysis – The rationale for fare-free implementation will likely hinge on the consideration of the policy impacts (i.e., transportation equity). Highlighting this element in the format of the reporting will be important for a balanced perspective.
Agency Input - The tool is likely to be more informative if agencies apply as much local knowledge as possible. Basic assumptions included in the tool are valuable, but it is generally recommended that they conduct research/analyses to transform the unknowns into knowns. The tool should provide the ability to input unique aspects of the community without being forced to apply an industry average assumption.
Alternative Comparison - The tool should allow agencies to test the effects of different paths forward, possibly by allowing side-by-side evaluations.
Future Updates - The tool should allow for future updates to reflect new research findings.
Optimum Level of Detail – The transit industry often uses a large set of statistics and evaluations. Striking the right balance between thoroughness and not overwhelming decision-makers will be important.
Additional Guidance - Additional guidance to implementing agencies (some of which will be consistent for all analyses) should be included in the ultimate tool.
Ease of Use – Providing drop-down menus when appropriate and other similar items will make the tool as user-friendly as possible.
APPENDIX C-1 (COST/BENEFIT SUMMARY)
| Type of Fare-free Policy | Agency | Location | Type of Agency | 2019 Annual Trips (UPT) | 2019 Operating Expenses | 2019 %OPEX from Fares and Direct | 2019 Operating Expenses per | Ridership Increase | Annual Fare Collection Savings | Capital Fare Collection Savings (Left Blank if Not | Annual Foregone Revenue | Annual Costs Due to Increased | Paratransit DR cost as a %age of | Estimated Annual Cost per New | BC/Ratio | Notes | |||||
|---|---|---|---|---|---|---|---|---|---|---|---|---|---|---|---|---|---|---|---|---|---|
| Demand Response | Bus | Reported Value | Year | 2019 Estimate | Reported Value | Year | 2019 Estimate | ||||||||||||||
| Full | Advance Transit | Windsor - Grafton Counties, NH and VT | Rural | 758,025 | $3,338,559 | 0% | $48.15 | $4.03 | 32.0% | $73,854 | $611,070 | 2023 | $542,630 | Not reported. | Not reported. | ||||||
| Green Mountain Community Network | Bennington County, VT | Rural | 200,154 | $3,555,912 | 0.70% | $24.90 | $8.58 | 11.7% | $10,300 | $34,000 | 2024 | $29,342 | Not reported. | $0.81 | 0.35 | ||||||
| Green Mountain Transit - Rural | Chittenden County, Capital District, Mad River Valley, Stowe/Lamoille, Franklin/Grand Isle Region, VT | Rural | 428,622 | $6,434,345 | 1.60% | $32.72 | $8.55 | 15.1% | $10,000 | $117,000 | 2024 | $100,971 | Not reported. | $1.41 | 0.10 | Only 2018 operating expenses available, converted to 2019 dollars. | |||||
| Marble Valley Regional Transit District | Rutland County, VT | Rural | 806,778 | $6,848,347 | 2.70% | $23.51 | $3.63 | 10.7% | $48,000 | $131,000 | 2024 | $113,053 | Not reported. | $0.75 | 0.42 | ||||||
| Rural Community Transportation | Northeast Kingdon - Lamoille Counties, VT | Rural | 264,752 | $4,982,305 | 0% | $23.69 | $6.88 | Not reported. | Not reported. | Not reported, always fare free. | Not reported, always fare free. | ||||||||||
| Southeast Vermont Transit | Windham - Southern Windsor Counties, VT | Rural | 445,702 | $4,306,434 | 3% | $30.12 | $7.71 | 19.9% | $31,000 | $37,000 | 2023 | $32,856 | $108,000 | 2024 | $93,204 | Not reported. | |||||
| Tri-Valley Transit | Addison - Orange - North Windsor Counties, VT | Rural | 282,751 | $5,143,346 | 2.10% | $20.29 | $13.02 | 11.8% | $50,000 | $63,000 | 2024 | $54,369 | Not reported. | ||||||||
| Vermont DOT (all VT agencies except Green Mountain Transit - Urban and Link Transit) | Rural VT | Rural | Not reported. | Not reported. | Not reported. | Variable. | Not reported. | 11.5% | $150,000.00 | $453,000 | 2024 | $390,939 | Not reported. | ||||||||
| Chapel Hill Transit | Chapel Hill - Carrboro - University of North Carolina, NC | University Town | 6,641,553 | $19,964,823 | 3.30% | $45.15 | $2.57 | 54.5% | Not reported. | $250,000 | 2001 | Dated Info | Not reported. | ||||||||
| Kansas City Area Transportation Authority | Greater Kansas City, MO | Urban | 12,409,231 | $99,663,654 | 10.90% | $41.12 | $7.28 | 40.0% | $935,000 | $8,960,000 | 2019 | $8,960,000 | $1,200,000.00 | 1.20% | $1.62 | 0.10 | |||||
| LINK Transit | Chelan - Douglas Counties, WA | Urban | 1,036,007 | $15,031,915 | 6.10% | $45.80 | $12.69 | 20.0% | $57,000 | $640,000 | 2019 | $640,000 | $795,500.00 | 5.29% | $2.81 | 0.09 | |||||
| Intercity Transit | Olympia, WA | Urban | 4,736,809 | $44,575,341 | 15.60% | $51.57 | $7.35 | Not reported. | Not reported. | $207,000 | 1990 | Dated Info | Not reported. | ||||||||
| Alexandria DASH | Alexandria, VA | Urban | 3,996,676 | $21,708,129 | 28.70% | $27.58 | $5.06 | 21.0% | $123,000 | $5,833,333 | 2021 | $5,489,166 | $3,750,000 | 2022 | $3,431,250 | Not reported. | $3.29 | 0.04 | |||
| Fairfax City CUE | Fairfax, VA | Urban | 601,813 | $4,208,277 | 27.00% | N/A | $6.99 | Not reported. | Not reported. | $5,833,333 | 2021 | $5,489,166 | $1,100,000 | 2019 | $1,100,000 | Not reported. | |||||
| Partial | Ride On | Montgomery County, MD | Urban | 20,596,520 | $124,622,335 | 16.90% | N/A | $6.05 | 20.0% | $2,200,000 | $19,100,000 | 2019 | $19,100,000 | $1,400,000.00 | 1.12% | $4.10 | 0.12 | Fares reinstated August 2022. | |||
| Utah Transit Authority | Salt Lake City, UT | Urban | 44,578,161 | $311,049,152 | 15.90% | $52.17 | $7.46 | 35.6% | $1,276,000 | $31,935,000 | 2023 | $28,358,280 | $7,829,000.00 | 2.52% | $1.71 | 0.04 | February 2023 and bad air quality days only. | ||||
| MTBA | Boston, MA | Urban | 366,716,896 | $1,866,447,835 | 46.70% | $69.11 | $4.29 | 20.0% | $0 | $0 | $3,800,000 | 2022 | $3,477,000 | $420,000.00 | 0.02% | $0.05 | 0.00 | 3 bus routes only. Ridership increase is over baseline increase (15% systemwide). | |||
| Denver RTA | Denver, CO | Urban | 5,207,476 | $870,018,988 | 23.40% | $45.20 | $5.40 | 12.0% | $16,000 | $15,207,272 (July and Aug.) | 2023 | $13,504,058 | Not reported. | July and August 2023 only. | |||||||
| Green Mountain Transit - Urban | Chittenden County, Capital District, Mad River Valley, Stowe/Lamoille, Franklin/Grand Isle Region, VT | Urban | 13,831,126 | $20,958,905 | 13% | $31.77 | $5.11 | 18.6% | $36,000 | $1,920,000 | 2024 | $1,656,960 | Not reported. | $0.63 | 0.02 | Fares reinstated March 6th, 2024 | |||||
| Arlington Transit | Arlington VA | Urban | 2 917 849 | $18 134 248 | 22% | $50.86 | $5.26 | Not reported. | Not reported. | $5 833 333 | 2021 | $5 489 166 | $3 700 000 | 2019 | $3 700 000 | Not reported. | Temporally limited. | ||||
| Loudon County Transit | Loudoun County, VA | Urban | 1,708,121 | $18,177,156 | 47.70% | $55.23 | $12.03 | Not reported. | Not reported. | $5,833,333 | 2021 | $5,489,166 | $9,600,000 | 2019 | $9,600,000 | Not reported. | Fares reinstated May 2021. | ||||
| OmniRide (Potomac and Rappahannock Transportation Commission) | Prince William Area, VA | Urban | 3,813,055 | $39,927,120 | 49% | N/A | $18.13 | Not reported. | Not reported. | $5,833,333 | 2021 | $5,489,166 | $11,200,000 | 2019 | $11,200,000 | Not reported. | Free on OmniRide Metro Express and for some groups and on local bus. | ||||
| Fairfax County Connector | Fairfax County, VA | Urban | 8,334,449 | $85,469,022 | 13.40% | N/A | $10.25 | Not reported. | Not reported. | $5,833,333 | 2021 | $5,489,166 | $10,900,000 | 2019 | $10,900,000 | Not reported. | Socially limited. | ||||
Assumed discount rate 3%
All items highlighted in yellow are based on review the detailed date sheets info or normalized to FY 19.
Capital costs for fare collection equipment are assumed to be 10% per year to allow comparison with annual operating costs.
APPENDIX C-2 (SCENARIO ANALYSIS RESULTS)
| ITEM |
SCENARIO 1 Tri‐Valley Transit Multiple counties, VT https://www.trivalleytransit.org/ |
SCENARIO 2 Oxford‐University Transit Oxford, MS https://www.outransit.com/ |
SCENARIO 3 Green Mountain Transit (Modified) Multiple counties, VT https://ridegmt.com/ |
SCENARIO 4 KCATA Kansas City, MO https://ridekc.org/ |
|---|---|---|---|---|
| INPUTS | ||||
| What are your goals for eliminating fares? (select all that apply) | TBD | TBD | TBD | TBD |
| Select the system type that best describes your transit agency. | Rural/tribal | Small urban or rural with university | Rural | Large metro |
| What is your annual operating budget for all bus and rail modes except ADA service? (2019 $) | $2,718,045 | $3,257,372 | $3,170,898 | $85,660,334 |
| What is your annual operating budget for ADA service? (2019 $) | $2,425,301 | $65,416 | $3,165,160 | $13,616,260 |
| What is your annual unlinked passenger trips for all bus and rail modes except ADA service? (2019) | 163,195 | 1,059,006 | 331,005 | 11,977,489 |
| What is your annual unlinked passenger trips for ADA service? (2019) | 119,556 | 19,702 | 97,617 | 373,943 |
| What is your annual farebox revenue (all contributions) for all modes? (2019 $) | $105,516 | $19,835 | $99,157 | $8,960,000 |
| Fare recovery ratio for all modes (calculated) | 0.02 | 0.01 | 0.02 | 0.09 |
| What is your directly generated revenues for all modes? (2019 $) | $0 | $61,952 | $155,887 | $2,183,226 |
| % Operating budget from fares + directly generated revenues for all modes (calculated) | 2.05% | 2.46% | 4.03% | 11.22% |
| What is your annual cost for fare collection and processing (2019 $)? | $14,138 | $53,935 | $10,000 | $935,000 |
| What are the pending capital costs (if any) for fare collection equipment (2019 $)? | $50,000 | $0 | $0 | $0 |
| To what extent do you currently experience long loading times (including passenger ingress, egress, and fare collection times)? | Reasonable loading times | Excessive loading times | Reasonable loading times | Excessive loading times |
| To what extent do you currently experience overcrowding on vehicles? | No overcrowding | Occasional overcrowding | Occasional overcrowding | Frequent and/or widespread overcrowding |
| To what extent do you currently have disruptive passengers on your services? | Negligible disruptive passengers | Negligible disruptive passengers | Negligible disruptive passengers | Negligible disruptive passengers |
| To what extent do you currently have driver‐passenger altercations on your services? | Negligible driver/passenger altercations | Negligible driver/passenger altercations | Significant driver/passenger altercations | Significant driver/passenger altercations |
| To what extent is there latent demand for ADA paratransit services that could manifest if fares are eliminated? | Likely small latent demand | Likely small latent demand | Likely moderate latent demand | Likely large latent demand |
| To what extent do your riders transfer to/from non‐zero‐fare services operated by other agencies? | Negligible risk of transfers to/from other operators that charge fares | Negligible risk of transfers to/from other operators that charge fares | Moderate risk of transfers to/from other operators that charge fares | Moderate risk oftransfers to/from other operators that charge fares |
| To what extent are service area residents members of communities that are traditionally transportation‐disadvantaged (e.g., in low-income households)? | 26‐50% | 51‐75% | 0‐25% | 26‐50% |
| How much of your funding comes from local contracts or service agreements? | A neglible amount | A significant amount | A moderate amount | A significant amount |
| To what extent do you rely on fare revenues to meet local match requirements for any current funding sources? | Significant | None | Moderate | Moderate |
| To what extent are you currently having issues with driver retention? | Negligible | Negligible | Moderate | Significant |
| [More questions to be added] | ||||
| QUANTITATIVE | ||||
| Likely Range of Ridership Increase ‐ All Modes ‐ Minimum | 10% | 5% | 10.00% | 20% |
| Likely Ridership Increase ‐ All Modes ‐ Minimum | 28,275 | 53,935 | 42,862 | 2,470,286 |
| Likely Range of Ridership Increase ‐ All Modes ‐ Maximum | 15% | 20% | 20.00% | 40% |
| Likely Ridership Increase ‐ All Modes ‐ Maximum | 42,413 | 215,742 | 85,724 | 4,940,573 |
| Cost Savings (2019 $) | $17,471 | $53,935 | $10,000 | $935,000 |
| Loss of Revenue ‐ All Modes (2019 $) | $105,516 | $19,835 | $99,157 | $8,960,000 |
| Increased ADA Service Cost (2019 $) | $303,163 | $8,177 | $474,774 | $4,084,878 |
| Cost per New Rider (2019 $) | $11.07 | ‐$0.19 | $8.77 | $3.27 |
| Benefit/Cost Ratio (includes increased ADA service cost) | 0.04 | 1.93 | 0.02 | 0.07 |
| QUALITATIVE ‐ | ||||
| Operational Impacts ‐ Loading Time Reduction (Eliminating fare collection can shorten loading times, which in turn can help reduce travel time and increase reliability.) | ||||
| Operational Impacts ‐ Increased Overcrowding (Eliminating fare collection can increase ridership, which can excerbate existing overcrowding.) | ||||
| Safety/Security ‐ Passenger/Driver Altercations (Zero‐fare service tends to decrease passenger/driver altercations.) | ||||
| Latent ADA Service Demand (Zero‐fare service can increase ADA service demand. ADA trips are typically among the more expensive to provide.) | ||||
| Risk of Adjacent Service Areas With Different Fare‐Free Policies (Ridership increases may be limited if adjacent operators (to/from which local riders transfer) continue to charge fares.) | ||||
| Transit Service Equity ‐ Reduce Barriers for Unbanked/Low Income Passengers (Eliminating fares removes challenges with the need for credit cars, bank accounts, smart phones, and available funds) | ||||
| Transit Service Equity ‐ Rider Demographics (Higher percentage of low‐income households is an indicator of equity challenges) | ||||
| Funding Risks ‐ Local Contracts and Service Agreements (Purchasers of service may choose to renegotiate or end contracts if fares are eliminated.) | ||||
| Driver Retention (Eliminating fare collection has been reported to improve bus operator job satisfaction. High levels of operator turnover can negatively impact operating costs and service quality.) |
LEGEND
| Potentially Positive Impact from Fare‐Free Implementation |
| Potentially Neutral impact from Fare‐free Implementaion |
| Potentially negative impact from Fare Free Implementation |


