Municipal Solid Waste Recycling in the United States: Analysis of Current and Alternative Approaches (2025)
Chapter: 2 Municipal Solid Waste Management and Recycling Systems
2
Municipal Solid Waste Management and Recycling Systems
Summary of Key Messages
- Municipal solid waste (MSW) recycling programs are part of broader waste management systems: These systems include those that manage materials destined for end-of-life treatment or disposal as well as commercial and industry recycling and remanufacturing systems.
- Actors and policies: MSW recycling programs are impacted by actors and policies across the materials supply chain—from virgin material extractors to end-of-life waste managers—and by governments at all levels.
- Quantities of MSW generated and recycled annually: The United States generates approximately 292 million tons of MSW annually. However, most MSW (68–79 percent) because of factors such as the material not being targeted for recycling, not being economically viable to recycle, limited access to recycling programs, and low participation rates (EPA, 2020; The Recycling Partnership, 2024).
- Changes in material streams over time: The volume and composition of materials managed in the MSW system have changed and will continue to change over time with the evolution of consumer products (e.g., printed newspapers) and packaging materials (e.g., plastic versus glass containers).
- Technological advances may increase MSW system efficiency: Increased use of automated sorting by households and at materials recovery facilities may decrease contamination issues and increase sorting efficiency. These technological advances likely will require significant financial outlay.
- Limitations of weight-based recycling rates: Aggregated weight-based recycling rates (i.e., a ratio of recycling to total waste collected) and material-specific rates (e.g., percent of all discarded aluminum cans that are recycled) are incomplete metrics because they do not adequately account for all costs and benefits of using and reusing materials over their life cycle (e.g., economic, social, and environmental costs and benefits), changes in packaging material composition, and waste reduction efforts.
- Sustainable materials management: A sustainable materials management approach provides a more complete picture of the costs and benefits of using and reusing materials across their life cycles than weight-based recycling metrics alone.
Today’s municipal solid waste (MSW) management system is the product of countless iterative changes throughout the course of history, both in the United States and abroad. Changes in technology, economic activity (from local market development to international trade), demography, social norms and values, policy, packaging types, and other factors have all influenced contemporary MSW systems. Wilson (2023) provides a more detailed historical review of waste management, recycling, and composting.
2.1 TODAY’S RECYCLING SYSTEMS
As further detailed throughout this report, recycling systems are complex. Still, to understand the current state of recycling programs and to address this committee’s charge, it is necessary to map a generalized system that considers the actors, processes, materials, and other components of typical municipal recycling programs (see Figure 2-1). This chapter describes the basics of MSW management and recycling; the actors, infrastructure, and processes involved; and methods for assessing the performance of a recycling system, as well as current concerns for and promising technological improvements to MSW processing.
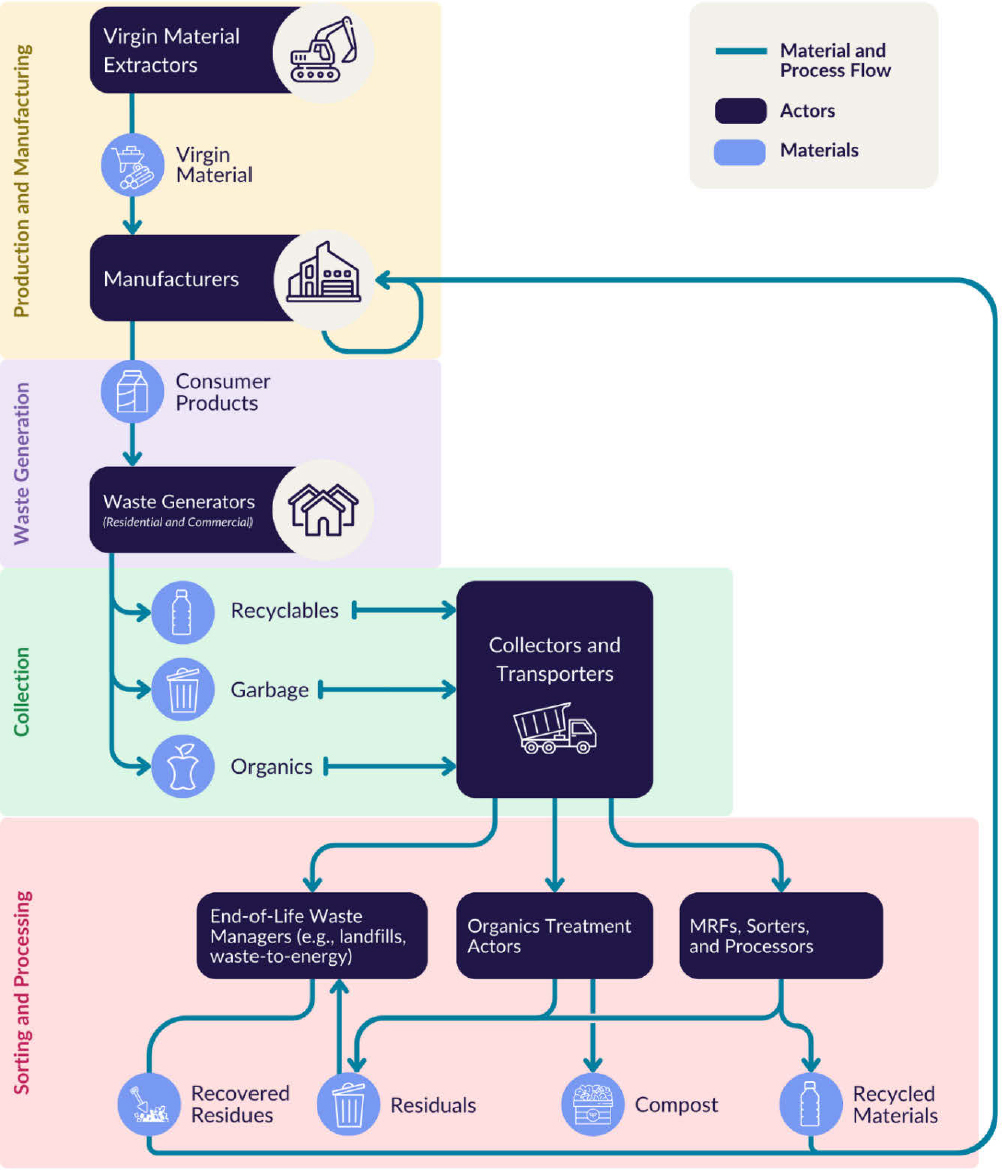
NOTES: Other non-residual organic products (e.g., animal feed, energy) may result from treatment of organics but are not discussed in this study. MRF = materials recovery facilities.
Broadly speaking, the materials management system includes subsystems for (1) production and manufacturing, (2) waste generation, (3) waste collection, and (4) sorting and processing. Production and manufacturing include both virgin and recycled materials as inputs, which are valued differentially by markets that procure them for production. Also of note, manufacturer efforts to recycle their own materials play
a critical role in supporting broader waste reduction goals, but these efforts typically occur separately from downstream MSW management systems. Waste generation has been studied in local, regional, national, and cross-national contexts, where differences in household size, income, education, values, waste ordinances, and information efforts are shown to affect household waste generation rates and composition (Firmansyah et al., 2024; He et al., 2022; Šomplák et al., 2023). Cecot and Viscusi (2022) conducted an extensive set of survey studies to identify the effect of these and other factors on household recycling decisions (see Chapter 6; see also Cecot and Viscusi, 2022; Huber et al., 2023; Viscusi et al., 2022). Waste collection methods influence the rate and composition of material flows. Single-stream, dual-stream, and source-separated or single-material methods include collecting and transporting recyclables separately, in contrast to traditional mixed-waste collection and transport. The degree of separation at collection also impacts quality of the outbound material. Contamination is lower and therefore quality is higher in material that is source separated or single stream, compared with mixed-waste or dual-stream collection, albeit at a higher cost. In the sorting and processing stage, materials recovery facilities (MRFs) receive sorted or treated waste; they then further sort and consolidate the waste to prepare recycled materials for use in remade products or other applications.
An important metric for the benefits and performance of a municipal recycling program is the cost-efficiency of collecting, sorting, and processing recycled materials (Bohm et al., 2010; Bolingbroke et al., 2021; Wilson et al., 2015). This efficiency is affected by the quality of both human (Jităreanu et al., 2023) and mechanical processes that create or reduce losses along the waste flow–recycle stream.1 Much of these inefficiencies are attributed to contamination, which is the amount of nonrecyclables—15–20 percent on average—collected curbside with recyclable materials. Missed recyclables add to residue from MRFs and are often mislabeled as contaminants. These can create significant operational problems at recycling centers and increase processing costs (The Recycling Partnership, 2024).
Composting can be considered a form of recycling but involves very different operations. Composting is a biological process that converts recycled organic matter, primarily leaves and food waste, into a soil-like material that has value as a soil additive known as compost. Large-scale composting requires a controlled environment that includes, optimally, adequate oxygen levels, periodic compost turning, appropriate moisture levels, and temperature control. Composting can be done in homes or communities, or for large-scale operations, in engineered vessels, windrows, or aerated static piles. Composting plays a major role in meeting U.S. food waste reduction goals, recognizing that composting food waste has multiple advantages over landfilling. The U.S. Environmental Protection Agency (EPA) estimates that 98.5 million tons of food waste and yard trimmings were generated in 2018 (12.1 percent of total MSW generated was yard trimmings and 21.6 percent was food waste). Approximately 25 million tons of organic material were composted, representing 8.5 percent of MSW generated. Approximately 4.1 percent of food waste generated was composted (EPA, 2020). Interest is also growing in recycling food waste as animal feed, codigestion, donation, land application, sewering, anaerobic digestion, and thermal recovery for organic waste.
2.1.1 Actors and Decision-Makers in MSW Management
The MSW management system portrayed in Figure 2-1 includes the mass flow of products, materials, and wastes from production through use, waste generation, sorting, collection, and treatment, and on to reuse, recycling, or disposal. These operations are accomplished by actors in the MSW management system and their employees, as illustrated in Figure 2-2. In each stage, multiple actors influence each other through a combination of price and economics, education, persuasion, or directives supported by legal requirements. A fully effective recycling effort requires high-quality programs in each of these stages and strong planning and coordination among them.
___________________
1Some researchers have proposed variations of this metric (Bohm et al., 2010; Bolingbroke et al., 2021; Wilson et al., 2015).
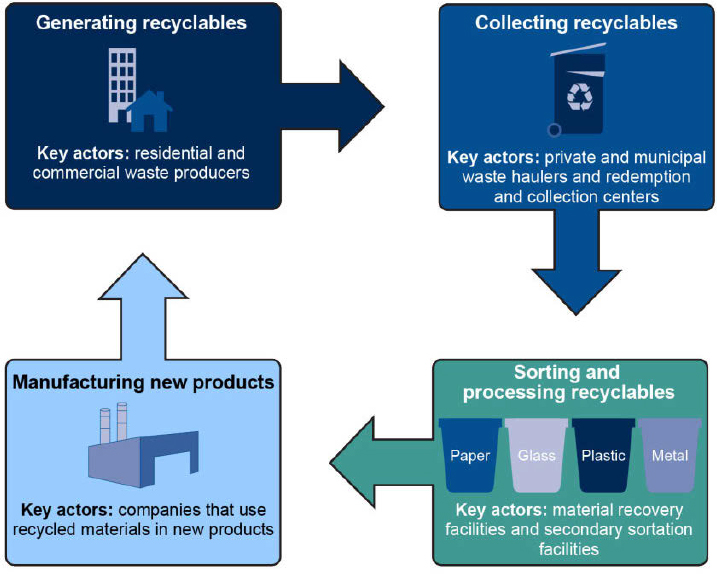
SOURCE: GAO, 2020.
Each actor in this system is led by human decision-makers, who are influenced by their beliefs and values, technical and popular sources of information, social norms, economic costs and incentives, and constraints imposed by laws and regulations. These decision-makers include producers choosing technologies for product manufacturing and packaging; consumers choosing products and deciding between methods for waste separation, sorting, and collection; and waste management organizations choosing among technologies that support these behavioral decisions.
In a recent report, The Recycling Partnership (2024) presented an MSW systems approach that focuses on decision-makers and their choices. The model, adapted and simplified in Figure 2-3, depicts the five major stages in which critical decisions affecting the success of a recycling program are made. The overall recycling rate of solid waste is directly impacted by these actors and the choices they make at each stage. As such, these actors and decision stages represent key areas where policy choices can positively influence recycling rates.
The stages in Figure 2-3 can serve as a framework for assessing participant roles and decisions pertaining to recycling and the factors that affect these decisions. Waste collection and management agencies, whether private or public, play a central role in providing access to recycling; in coordinating policies and programs that encourage engagement; and in acquiring the best, most cost-efficient technologies for collection and MRF operation. They also must coordinate their operations with sales staff and go-between businesses seeking end markets for their recycled products. Throughout this process, waste management agencies must coordinate their activities with government policymakers and enforcement staff, educators and advocacy groups, customers, local communities that may be impacted by their facilities, and technology providers that wish to promote and sell their equipment and management services. While this section provides a brief overview of these stages, they will be discussed further throughout the rest of this chapter and report. In addition, many of the upstream influences in Figure 2-3 propagate downstream to affect concurrent or subsequent decisions. For example, end market performance is determined by the cumulative effects of system design decisions made by waste and recycling companies as well as regulatory decisions, incentives, and subsidies (e.g., to improve access to recycling) by government agencies at different local, state, national, and international levels.
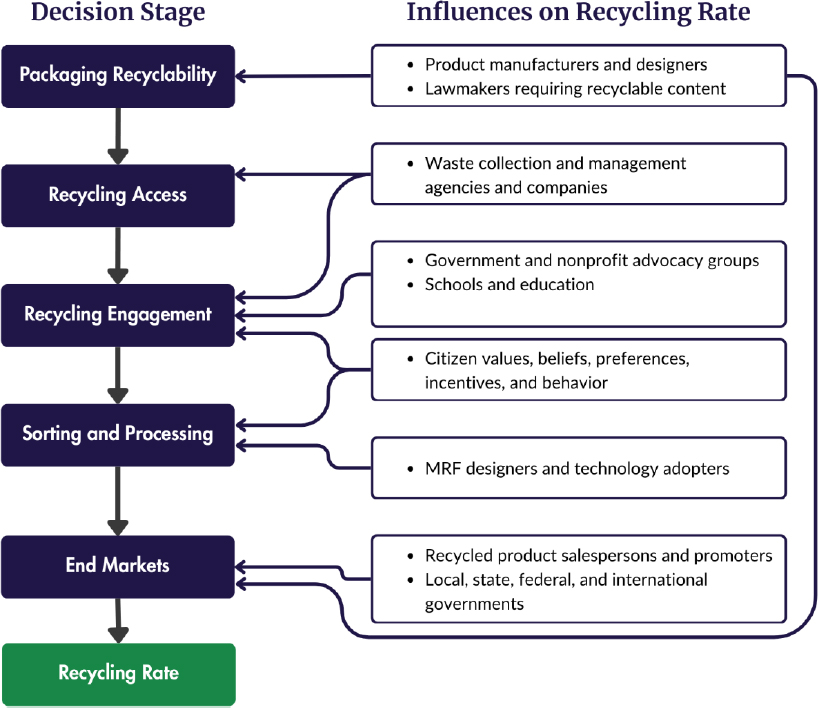
NOTE: MRF = materials recovery facility.
SOURCE: Data from The Recycling Partnership.
Packaging Recyclability
To improve recyclability, manufacturers need to design products and their packaging in such a manner that their delivery, use, sorting, reuse, collection, and processing are relatively easy for decision-makers to learn and implement, with limited added time and effort required for household waste management. Upstream, manufacturers need to design for and use recycled materials as inputs. These choices are increasingly motivated by state and local extended producer responsibility (EPR) laws and requirements for life cycle environmental impact assessments (see Chapter 4).
Recycling Access
Recycling access is generally provided to the public through curbside pickup programs or drop-off bins, which may be material specific. Access to recycling is generally high in the United States (73 percent); however, this rate is much higher for single-family homes (~85 percent) than for multifamily housing (~37 percent) where recycling dumpsters are more common (The Recycling Partnership, 2024). The comparatively lower rates of recycling access for residents who live in multifamily housing contributes to concerns that low-income neighborhoods face additional barriers to receiving the positive environmental impacts of recycling.
The collection of waste and recyclables typically represents about 75 percent of the costs of MSW management, while processing and disposal account for about 25 percent of those costs. Not all recyclables
are created equal. Determining which materials to collect in a recycling program can be informed by a variety of parameters:
- Quantity of materials generated (or present in the disposed waste stream)
- Ease of collection and processing (e.g., adding the material to an existing recycling program)
- Public sentiment or resident demand for collection of specific materials
- Strong, stable market pricing with a positive demand outlook
- Proximity of markets to the MRF (reducing transportation costs).2
Recycling Engagement
A high level of consumer engagement is necessary to direct appropriately chosen, clean waste products from the home to the recycling facility. For those with access, recycling engagement is motivated by public outreach programs, educational materials, and presentations, and by influence from neighbors and friends as recycling becomes a social norm among the general population. States with higher access rates tend to have higher engagement rates, as multiple efforts to provide access signal the importance and support for recycling (Eunomia Research and Consulting, 2023). MSW planners and policymakers nationwide continue to target improvements in engagement (see Chapter 6).
Sorting and Processing
Sorting and processing are primarily provided at MRFs using a combination of optical scanning; air flotation; mechanical redirection; manual sortation; robotics, visual identification using artificial intelligence (AI), and size, magnetic, and weight sorting technologies. Ongoing improvements in these technologies have enabled a typical MRF to capture about 87 percent of its incoming accepted program recyclable materials (The Recycling Partnership, 2024). The highest capture rates are achieved for high-density polyethylene (HDPE) bottles and jars (93 percent) and steel cans (96 percent), while the lowest are estimated for non-bottle polyethylene terephthalate (PET) (60 percent) and film and flexible material, where those materials are accepted (40 percent). It is anticipated that new and better computerized or AI-driven air, optical, and mechanical systems will allow MRFs to approach 95 percent overall capture in the near future (The Recycling Partnership, 2024). Still, consumers will need to ensure that used products are free of contamination from food waste, non-recyclables, or potentially hazardous materials to allow MRF performance at this high level.
End Markets
Viable end markets are necessary to ensure that recycled products can be sold and reused at an economically sustainable price to create benefits for society. Over the long term, an end market that requires high government subsidies to stay in business will erode the confidence of investors, taxpayers, and recycling service consumers. Identifying and securing markets for collected materials are central to the cost-effectiveness, design, and operation of recycling programs.
One of the growing drivers of end-market demand comes from companies that have committed to using recycled materials in their products and packaging. These commitments may stem from increased consumer valuation for products made and packaged with recyclables, EPR requirements, or a general wish by manufacturers to be viewed as a green company (e.g., Iannuzzi, 2024).
As noted above, the location of end-market facilities and production operations affects transportation costs and the revenue paid for the materials. Having a variety of end markets for each material type is beneficial to help maintain demand for materials despite fluctuations in virgin material prices and other
___________________
2Transportation costs can be higher for MRFs in rural areas compared with those in more developed areas, which tend to be closer to highways.
changes in market conditions. When processing facilities have good access to major transportation routes (highway, rail, boat, or barge), they have more flexibility in selecting end markets. West Coast communities, for example, have much easier access to Asian markets for recyclables than do communities in the rest of the country.
2.1.2 Infrastructure and Access in the MSW Management System
The collection, processing, and marketing of recyclables are interdependent components, and each must be considered when designing and operating a recycling system as they affect one another. For example, changes in collection methods and materials collected will impact the design and operation of the MRF; how the MRF is designed and operated will determine whether materials will be produced that meet market specifications; and changes in market requirements may lead to changes in how materials are collected and processed. Furthermore, these systems must be designed and operated considering the material that is presented, which is dictated by manufacturing and purchasing decisions.
Collection Programs
A variety of approaches and configurations has been used to implement MSW recycling in the United States, principally curbside collection and drop-off programs. Collection services for recyclables are generally provided on a weekly or biweekly basis to single-family residences. Collection for businesses is often more frequent. Collection services are arranged in a variety of ways, including by contract, public entities, and franchise. In communities where residential waste collection services are organized on a franchise basis, one or a few entities may provide services to all residences in the franchise district. Municipal collection and, contracting is also common in portions of the United States.
In terms of facilitating the collection and processing of appropriate wastes, curbside collection programs are generally recognized as having the greatest potential for effective MSW recycling (Best and Kneip, 2019; Dahlen and Lagerkvist, 2010; Noehammer and Byer, 1997). Curbside collection of residential recyclables is provided in thousands of communities in North America and is the most convenient recycling option for residents. However, operations must be compatible with the processing capabilities of the MRF that will be receiving the collected material. For example, a program that collects materials in a single stream (several types of recyclables collected together) would be a poor choice if local MRFs are unable to process commingled materials. One of the most significant challenges facing managers of curbside programs is participation. Inconsistent participation can affect material volumes and equipment or labor needs, impacting operations (e.g., efficiency of truck routes) and costs. Other challenges include contamination, labor, equipment replacement, and fluctuating demand and pricing for recyclables and the ever-changing recycling mix (e.g., the significant drop in newspaper recycling).
Drop-off programs are the oldest form of public-sector-provided recyclables collection and are used by both residential and commercial participants. Drop-offs rely on individuals to bring recyclables to a designated drop-off location. For convenience, these locations are typically in public spaces, often at landfills or transfer stations where the public is already traveling to dispose of waste, as well as drop-off centers in retail locations. Drop-off collection is most often used to serve rural communities with low population density, where curbside recycling may be cost-prohibitive. Drop-off collection points may have higher contamination levels and engender illegal dumping if they are not staffed or monitored.
Single-day, or weekend collection events are often used to collect materials generated in smaller quantities that are not cost-effective to collect on a more frequent basis. They typically target materials that are banned from landfill disposal, such as used oil, tires, household hazardous wastes, electronics, and bulky items (e.g., appliances). Shredding events are becoming more prevalent as residents look for confidential recycling options for their personal documents. These events are often held in a large parking lot or public works yard to accommodate significant traffic flow. They also provide an educational opportunity for management of all types of recoverable and recyclable materials.
Commercial recycling collection may be performed in a manner similar to residential curbside recycling, using either wheeled carts or larger containers or designated collection vehicles and containers (e.g., trucks with large roll-off containers). For businesses with suitable storage space or large quantities of specific material (e.g., cardboard), collection may be provided by material brokers, with collected material being hauled to markets directly. In addition to storage space, having a baler on-site can facilitate direct-to-mill options for commercial materials. Space constraints are common, impacting the collection method and frequency selected by commercial operations.
Collection Methods and Equipment
Methods for collecting recyclables include segregated, dual stream, single stream, and mixed waste. The chosen method determines what type of equipment is needed for collecting and storing the recyclables.
- Segregated (source separated): Recyclable materials are manually sorted at the location where they are first discarded, such as homes or businesses, into designated containers or specific compartments within the collection vehicle. This multistream method is most often used in communities with limited processing capabilities and is found in both commercial and residential programs. Collection productivity is relatively inefficient, resulting in high collection costs relative to other methods. This method includes source-separated organic waste, which can be converted into fuel or compost.
- Dual stream: Fiber (newspaper, cardboard, office paper) and container (plastic, aluminum, bimetal, glass) recyclables are separated by the resident. Each stream (fiber and containers) is loaded into its own compartment in the collection vehicle, which may or may not be compacted. Dual-stream collection capitalizes on the initial labor provided by the participating residents. It produces cleaner recycled materials, especially paper, because it is not contaminated with broken glass and small plastics.
- Single stream: Recyclables are collected in a single, fully commingled form and subsequently separated and processed into marketable secondary materials at a MRF. Single-stream recycling is now the most commonly used method of collecting recyclables because of its convenience and popularity with consumers and its ability to accommodate a large and varying amount of recyclables. Its high efficiency and low costs are attributed to its ability to use automated collection trucks staffed by a single operator and the safety it provides the operator, who does not have to exit the cab to collect the recyclables. Programs that grow in size and volumes of material collected exert more pressure to consider additional commingling of recyclables because of the operational benefits provided and the ease of participation by generators. Many dual-stream programs have been or are being converted to single-stream programs where MRFs are equipped to process the single-stream material.
- Mixed waste: Relatively few facilities in the United States process mixed “residual” waste for the purpose of producing “spec fuels” for industries such as paper mills or cement kilns. Spec fuels generally consist of paper, plastics, and other organics that have energy contents that would contribute to the heating value of the fuel. These processing facilities generally include the sorting of recyclables remaining in the mixed waste for recovery and marketing to secondary materials markets.
Recycling containers provide material storage between collections and assist the vehicle operator during collection at the curb. In many recycling programs, bins or larger wheeled carts are provided at no direct charge to the residents, while others require residents to purchase containers or to purchase additional containers if one is insufficient. The choice of household container type must be consistent with the collection method, vehicle type, and material processing ability. For example, a 64-gallon wheeled cart for commingled recyclables will not work in a collection program with partitioned vehicles, where the local MRF
does not have the ability to separate materials and requires them to be source separated. The size and number of recycling bins or carts needs to match the collection frequency and the projected volume of recyclables.
In commercial contexts and multifamily dwellings, recyclables are typically stored in five types of containers: (1) individual containers similar to those for single-family residences, (2) larger bulk containers collected by either front- or rear-load collection trucks, (3) roll-off compactor boxes, (4) open-top roll-off boxes, and (5) rear-load van-type trailers. Selection depends on space available for containers and the types and quantities of materials to be collected.
Materials Recovery Facilities
MRFs receive, sort, process, and market recyclable materials collected from municipal waste streams, and they are integral to most municipal recycling programs. In early recycling programs, when recyclable materials were sorted curbside to minimize contamination and maximize resale value, materials were merely densified before being sent to market. As recycling programs expanded and the types of materials collected increased, more programs initiated commingled collection of more recyclables, thereby increasing the need for sorting at a central location.
In addition to the space used for processing equipment, MRF design typically includes a tipping area for material storage and a space for processed materials, with load-out bays or docks for removal of consolidated, sorted materials. The tipping floor and load-out areas are typically of reinforced concrete construction to withstand use and travel by heavy equipment. Most MRFs are enclosed structures, providing protection of recyclable materials (particularly fiber materials) from weather effects and limiting the potential for litter.
The challenge of a MRF is to transform recyclable materials into marketable resources for future use. Therefore, the requirements of secondary materials markets need to guide those designing MRFs with respect to the types and quantities of recyclables they will accept. Issues to consider include:
- Level of sorting necessary before and after delivery to the MRF
- Screening for and removal of dangerous contaminants, most notably lithium-ion batteries, in separated materials (see Box 2-1)
- Size and sorting capacity of the equipment in relation to the volume of material to be processed and daily and downtime capacity storage requirements
- Balance of mechanical and manual sorting needed
- Degree of processing and consolidation required for end-market acceptance and economical transportation
- Amount of storage required for accumulating sufficient quantities of recyclables for transport and docks and loading capacity
- Revenue projections for the sale of recyclables.
Challenges in Rural and Urban Areas
Many factors contribute to the differences in recycling infrastructure, access, and behaviors in rural and urban areas. Population density and the built environment affect transportation costs, volumes of material collected, and options for collection equipment.
Rural Communities
Rural communities face unique challenges, including time-consuming and inefficient collection, longer hauling of materials, and low population density. Burning waste in barrels and piles occasionally is
practiced in these areas, and therefore, may reduce the amount of waste to be collected.3 However, burning has its challenges, including air pollution, the long-term disposal of ashes, and dealing with items that do not burn. Recycling participation increases during times of burn bans, as residents seek to dispose of waste. It is unknown whether these increases are sustained after the bans are lifted.
BOX 2-1
Lithium-Ion Battery Fires
Fires caused by lithium-ion batteries now pose considerable risk and raise costs for the recycling system, in collection vehicles and particularly in processing by materials recovery facilities (MRFs). Although these batteries ought to be managed separately, residents sometimes include them with materials collected in single-stream curbside recycling and with ordinary waste. Estimates suggest that MRFs currently average 18 of these fires per year each, with catastrophic fires (those causing more than $10 million in damage) affecting 1 percent of MRFs annually.a Insurance costs for MRFs have risen because of the contribution of these batteries to their fire risk. The insurance cost increase may be in the range of $8–$40 per ton recycled, representing a significant share of processing costs (which are about $100–$200 per ton; see Chapter 4).a Although landfills also suffer fires from these batteries, MRFs face higher costs because they have more workers and capital exposed to the risk (EPA, 2021a). The problem of lithium-ion battery fires has emerged largely within the last decade and is likely to grow worse with widespread adoption of lithium-ion batteries in short-lived consumer products, such as disposable e-cigarettes (EPA, 2021a).
Some public policies in the United States attempt to reduce the extent to which these batteries enter the municipal solid waste and curbside recycling streams, although the U.S. Environmental Protection Agency (2021a) does not have authority to address them. For example, New York City and New York State have banned disposal of rechargeable batteries, and the state requires that manufacturers fund a recycling program for these batteries and that retailers selling these products accept returns and provide information to consumers (Eunomia, 2021).
European countries have tried extended producer responsibility and deposit–return systems on lithium-ion batteries. Although these policies appear to increase separate collection of batteries, their effectiveness at reducing fires at MRFs has not been demonstrated. Longer-run improvements in battery technology may eventually reduce the flammability of these batteries (EPA, 2021a). However, until that occurs, the mismanagement of lithium-ion batteries is likely to continue to impose costs and hazards for recycling and to add to the challenges that communities face in funding curbside recycling programs.
a Anne Germain, presentation to the committee, April 2024.
Instead of hiring a municipal waste management company, rural communities often rely on drop-off locations for recycling, which results in lower recycling participation rates (Morawski and Wilcox, 2017). Additionally, many rural areas have “mom-and-pop” waste management businesses that collect and haul waste to transfer stations. Minimal or unorganized collection services can result in illegal dumping along roadsides or even burying of waste on one’s property.
In areas with small populations and limited capacity for local collection and processing, as in some rural or isolated parts of the United States (e.g., parts of Alaska), backhauling is the main source of waste disposal. Backhauling occurs one to three times per year when a summer barge or truck makes deliveries to the community. After their goods are delivered, the vehicles are filled with bales of aluminum cans, containers of batteries, and other materials for proper disposal, with a focus on hazardous materials for environmental concerns. Backhauling is expensive, especially for residents in very small towns (e.g., <1,000 residents) (EPA Environmental Financial Advisory Board, 2019).
___________________
3Burn barrels are 55-gallon metal drums where trash is placed and burned. A burn pile is simply an area where trash is taken and burned.
Many small municipalities have tight budgets that restrict them from managing facilities independently and purchasing equipment to collect and manage recycling materials. County-wide collaborations are popular, allowing several small communities to work together. Hub-and-spoke recycling has been developed as a solution for helping rural communities work together on a regional level to consolidate larger volumes of recyclable materials. This model works by creating regional recycling processing centers within larger communities that serve as “hubs” and encourages smaller communities, or “spokes,” to deliver their recyclables to these hubs. As shown in Figure 2-4, spokes could be a small municipality’s recycling drop-off center, a town’s curbside collection program, or other recycling services, all of which have material streams that feed into the centralized recycling infrastructure of the hub (Nebraska Recycling Council, 2024). Private provider hubs handle the transfer of small-volume recycling from the spokes. Waste transfer stations can sometimes use storage bins and top-loading tip or walking-floor trailers in their truck yards, which are contracted by public convenience centers or those who use these hubs to service subscription routes with recycling.
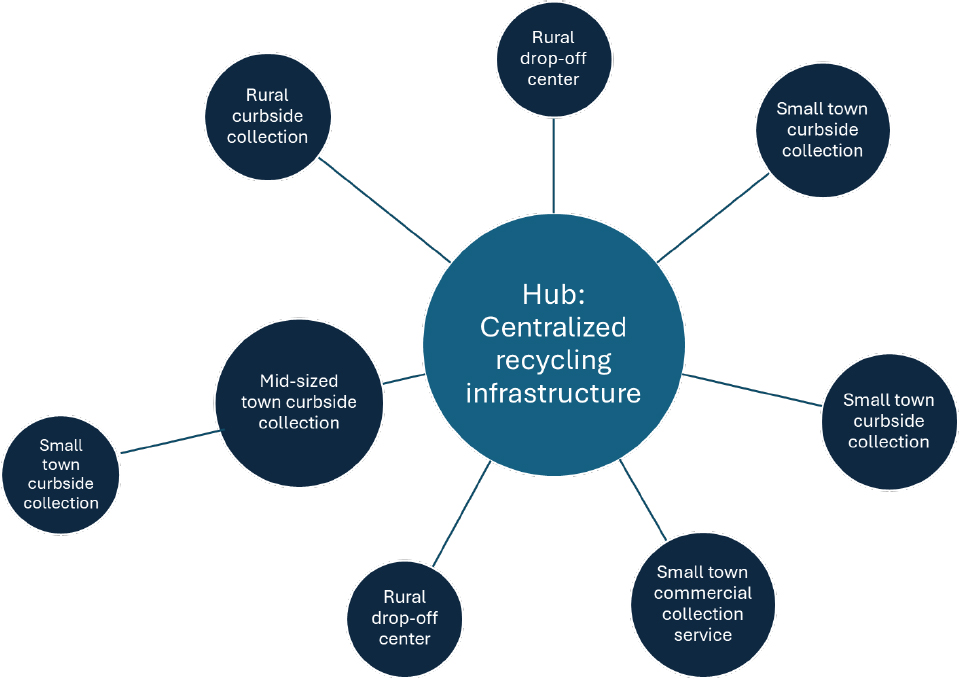
SOURCE: Generated by the committee, modeled after Nebraska Recycling Council (2024).
Recycling hubs invest in or solicit grants for equipment and infrastructure needed to sort materials, then use this equipment to create and store bales of materials for end markets. Spoke communities invest in or solicit grants for recycling collection and transportation to the closest hub. Hub-and-spoke systems greatly reduce transportation requirements and increase overall efficiency of program operations. Spokes’ transportation and operating costs decrease, while the hubs receive sufficient volume of materials to increase revenues, achieve economies of scale, and assist with operational costs. These types of programs also help small and remote communities implement recycling programs, reduce costs, and increase participation and recovery (Nebraska Recycling Council, 2019).
According to the Nebraska Recycling Council (2019), hub-and-spoke recycling can work in a variety of contexts, including:
- Recycling drop-off centers or trailers
- Public and private recycling operations
- Curbside recycling, either single or dual stream
- Towns in different counties or even across state lines
- Any type of recyclable material, including cardboard, plastic bottles and aluminum cans
Curbside Collection in Urban Communities
Compared with rural areas, urban areas tend to have more efficient and organized public and private programs. Despite this, urban areas face issues related to high volumes of waste and often limited space for bin placement.
Curbside collection of recyclables generally utilizes a large truck similar to those used for general waste, driving through the streets with a side-arm mechanism that picks up the cart and dumps its contents into the truck. Some trucks have cameras that allow the driver to review the contents as they are emptied into the truck and then provide feedback to the resident if the cart had materials in it that could be considered contamination. Thus, trucks with side-arm technology reduce labor costs, may result in cleaner communities, and may reduce contamination in the recyclables collected (Wise Guy Reports, 2024).
In older cities (e.g., New York City), narrow alleys and street parking preclude the use of side-arm trucks; in many of these areas, employees must pick up bags from the sidewalk or empty carts by hand. Using this method results in higher labor costs, employee injuries, litter in communities, and contamination in recyclables collected. In urban areas, safe curb-side waste collection has public health implications, as it reduces vermin populations and leakage of the materials (Budds, 2022).
2.2 MSW MANAGEMENT
MSW management is a complex and evolving industry. This section first reviews estimates of the quantity of MSW collected in the United States today, and the portion that is recyclable. It then describes objectives, frameworks, and performance metrics used to evaluate waste management systems.
2.2.1 Quantity and Composition of MSW
The tonnage of MSW collected in the United States annual has increased every year since it was first recorded (88.1 million tons in 1960). Comparing tonnage and population rates from 1960 and 2018, the per capita generation rate has increased by 82 percent in 60 years. While it is not known precisely what percentage of MSW is residential versus commercial, EPA estimates that residential waste makes up 55 percent of MSW, and commercial waste 45 percent (EPA, 2020).
The most recent national-level data on recycling as reported by EPA (for the year 2018) indicate that recycling plays a significant role in managing waste in the United States. For 2018, EPA estimated that 292.4 million tons of MSW were generated, of which 69 million tons (24 percent) were recycled and 25 million tons composted (EPA, 2024). More recent data by The Recycling Partnership (2024) estimates that 10 million tons of MSW—or 15 percent—were recycled through residential curbside and drop-off recycling programs in 2024, representing only 3.4 percent of the MSW generated (based on 2018’s EPA estimate). These data suggest that commercial and multifamily recycling accounts for 85 percent of the recycling tonnage recovered from the MSW stream (see Table 2-1). However, since multifamily residential recycling rates are significantly lower than single family residential recycling rates, it is reasonable to assume that commercial recycling accounts for the major portion of the commercial/multifamily recycling tonnage.
The Recycling Partnership (2024) further reports recent data indicating that only 21 percent of residential recyclable material is being recycled, with 76 percent of this material lost at the household level. While a reported 73 percent of U.S. households had access to residential recycling in 2024, this number was significantly less for multifamily households (37 percent), and overall household participation in recycling was just 43 percent. Much of the material collected in recycling programs is directed to about 500 MRFs (National Waste and Recycling Association, 2018).
At the start of the COVID-19 pandemic, in March 2020, residential waste volumes increased abruptly, while commercial waste volumes decreased (Pinto et al., 2022). However, as stores started reopening and people resumed going out, commercial volumes substantially increased. E-commerce as a percentage of retails sales peaked in the fall of 2020, declined significantly, and only recently achieved the earlier percentage of retail sales, according to Department of Census data on e-commerce.4 While these volumes may not have remained the same after the pandemic, they could reflect a shift in the types and amounts of materials used across different sectors. However, more important are the longer-term trends in packaging and product delivery, including glass losing market share to plastic and aluminum, adoption of flexible plastics, decline in printed paper, and increased home delivery. The evolution of packaging used in e-commerce continues to evolve.
TABLE 2-1 MSW Recycling in Residential and Commercial/Multifamily Sectors
| Material | Total Recycled | Curbside Recycling from Single-Family Residences | Commercial and Multifamily Recycling | |||||
|---|---|---|---|---|---|---|---|---|
| Tonsa | % of Total Recycled MSW | Tonsb | % Residential Single Family Recycling | % Total | Tonsc | % Commercial/Multifamily Residential Recycling | % Total | |
| Paper and Paperboard | 45,970,000 | 67% | 5,808,858 | 54.1% | 12.6% | 40,161,142 | 68% | 87% |
| Glass | 3,060,000 | 4% | 2,152,303 | 20.4% | 70.3% | 907,697 | 2% | 30% |
| Metals | 8,720,000 | 13% | − | 8,720,000 | 15% | 100% | ||
| Ferrous | 6,360,000 | 9% | 231,156 | 3.0% | 3.6% | 6,128,844 | 10% | 96% |
| Aluminum | 670,000 | 1% | 393,488 | 3.4% | 58.7% | 276,512 | 0% | 41% |
| Other Nonferrous | 1,690,000 | 2% | − | 1,690,000 | 3% | 100% | ||
| Other Materials | − | − | ||||||
| Plastics | 3,020,000 | 4% | 1,552,576 | 19.1% | 51.4% | 1,467,424 | 2% | 49% |
| Rubber and Leather | 1,670,000 | 2% | − | 1,670,000 | 3% | 100% | ||
| Textiles | 2,510,000 | 4% | − | 2,510,000 | 4% | 100% | ||
| Wood | 3,100,000 | 4% | − | 3,100,000 | 5% | 100% | ||
| Other | 970,000 | 1% | − | 970,000 | 2% | 100% | ||
| Total MSW recycled | 69,020,000 | 100% | 10,138,381 | 100.0% | 14.7% | 58,881,619 | 100% | 85% |
a Data from EPA Advancing Sustainable Materials Management 2018 Tables and Figures, p. 2.
b Data from The Recycling Partnership – The State of Residential Recycling 2024, Figure 14.
c Tonnages in the Commercial Recycling column are the differences between the Total Recycled and the Curbside Recycling columns.
NOTE: MSW = municipal solid waste.
___________________
4See https://www.census.gov/retail/ecommerce/historic_releases.html.
The EPA study (2020) differentiates between “materials in products”—such as paper, glass, metals, and aluminum that can be recycled—and organic materials—such as food waste and yard trimmings that can be composted. In 2018, about 189.76 million tons of “materials in products” waste were generated, while 98.5 million tons of organic waste were generated (EPA, 2020).
The quantities and types of materials in the waste stream continually shift because of evolving technologies, consumer preferences, and product types. As a result, the composition of the waste stream has changed dramatically over the last 35 years. General trends have been the replacement of glass container discards with plastics, the reduction in newspaper discards, the increase in cardboard waste due to e-commerce, and the increase in plastic containers and other plastic products. These trends and the corresponding per capita increase in waste production have led to an increased effort to reduce waste generation through the design of products with fewer disposable materials, parts, and packaging, and to reduce, reuse, and recycle waste. These efforts, in conjunction with improvements in the design and performance of landfilling and thermal treatment (and to a lesser extent, mechanical or biological treatment) for that portion of the waste stream that is not reused or recycled, now constitute the principal elements of solid waste management programs in the United States and other countries (Awino and Apitz, 2024; Devi et al., 2024; Khan et al., 2022; Sharma and Jain, 2020, Sondh et al., 2024; Tsai et al., 2020).
2.2.2 Objectives for MSW Management
Objectives for MSW management typically include (1) providing the essential public service of waste management in an efficient and affordable manner; (2) reducing the health impacts, environmental damage, and contamination that results from mismanagement of solid waste; and (3) sustaining access to raw materials and other natural resources that are lost to the economy when they are disposed without reuse or recycling.
Several analytical frameworks have been developed for evaluating MSW management:
Flow tracking models:
- Material flow analysis evaluates the mining of raw materials through production, consumption, recycling, and disposal (e.g., Allesch and Brunner, 2015; Arena and Di Gregorio, 2014; Harder et al., 2014; He and Small, 2022; Makarichi et al., 2018).
- Energy flow models track the amount of heat, electricity, and other forms of energy generated, lost, or used for living requirements and economic activity in a region (Subramanyam et al., 2015).
- Measures of progress toward a circular economy (Chioatto et al., 2023; Dumlao-Tan and Halog, 2017; Meleddu et al., 2024; Salemdeeb et al., 2022; Tsai et al., 2020; Vines et al., 2023).
- Life cycle assessment of energy use and environmental and health impacts (Anshassi and Townsend, 2023, 2024; Olafasakin et al., 2023; Wang et al., 2021, 2022).
- Multicriteria analysis, including economic and social sustainability and resilience (Goulart Coelho et al., 2017; Gutierrez-Lopez et al., 2023; Jayasinghe et al., 2023; Makarichi et al., 2018; Taelman et al., 2020).
- Metrics of economic efficiency in achieving high diversion rates for reuse or recycling at low cost and with low environmental impacts (Hu et al., 2024; Laner and Schmidt, 2023; Mensah et al., 2023; Ng and Yang, 2023; Prenovitz et al., 2023; Wilson et al., 2015).
- Economic models of incentives and market failures within the waste management system (Acuff and Kaffine, 2013; Fullerton and Kinnaman, 1995; Palmer et al., 1995).
MSW management objectives are met through the activities and efforts of multiple participants, including product manufacturers, shippers, commercial enterprises, consumers, educators, local government solid waste managers, waste collectors, and workers and managers providing waste recycling and disposal services. Oversight and governance are provided by government agencies and regulators, ensuring effective formulation and implementation of MSW policies, rules, and regulations, including requirements
for recycling (e.g., Baffoe-Bonnie and Ezeala-Harrison, 2023; Macauley and Walls, 2010; Ogieriakhi and Wang, 2024).
2.2.3 Performance Metrics for MSW Management Systems
Performance metrics play a valuable role in planning and assessing waste management program elements and outcomes. Across nations, states, and systems within a state or region, metrics help program managers and agencies benchmark and rank their programs and identify where changes and innovations would be most beneficial. Indicators can be designed to emphasize participation rates, the quantity of materials captured and recycled, program costs, and end-market performance.
Two case studies, presented in Boxes 2-2 and 2-3, describe system indicators for MSW management systems in New York and Florida. These cases studies are followed by a review of results from The Recycling Partnership’s (2024) study of U.S. state programs, with a focus on metrics for statewide material capture and loss.
Anshassi and Townsend (2024) also assessed environmental return on investment—comparing the environmental benefits with the cost of maintaining a recycling program—for two contract structures (Contract A and Contract B) in each Florida region (see Figure 2-5). The environmental return on investment for recycling for a typical household was similar to or higher than that of switching from a gasoline vehicle to a hybrid or electric vehicle or using renewable energy. In most cases, except for three regions in 2021, discontinuing recycling led to net dollar savings, which can be viewed as the cost of maintaining recycling. However, the study found that recycling programs reduced environmental impacts, with 0.34–2.4 times lower greenhouse gas emissions. This study also found that focusing on high-value materials in recycling programs reduces both environmental impacts and system costs (Anshassi and Townsend, 2024).
BOX 2-2
Case Study: Evaluating Selected Waste Systems in New York State
Greene and Tonjes (2014) reviewed the structure and intent of several municipal solid waste (MSW) management performance indicators, noting a general historical preference for recycling rate as a metric, and raising arguments for additional measures that address household participation and environmental and economic impact. Green and Tonjes (2014) categorized the metrics into four tiers.
Tier 1 indicators track the mass flow of waste to recycling facilities and landfills, as well as that diverted from landfill and incineration over a unit of time (typically annually). Tier 2 indicators convert the Tier 1 mass flows to rates measured as percentages by dividing by the total mass of waste collected. Tier 3 indicators calculate these rates on a per capita basis. Tier 4 indicators address reductions in energy- and climate-related externalities achieved by recycling programs.
Greene and Tonjes’s (2014) evaluated these indicators for ten municipal waste systems in New York State. They found that using different indicators yields significantly different rank ordering among systems; care and clarity is thus needed in indicator selection and presentation to avoid misunderstanding. Given such care, indicators can help support internal assessments of progress and program needs. Green and Tonjes (2014) found that several indicators were especially useful for general waste systems characterization:
- landfill disposal per capita
- diversion per capita
- diversion rate,
- landfill disposal rate
The authors noted however, that the choice of the best indicators depends on local and regional conditions and the waste management system design.
SOURCE: Greene and Tonjes, 2014.
BOX 2-3
Case Study: Assessing Recycling Programs in Florida
Anshassi and Townsend (2024) evaluated the costs, environmental impacts, and improvement strategies for municipal recycling programs in Florida’s six regions, paying particular attention to indicators of greenhouse gas emissions based on life cycle assessment. The study predicts the counterfactual effects of eliminating all recycling in each of Florida’s six regions.
The model by Anshassi and Townsend (2024) included costs for collecting and sorting and processing waste and recyclables. It accounts for composition of waste and recyclables, contamination rates, and end-market revenue generated from the sale of recyclables and it estimates the annual cost per household for curbside collection and management of recyclables and garbage for 2011, 2020, and 2021 under four illustrative recycling contracts. The four contracts account for variation in materials recovery facility (MRF) processing fees (in $/ton) and local government–MRF revenue-sharing agreements.
In addition to capital and operating costs, Anshassi and Townsend (2024) calculated the climate-related environmental impacts associated with alternative scenarios, including terminating recycling programs, increasing recycling rates, and targeting high-value commodity materials. They found that Florida’s recycling programs reduce greenhouse gas emissions, energy use, water use, the potential harm to human health, the risk of damaging ecosystems, and the likelihood of increasing acid levels in the environment (Anshassi and Townsend, 2024).
As an example of a region-level counterfactual, in Central Florida, the model indicated that eliminating recycling would increase greenhouse gas emissions by 0.377 t CO2 eq per household per year, which is equivalent to driving an extra 967 miles in a typical gasoline-fueled car (using 29 gallons of gas) (see Table 2-2 for estimated greenhouse gas emission increases). Note that the equivalent activity emissions of eliminating recycling are highest in Central Florida and lowest in Northwest Florida.
| Metric | Florida Region | |||||
|---|---|---|---|---|---|---|
| Northwest | Northeast | Central | Southwest | South | Southeast | |
| Miles driven by avg. gas passenger car | 195 | 423 | 967 | 660 | 935 | 483 |
| Gallons of gas consumed | 9 | 19 | 43 | 29 | 41 | 21 |
NOTE: Factors for each metric were retrieved using the U.S. Environmental Protection Agency greenhouse gas equivalencies calculator.
SOURCE: Anshassi and Townsend, 2024.
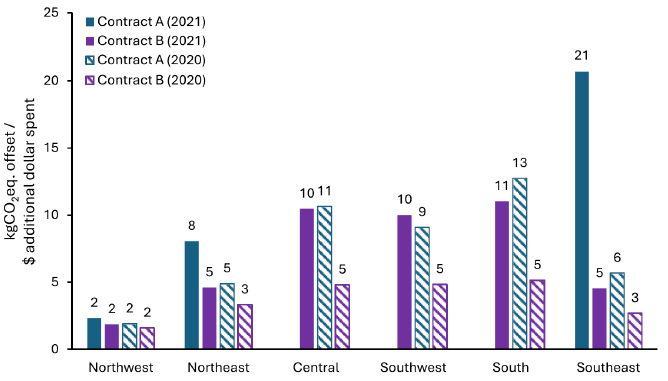
NOTES: Calculated as the estimated potential greenhouse gas emissions offset by recycling divided by the cost of recycling. For Central, Southwest, and South regions under the Contract A scenario in 2021, dropping recycling would result in a net dollar cost increase, instead of a savings (which is assumed to be the added cost of maintaining recycling). Accordingly, no return on investment is presented for these scenarios.
SOURCE: Anshassi and Townsend, 2024.
Location-specific studies of municipal recycling programs’ performance can allow a focus on specific features of a system and provide a basis for improved designs and operations. They may be based on detailed inputs and datasets, or they may have the ability to obtain such data as needed. In contrast, state evaluations often include approximations to account for incomplete datasets and uncertain aggregation. Despite these limitations, state evaluations provide a broadly based assessment of the factors that promote or limit the success of recycling programs and policies and allow citizens and their representatives to benchmark their state’s performance relative to that of others.
As has been referenced throughout this chapter, The Recycling Partnership (2024) conducted an extensive national and state evaluation of the status of recycling in the United States. Among many metrics, it studied two of the most widely used indicators of recycling efficacy: residential recycling rates (see Figure 2-6) and residential recyclable material lost (in tons per year; see Figure 2-7).
Recycling rates ranged from 8 percent in the southeastern United States to 37 percent in California and Oregon (The Recycling Partnership, 2024; see Figure 2-6). Residential recycling rates remain the most widely used metrics of recycling performance and impact but provide a limited picture of recycling activity and impact as it does not distinguish between composition, environmental impact, and disposition of recycled waste. Other metrics that reflect important dimensions of composition and impact need to be used in conjunction with these.
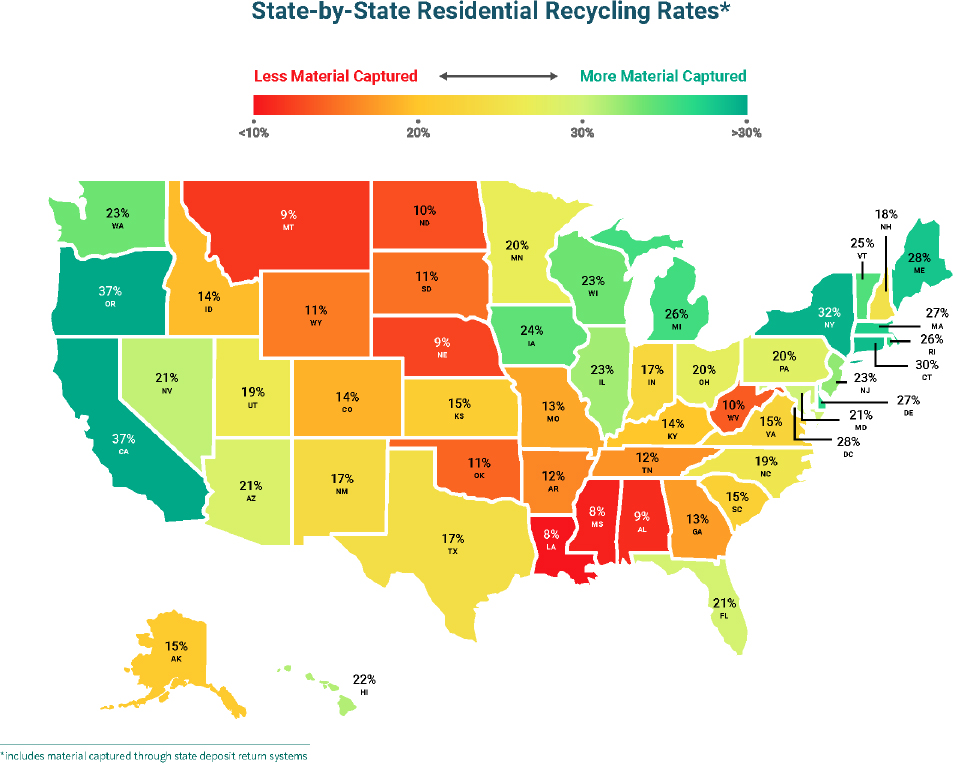
NOTE: Includes material captured through state deposit-return systems.
SOURCE: The Recycling Partnership, 2024.
An alternative metric (Figure 2-7) shows statewide estimates of residential recyclable material lost to disposal (e.g., in landfills). These values represent total flows of solid waste and are highly influenced by the state populations, with especially high estimates determined for California, Texas, Florida, New York, Pennsylvania, Ohio, and Illinois. While this metric, as assessed by recyclable material lost, provides a direct indication of a state’s overall waste-related environmental impact, the improvements resulting from recycling are masked by population and the total overall tons of MSW generated. In contrast the residential recycling rate in Figure 2-6 expresses the recycling efficacy as the percentage of waste captured by the recycling program.
The residential recycling rate (Figure 2-6) and residential recyclable material lost metric provide complementary information but are not independent. One approach that allows a more direct comparison of these indicators is dividing the material lost tonnage by the state population, yielding a per capita estimate of the material lost from recycling (see Figure 2-8). As expected, the data indicate a negative correlation between a state’s recycling rate and its tonnage of recyclable material lost—higher residential recycling rates tend to decrease the per capita residential recyclable material lost. This suggests that the trend shown in Figure 2-8 may be used for preliminary inference from state metrics such as estimating statewide recyclable materials lost from residential recycling rate, when the former data are unavailable. However, the spread in Figure 2-8 suggests that other factors may influence the rates as well and suggests a need for a more complete model.
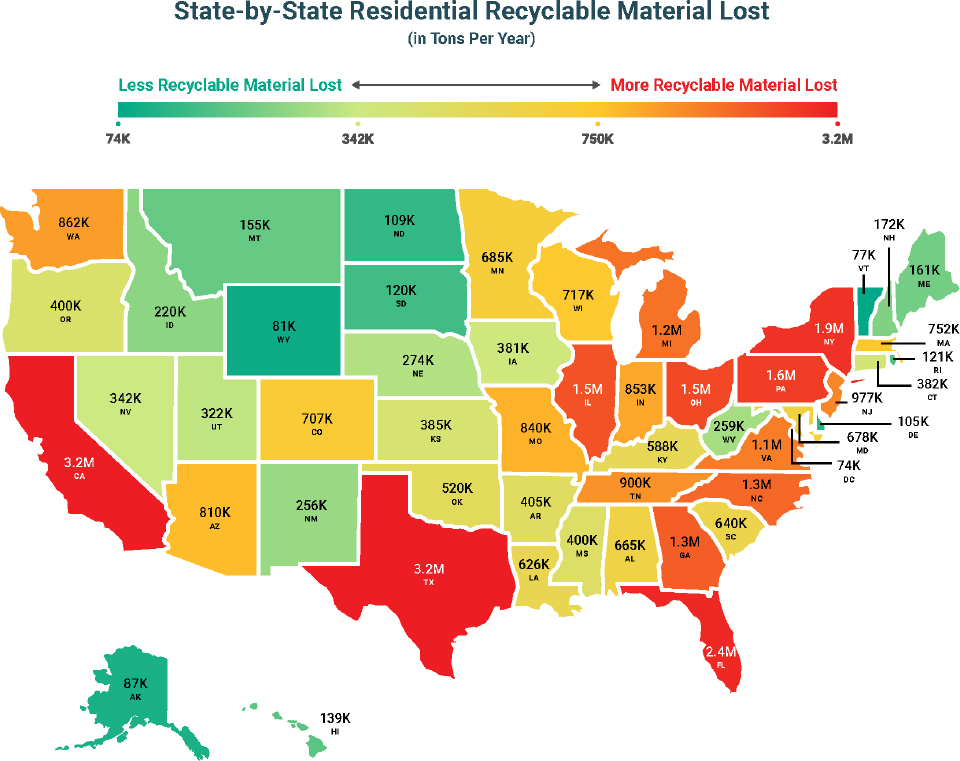
NOTE: Recyclable material here refers to all recyclables processed by materials recovery facilities and moved to end markets.
SOURCE: The Recycling Partnership, 2024.
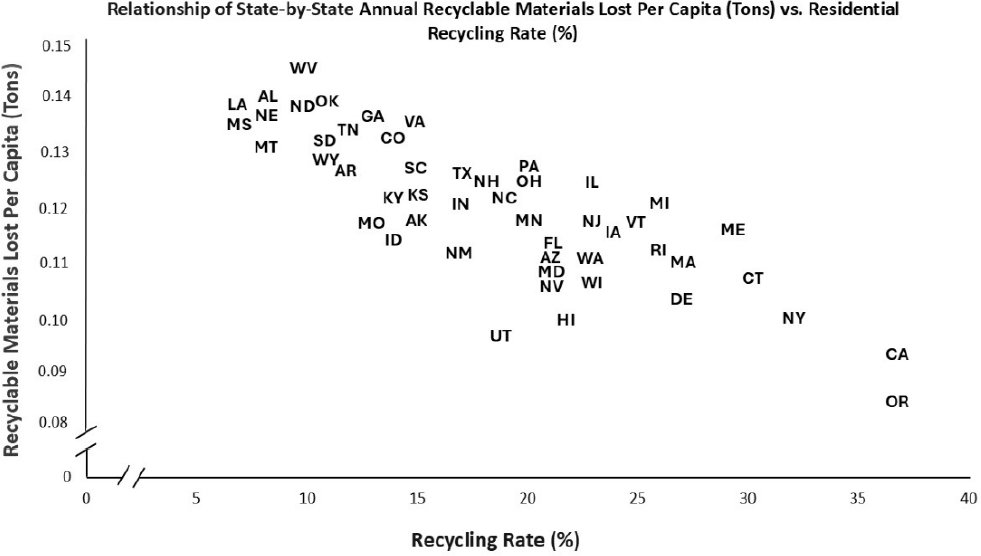
SOURCE: Data from The Recycling Partnership, 2024.
Nationwide Data on Status, Performance, and Engagement Metrics for MSW Recycling Programs
In addition to state-level data, The Recycling Partnership (2024) has identified the following key issues to be addressed using nationwide data:
- Twenty-one (21) percent of residential recyclables is being recycled—every material type is under-recycled.
- Seventy-six (76) percent of residential recyclables is lost at the household level, underscoring the importance of access and engagement.
- Only 43 percent of all households participate. Nonparticipation is due to both lack of access and insufficient communication and outreach.
- Of households that have access to curbside or drop-off recycling services, only 59 percent use their recycling service regularly, and of those that do, only 57 percent of recyclable material is put in recycling containers, meaning many households do not participate to the fullest extent possible. This participation rate is significantly lower than the 90 percent target benchmark that The Recycling Partnership (2024) sets for an effective recycling system.
Based on these data, it is often concluded that residents need more education, communication, and support to engage in recycling. However, a factor that is often not considered or discussed is that many residents—perhaps over 50 percent—do not feel that their participation in recycling is worth their time and effort. In other words, the results being achieved through residential curbside recycling programs (the diversion of 450 pounds per household per year) might be the maximum that can be expected from a program that involves the voluntary participation and effort of individuals on a regular basis. If system improvements needed to yield higher access, engagement, and overall recycling rates are not developed or implemented, then the fallback alternative may be to focus on more effective methods of recovering recyclables from the
mixed solid waste stream. Meanwhile, improved mechanical capture and recovery make necessary the creative efforts to educate and influence citizens to build a culture of participation.
2.3 TECHNOLOGICAL ADVANCES IN MSW RECYCLING
Technological improvements are being developed for multiple decision stages to increase the rate of municipal recycling, from product redesign for recyclability to machines to facilitate collection and processing (see, e.g., Box 2-4). While the latter tend to add upfront cost to MRFs, they promise to increase efficiency and the quality of produced recyclables. In the last 4 years, the fleet of U.S. single stream MRFs has spent close to $2 billion in retrofits and have announced that another $1 billion is to be invested in the next 3–5 years to take advantage of advancements in automation.
2.3.1 Intelligent Waste Bins
Another recent area of investigation is the use of intelligent waste bins. These bins sort recyclables into appropriate containers using sensors, Internet of Things networks, and data analytics (Kaverina, 2018). They may also be used to monitor quantities of material in large containers. Sensors could notify waste collectors that a bin is full, minimizing trips to pick up a partially full load and reducing spillover and littering. Sensors can monitor gas, temperature, odor, sound, and humidity, which may be useful in planning collection and disposal activities.
Interest is also growing in the use of technology that is AI-based and provides real-time feedback to individuals about recyclability of individual items (e.g., via mobile apps) prior to bin placement. However, these systems are not widely available because they require complex setup, controlled environments, and significant computational resources. Zhang and colleagues (2021) proposed a mobile-friendly waste classification model based on recyclable waste images and deep learning, with highly accurate results.
BOX 2-4
ReMADE Institute
The ReMADE (Reducing EMbodied-energy And Decreasing Emissions) Institute focuses on supporting efforts to use less energy in making and processing materials and products, which helps lower carbon emissions in manufacturing. This institute, funded by the Department of Energy’s Office of Energy Efficiency and Renewable Energy (EERE), is one of a national network of 17 manufacturing institutes under Manufacturing USA.
ReMADE has developed a Technology Roadmap that covers precompetitive research, industry-directed projects, large-scale initiatives, and strategic interest groups, all of which support the scaling-up of promising technology. ReMADE-funded projects address such areas as circular design, digital remanufacturing, full electric vehicle reuse and remanufacturing, next-generation materials recovery facilities, plastics recycling, recovery and recycling of e-scraps, and textile recycling. The overarching goals include reducing the need for primary materials and increasing use of secondary feedstocks, in part by developing technologies that make the secondary feedstocks economically competitive with or even preferable to virgin materials. These goals are bolstered by institute support for the adoption of new technologies and education materials for the attendant workforce.
The institute was designed as a public–private partnership and had over $65 million obligated from EERE through December of fiscal year 2026, with expected private contributions of $70 million through the first grant period. As of November 2024, ReMADE membership comprised 88 industry members, 38 academic partners, 34 affiliate organizations, and 8 national laboratories, and had 39 completed, 41 active, and 13 pending projects.
SOURCE: More information available at https://www.usaspending.gov/award/ASST_NON_DEEE0007897_8900 and https://remadeinstitute.org/.
2.3.2 Advanced MRF Technologies
2.3.2.1 MRF Automation
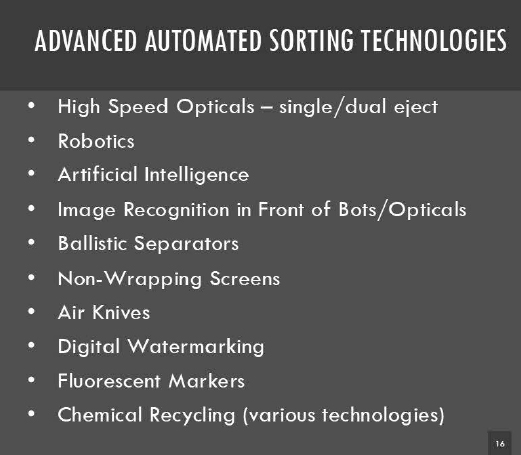
Although data on MRF age are not collected, many MRFs were built several decades ago when MSW had a different composition and was generated at lower rates. The introduction of automation in the 2010s has been crucial for producing high-quality secondary materials for recycling. However, automation significantly increases capital expenditures, meaning larger MRFs with higher processing capacity and broader service areas are needed to justify the investment. At the same time, automation helps lower operational expenditures, reducing ongoing processing costs. With automation and robotics, MRF operations can expand to 24 hours per day with minimal downtime. Automation reduces risk by reducing injuries associated with manual labor. The addition of automation may also allow recycling to reach higher levels at MRFs primarily using manual labor. Automation can eliminate screening, which is subject to clogging and requires frequent maintenance, and can reduce contamination of sorted materials (The Recycling Partnership, 2024; see Figure 2-9). That said, while isolated communities with long spoke distances to a hub may have lower processing costs, their collection system is effective. Small-volume MRFs that use less automation can allow for processing lightweight packaging and increase recycling rates competitively through freight savings. Many of these MRFs are independent or municipally owned and have persisted for decades.
SOURCE: Presentations to the committee by Nathiel Egosi, June 11, 2024, and Jim Frey, June 11, 2024.
Optical sorting uses a spectrometer or AI-assisted camera image recognition to identify recyclable material and uses high pressure air systems to separate it from the waste stream. Optical sorters can sort two materials away from the stream at the same time instead of one. They are highly accurate but rely on optical properties rather than shape. For example, they can detect material composition, such as the difference between PET and HDPE plastic, based on how they reflect infrared light. However, they cannot distinguish dark-colored materials. Some packaging manufacturers are adding radio-frequency ID tags to recyclables that can be recognized by sorting sensors.
Financing automation in a MRF is a challenge and its impacts on collection programs is substantial. Automating MRFs requires private and public financing through issuance of bonds, savings from reduced landfill or incineration costs (avoided cost of disposal), funds produced from selling recyclables, and grants
from state and federal agencies. These funding dynamics have fundamentally changed the business model of recycling—widespread MRF processing charges are now the norm, the main source of capitalization, and a central feature in the discussion of system financing. This creation of a consistent revenue stream has fueled massive investments in new and revamped MRFs, but it has also added a cost burden to collection programs in delivering materials to MRFs ($100/ton is typical). Some state programs respond to these significant shifts. For example, one of the objectives of Oregon’s EPR5 program and the proposed Program Plan by the Circular Action Alliance in Colorado6 is to have these “gate rates” covered by EPR fees, reducing the direct cost burden to municipalities and haulers in transacting with MRFs.
While automation may be more practical in urban areas than in smaller communities, the reduced cost of operation may justify transporting recyclables longer distances. Although automation reportedly can increase MRF efficiency, a remaining concern is that, instead, increased automation leads to escalating electricity demand and associated costs. As targets for recycling efficiency increase and more advanced technology is developed and implemented for improved MRF performance, greater expectations and costs may be shifted to upstream sorting and collection to meet MRF specifications. This shift will likely lead to changes in financing agreements, with coverage of shortfalls by collectors possibly addressed by other mechanisms, such as by EPR fees (Bradshaw et al., 2025; Liu et al., 2024). See Box 2-5 for a case study of one company using automation in a MRF.
BOX 2-5
Case Study: Rumpke Recycling & Resource Center
Rumpke Waste & Recycling Services provides waste management for 50 Ohio counties; it serves a population of around 3 million, and 96 percent have access to a curbside recycling program. Rumpke recently opened a state-of-the-art facility, including a highly advanced materials recovery facility (MRF) and education center. The MRF can process 250,000 tons per year at speeds from 30 to 60 tons per hour, and it includes sufficient redundancy to have 97–98 percent uptime. The MRF is equipped with ballistic separators, trommel screens, 19 optical sorters, magnetic separators, eddy current processors, balers, and artificial intelligence–assisted features for material tracking and characterization. Optical sorters are used for two- and three-dimensional separation of plastics and paper fiber, minimizing manual sorting. The process includes recirculation of waste material to ensure that capture of the maximum amount of recyclables. In fact, Rumpke expects to recover 98 percent of recyclables moving through the MRF. The company has invested $100 million in the facility.
SOURCES: Weiker, 2024; see also https://www.rumpke.com.
2.3.2.2 Artificial Intelligence
AI is expected to become an industry standard to address the complexity and expense of recycling collection and processing. It can play multiple roles in improving efficiency, increasing throughput, and reducing contamination. For example, AI can monitor waste materials through the MRF to power an analytical dashboard. It can optimize truck routes and logistics with a combination of GPS and GIS. And it may produce data streams that could be useful to future modelers.
The addition of AI to optical sorting is particularly useful, as it can differentiate colors and shapes through computer visioning, image recognition, and convolutional neural networks (Fang et al., 2023). Combined with machine learning, the systems can continuously adapt to changes in waste streams and recognize dirty, deformed, or damaged materials that are still recyclable.
___________________
5See https://www.oregon.gov/deq/recycling/Pages/Modernizing-Oregons-Recycling-System.aspx.
6See https://circularactionalliance.org/circular-action-alliance-colorado.
2.4 KEY POLICY OPTIONS AND RECOMMENDATIONS
Effective recycling policies require a combination of clear goals; strategic investments; and coordinated efforts across government, industry, and communities. This section outlines key policy options and recommendations for enhancing recycling systems, improving material recovery, and supporting sustainability objectives.
2.4.1 Setting Recycling Goals
Policymakers at all levels of government and other actors across the waste management and recycling system set recycling goals to identify desirable outcomes of policies and programs. Recycling goals may be used to identify benchmarks, measure progress, evaluate success, and simplify the communication of a policy’s or program’s purpose to important stakeholders (e.g., constituents and citizens of a community, businesses, company shareholders). Some entities assess progress toward sustainability using a broad set of metrics, including recycling rates, diversion rates, greenhouse gas reduction targets, cost savings, and job creation. This range of metrics reflects economic, environmental, and social goals related to sustainability.
EPA’s MSW Recycling Rate Goals
The most widely used metric for evaluating recycling progress remains EPA’s (2020) MSW recycling rate calculated as the total weight of recycled MSW divided by the total weight of generated MSW. The popularity of this metric stems from its simplicity and applicability across states and regions, making it accessible to a range of stakeholders. In general, however, methodologies for calculating recycling rates vary dramatically, according to which materials, processes, and sources of materials are included in the calculation.
Many states and provinces established recycling goals, such as a 25 percent MSW recycling rate, 20 or more years ago. In recent years, as some state-level goals have been attained and surpassed, some states are reevaluating and increasing recycling goals. Furthermore, some communities have adopted a “zero waste” or “circular economy” framework to organize and communicate their waste and recycling goals. At the federal level, EPA recently established the National Recycling Goal to increase the MSW recycling rate to 50 percent by 2030.7
However, for several reasons, the overall aggregation of weight-based recycling is insufficient to set a recycling goal as a policy. Limitations include lack of differentiation between material types, social goals for recycling, changing rates of total MSW, and the need to distribute responsibility across the system of actors.
First, the sum of the weights of recycled materials in the numerator does not adequately address important factors related to the heterogeneity of materials, including the relative environmental benefits of recycling each type of material. For example, weight does not account for how recycling a given material decreases natural resource extraction and landfill disposal. Recycling 1 ton of aluminum offers significant environmental advantages, such as reductions in energy use, greenhouse gas emissions, and human ecotoxicity. In contrast, recycling 1 ton of glass has much smaller environmental benefits. The weight-based approach overlooks these distinctions.
Second, social goals for recycling have often been overlooked or regarded as indirect factors. Although EPA’s (2021b) national recycling strategy advocates for a more equitable and inclusive approach to waste management, it lacks indicators to track access and inclusion.
Third, the relevant environmental and social goals relate to recycling itself, in the numerator of the recycling rate, not total MSW as the denominator. While use of the ratio helps put recycling in context, it
___________________
7See https://www.epa.gov/circulareconomy/us-national-recycling-goal.
would be more appropriate if the denominator (total MSW generated) were fixed. However, many factors will alter total MSW before EPA’s target year (2030), potentially distorting the ratio. For instance, shrinking overall MSW generation rates would artificially increase recycling rates. Conversely, changes that increased total MSW generation may be perceived as decreasing the recycling rate when in fact it is associated with economic growth and improved lives. For example, a reduction in virgin materials prices would help consumers, but it could lead to more MSW and reduce the recycling rate, even if consumers increase their quantity of recycling in the numerator.
Fourth, the onus to reach recycling goals sometimes falls largely on households, ignoring upstream and downstream decisions that also affect the recycling rate. For example, simple MSW recycling rate goals often ignore whether particular wastes can be recycled at all (e.g., how much plastic waste fits the definition recyclability of the Association of Plastic Recyclers8). They may also ignore whether adequate end markets exist for materials collected. Considering these factors would yield more realistic recycling goals and would better support holistic policy decisions across the MSW management system.
Expanding from the MSW Recycling Rate
For these reasons, the committee asserts that traditional recycling rate goals need to be augmented with new goals established around sustainable materials management (SMM). This framework focuses on enhancing the environmental, social, and economic benefits through all life stages of a material, concepts that are discussed throughout this report. Environmental, social, and economic benefits can be realized across the value chain of a product’s extraction, manufacture, use, and end of life. This concept is driven by robust data and can provide transparent and quantifiable progress toward societal betterment.
A common framework for effective goal setting is the “SMART” mnemonic that lists five critical components of effective recycling goals, or any other goals (Hammond et al., 2015):
- Specific: Is the goal clearly defined? Does it address “what,” “why,” and “how”?
- Measurable: Is it possible to track progress and measure the outcome?
- Achievable: Is the goal realistic and attainable?
- Relevant: Does the goal align with long-term objectives?
- Time-bound: Does the goal have a deadline or a time frame to work within?
Using a SMART goal-setting method will support more standardization among the range of stakeholders while retaining the simplicity and applicability of the current metric.
Recommendation 2-1: Goals for recycling policy should expand from weight-based recycling rates to include informative metrics for sustainable materials management. To support these efforts, the U.S. Environmental Protection Agency should study how to combine multifaced sustainability goals into an overall policy framework, provide guidance for state and local governments to set and measure progress toward those goals, and use this information to evaluate progress. National recycling goals should be material specific but flexible to account for heterogeneity across regions and municipalities. These goals should include environmental, social, and economic targets, including cost-effectiveness. Goal-setting should be leveraged to design a policy framework and set new national recycling goals using best practices such as life cycle assessment and SMART (specific, measurable, accessible, relevant, and time-bound) metrics.
___________________
8See https://plasticsrecycling.org/apr-design-hub/apr-design-guide/pet-rigid.
2.4.2 Identifying and Filling Data Gaps and Needs
Data collection, reporting, and analysis are essential for guiding recycling policies and improving overall recycling program effectiveness. Reliable data sources are also necessary to properly assess and evaluate the impacts of specific policy choices, including those recommended by this committee. Unfortunately, recycling data are outdated, incomplete, or inaccessible. Throughout this report, the committee identifies data problems that hinder informed decision-making in waste and recycling systems at the national, state, local, and tribal levels. To underscore this problem, a primary public source of waste and recycling characteristics in the United States—EPA’s facts and figures webpage9—is 6 years out of date at the time of writing. Furthermore, some of these data are inconsistent with estimates reported by private entities, perhaps because of the lack of standardized definitions of various components of the recycling system.
EPA can play a pivotal role in filling these gaps by continuing and expanding its efforts to develop standardized definitions and measurement methodologies for collecting crucial data on recycling in partnership with key stakeholders. For one important example, a centralized EPA platform or dashboard could provide streamlined access to current information.
Consistent federal funding is necessary for adequate and reliable data collection, analysis, and reporting relevant to environmental, social, and economic dimensions. A structured framework would support the prioritized collection of such data, allowing stakeholders to address technical aspects and support data-driven policy development systematically.
Data collection requires cooperation of actors across all levels of product life cycles, from extraction of virgin materials to end-of-life disposal. It requires partnerships among governments at all levels, nongovernmental organizations, and industry.
Recommendation 2-2: The U.S. Environmental Protection Agency (EPA) should enhance data collection and reporting efforts related to municipal solid waste (MSW) and MSW recycling programs to fill significant data gaps, to ensure sufficient and contemporary data are available to inform policy decisions, and to aid in developing and evaluating recycling goals based on sustainable materials management. These efforts should include appropriate input from stakeholders including other federal partners; state, local, and tribal governments; and industry partners. Additionally, EPA’s efforts should include:
- Updating its publicly available website on at least a biennial basis with national-level facts and figures about materials, waste, and recycling. Where possible, this information should expand from input-output modeling figures to include direct observation data. Where necessary, EPA should continue to provide sufficient funding for collecting and reporting these data.
- Developing standard definitions of recycling and methodologies on data collection and reporting for recycling and MSW. These definitions and collection methodologies should distinguish between pre- and post-consumer recycling and differentiate between open- and closed-loop recycling. This public information should include, at a minimum, material-specific data on MSW generation, recycling, composting and other food and yard waste management, combustion with energy recovery, and landfilling. To the extent possible, these data should also be reported at regional, state, and local levels.
A summarized list of data needs and their uses is provided in Table 2-3. This list is not exhaustive but is representative of the need to improve data availability for decision making.
___________________
9See https://www.epa.gov/facts-and-figures-about-materials-waste-and-recycling.
TABLE 2-3 Summarized List of Data Needs and Their Uses
| Domain | Data/Units (where applicable) | Purpose and Use of Data | Primary Actors to Collect and Report Data |
|---|---|---|---|
| Product characteristics |
| Ensure that related policies (e.g., EPR/PRO, interventions, product bans) are working, support recyclable labeling, project future material flows | EPA, manufacturers, U.S. Census Bureau, Federal Reserve Board, Bureau of Labor Statistics |
| Waste generation and composition |
| Help advance the understanding of how the recycling system is performing, estimate level of contamination in recycling streams, complete LCA and LCI, evaluate recycling goals | EPA, states, local governments |
| MSW- recycling systems |
| Evaluate the availability of programs, recycling capacity, level of consumer access and participation, and fiscal stability | States, municipalities, local MRF owners |
| System costs |
| Estimate consumer cost of recycling more completely and accurately | Local government, compiled by each state |
| State policies and rules |
| Identify the objectives, economic impact, and constraints of government policy | EPA, state, nongovernmental, and industry experts on policy and regulation |
| Technological innovation | Descriptions and inventories of new MRF technologies, sorting technologies for consumers, and new patents | Understand how recycling performance could improve in the future | MSW research and development experts from industry |
| Environmental impacts and improvements | Input data for LCA and LCI; greenhouse gas emissions; air, water, land pollutants; from waste and recycled material transport and processing; exposures and health impact estimates (environmental, economic, and social metric units) | Ensure LCA and LCI are updated and accurate | EPA |
| Inventory of recyclable and recycled materials | Performance metrics, including fraction recycled (tons/day) and other impact-based indices | Improve markets and enable potential buyers and sellers of materials to be matched more easily | Local governments, MRF owners and operators, states |
| Consumer knowledge and behavior |
| Provide regular direct observations of household and commercial behavior; to improve the ability to evaluate the empirical impacts of public policies; measure social impacts of recycling, including health, distribution of programs; evaluate true cost and benefits of recycling | EPA - Surveys and bin audits measuring behavior and contamination; local governments |
| Domain | Data/Units (where applicable) | Purpose and Use of Data | Primary Actors to Collect and Report Data |
|---|---|---|---|
| Macroeconomic impacts |
| Survey recyclers to enable estimates of material flowrates, enabling estimations of material availability; evaluate recycling impacts on economy | States, manufacturers |
NOTES: Data needs not described in Chapter 2 are further described throughout this report. EPA = Environmental Protection Agency; EPR = extended producer responsibility; NAICS = North American Industry Classification System; LCA = life cycle assessment; LCI = life cycle inventory; MRF = materials recovery facility; MSW = municipal solid waste; PRO = producer responsibility organization.
Key Policy Option 2-1: The U.S. Environmental Protection Agency (EPA) could support studies to update or otherwise fill missing data gaps to ensure sufficient data are available to inform policy decisions on recycling. These studies could include:
- Tracking household time spent by single and multi-family households on recycling to support more complete and accurate estimates of the economic and social costs of recycling and ensure that life-cycle assessment models are as updated and accurate as possible.
- Regularly collecting and reporting direct observations of household and commercial behavior related to recycling. In addition to filling knowledge gaps, these data would complement top-down modeling in the recycling system and enable empirical study of the impact of public policy. As part of these efforts, EPA could consider a periodic household and commercial survey for waste and recycling akin to the Energy Information Administration’s Residential Energy Consumption Survey.
REFERENCES
Acuff, K., and D.T. Kaffine. 2013. Greenhouse gas emissions, waste and recycling policy. Journal of Environmental Economics and Management 65(1):74–86.
Allesch, A., and P.H. Brunner. 2015. Material flow analysis as a decision support tool for waste management: A literature review. Journal of Industrial Ecology 19(5):753–764.
Anshassi, M., and T.G. Townsend. 2023. The hidden economic and environmental costs of eliminating kerbside recycling. Nature Sustainability 6(8):919–928.
Anshassi, M., and T.G. Townsend. 2024. Residential recycling in Florida: A case study on costs, environmental impacts, and improvement strategies. Resources, Conservation and Recycling 206:107627
Arena, U., and F. Di Gregorio. 2014. A waste management planning based on substance flow analysis. Resources, Conservation and Recycling 85:54–66.
Awino, F.B., and S.E. Apitz. 2024. Solid waste management in the context of the waste hierarchy and circular economy frameworks: An international critical review. Integrated Environmental Assessment and Management 20(1):9–35. https://doi.org/10.1002/ieam.4774.
Baffoe-Bonnie, J., and F. Ezeala-Harrison. 2023. Analysis of optimal solid waste recycling policy: Evidence from US using panel data. Advances in Management and Applied Economics 13(3):1–2
Best, H., and T. Kneip. 2019. Assessing the casual effect of curbside collection on recycling behavior in a non-randomized experiment with self-reported outcome. Environmental and Resource Economics 72:1203–1223.
Bohm, R.A., D.H. Folz, T.C. Kinnaman, and M.J. Podolsky. 2010. The costs of municipal waste and recycling programs. Resources, Conservation and Recycling 54(11):864–871.
Bolingbroke, D., K.T.W. Ng, H.L. Vu, and A. Richter. 2021. Quantification of solid waste management system efficiency using input–output indices. Journal of Material Cycles and Waste Management 23:1015–1025.
Bradshaw, S.L., H.A. Aguirre-Villegas, S.E. Boxman, and C.H. Benson. 2025. Material recovery facilities (MRFs) in the United States: Operations, revenue, and the impact of scale. Waste Management 193:317–327.
Budds, D. 2022. It’s time to end our “rat nutrition” program. The case for containerized trash. Curbed. https://www.curbed.com/2022/09/new-york-city-waste-containerization.html.
Cecot, C., and W.K. Viscusi 2022. The hierarchy and performance of state recycling and deposit 6643 laws. Vermont Journal of Environmental Law 23(4):319–348.
Chioatto, E., M.A. Khan, and P. Sospiro. 2023. Sustainable solid waste management in the European Union: Four countries regional analysis. Sustainable Chemistry and Pharmacy 33:101037.
Dahlén, L., and A. Lagerkvist. 2009. Evaluation of recycling programmes in household waste collection systems. Waste Management & Research 28(7):577–586. https://doi.org/10.1177/0734242X09341193.
Devi, R., A.K. Singh, A. Kumar, R. Kumar, S. Rani, and R. Chandra. 2024. Development of technologies for municipal solid waste management: Current status, challenges, and future perspectives. In Integrated waste management: A sustainable approach from waste to wealth (pp. 37–62). Singapore: Springer Nature.
Dumlao-Tan, M.I., and A. Halog. 2017. Moving towards a circular economy in solid waste management: Concepts and practices. In S. Goel (ed.), Advances in solid and hazardous waste management. Springer. https://doi.org/10.1007/978-3-319-57076-1_2.
EPA (U.S. Environmental Protection Agency). 2020. Advancing sustainable materials management: 2018 fact sheet. Assessing trends in materials generation and management in the United States. https://www.epa.gov/sites/default/files/2021-01/documents/2018_ff_fact_sheet_dec_2020_fnl_508.pdf.
EPA. 2021a. An analysis of lithium-ion battery fires in waste management and recycling. https://www.epa.gov/system/files/documents/2021-08/lithium-ion-battery-report-update-7.01_508.pdf.
EPA. 2021b. National recycling strategy: Part one of a series on building a circular economy for all. https://www.epa.gov/system/files/documents/2021-11/final-national-recycling-strategy.pdf.
EPA. 2024. National overview: Facts and figures on materials, wastes and recycling. https://www.epa.gov/facts-and-figures-about-materials-waste-and-recycling/national-overview-facts-and-figures-materials.
EPA Environmental Financial Advisory Board. 2019. Revenue options for a waste backhaul service program in rural Alaska. https://www.epa.gov/sites/default/files/2019-12/documents/revenue_options_for_a_waste_backhaul_service_program_in_rural_alaska.pdf.
Eunomia Research and Consulting. 2021. Cutting lithium-ion battery fires in the waste industry. https://eunomia.eco/reports/cutting-lithium-ion-battery-fires-in-the-waste-industry.
Eunomia Research and Consulting. 2023. The 50 states of recycling: A state-by-state assessment of US packaging recycling rates. https://eunomia.eco/the-50-states-of-recycling-a-state-by-state-assessment-of-uspackaging-recycling-rates.
Fang, B., J. Yu, Z. Chen, et al. 2023. Artificial intelligence for waste management in smart cities: a review. Environmental Chemistry Letters 21:1959–1989. https://doi.org/10.1007/s10311-023-01604-3.
Firmansyah, F., I. Park, M. Corona, O. Aphale, A. Ahuja, M. Johnston, K.L. Thyberg, E. Hewitt, and D.J Tonjes. 2024. Variation in municipal solid waste generation and management across time and space. Resources, Conservation and Recycling 204:107472.
Fullerton, D., and T.C. Kinnaman. 1995. Garbage, recycling, and illicit burning or dumping. Journal of Environmental Economics and Management 29(1):78–91. https://doi.org/10.1006/jeem.1995.1032.
GAO (Government Accountability Office). 2020. Building on existing federal efforts could help address crosscutting challenges. https://www.gao.gov/assets/gao-21-87.pdf.
Goulart Coelho, L.M., L.C. Lange, and H.M. Coelho. 2017. Multi-criteria decision making to support waste management: A critical review of current practices and methods. Waste Management & Research: The Journal for a Sustainable Circular Economy 35(1):3–28.
Greene, K., and D.J. Tonjes. 2014. Quantitative assessments of municipal waste management systems: Using different indicators to compare and rank programs in New York State. Waste Management 34(4):825–836. https://doi.org/10.1016/j.wasman.2013.12.020.
Gutierrez-Lopez, J., R.G. McGarvey, C. Costello, and D.M. Hall. 2023. Decision support frameworks in solid waste management: A systematic review of multi-criteria decision-making with sustainability and social indicators. Sustainability 15(18):13316.
Hammond, J.S., R.L. Keeney, and H. Raiffa. 2015. Smart choices: A practical guide to making better decisions. Harvard Business Review Press.
Harder, R., Y. Kalmykova, G.M. Morrison, F. Feng, M. Mangold, and L. Dahlén. 2014. Quantification of goods purchases and waste generation at the level of individual households. Journal of Industrial Ecology 18(2):227–241.
He, R., and M.J. Small. 2022. Forecast of the US copper demand: A framework based on scenario analysis and stock dynamics. Environmental Science & Technology 56(4):2709–2717.
He, R., Sandoval-Reyes, M., Scott, I., Semeano, R., Ferrao, P., Matthews, S., and Small, M.J. 2022. Global knowledge base for municipal solid waste management: Framework development and application in waste generation prediction. Journal of Cleaner Production 377:134501.
Hu, J.L., Honma, S., and Chang, T.M. 2024. Recycling efficiencies in Japan’s administrative regions: Findings from network data envelopment analysis. Circular Economy and Sustainability 4(1):1–21.
Huber, J., W.K. Viscusi, and J. Bell. 2023. Using objective characteristics to target household recycling policies. Environmental Law Reporter 53:10804.
Iannuzzi, A. 2024. Greener products: The making and marketing of sustainable brands. CRC Press.
Jayasinghe, P.A., S. Derrible, and L. Kattan. 2023. Interdependencies between urban transport, water, and solid waste infrastructure systems. Infrastructures 8(4):76.
Jităreanu, A.F., G. Ignat, M. Mihăilă, and C.L. Costuleanu. 2023. Real-time feedback and education: The key to reducing contamination in home recycling waste. Environmental Engineering & Management Journal 22(6).
Kaverina, S. 2018. Sort It Out: TrashBot, a Smart Bin developed by CleanRobotics, uses AI to help improve waste management. Medium. https://medium.com/makersbootcamp/sort-it-out-a-smart-trash-bin-from-cleanrobotics-66a46bedff11.
Khan, A.H., E.A. López-Maldonado, N.A. Khan, L.J. Villarreal-Gómez, F.M. Munshi, A.H. Alsabhan, and K. Perveen. 2022. Current solid waste management strategies and energy recovery in developing countries-State of art review. Chemosphere 291:133088.
Liu, M., S. Grimes, K. Salonitis, and L. Litos. 2024. Modular model and simulation for process optimisation in advanced material recovery facilities (MRFs). Procedia CIRP 129:250–255.
Macauley, M.K., and M.A. Walls. 2010. Solid waste policy. In Public policies for environmental protection (pp. 261–286). Routledge.
Makarichi, L., K.A. Techato, and W. Jutidamrongphan. 2018. Material flow analysis as a support tool for multi-criteria analysis in solid waste management decision-making. Resources, Conservation and Recycling 139:351–365.
Meleddu, M., M. Vecco, and M. Mazzanti. 2024. The role of voluntary environmental policies towards achieving circularity. Ecological Economics 219:108134.
Mensah, D., N. Karimi, K.T.W. Ng, T.S. Mahmud, Y. Tang, and S. Igoniko. 2023. Ranking Canadian waste management system efficiencies using three waste performance indicators. Environmental Science and Pollution Research 30(17):51030–51041.
Morawski, C., and J. Wilcox. 2017. Is access everything? Resource Recycling. https://resource-recycling.com/recycling/2017/03/10/is-access-everything.
National Waste & Recycling Association. 2018. Material recovery facilities issue brief. https://wasterecy-cling.org/wp-content/uploads/2020/10/Issue_Brief_MRFS.pdf.
Nebraska Recycling Council. 2019. Hub and spoke recycling: Regional cooperation reduces costs, increases efficiency. https://nrcne.org/wp-content/uploads/2019/05/Nebraska_Hub-and-Spoke.pdf.
Nebraska Recycling Council. 2024. State of recycling in Nebraska. https://storymaps.arcgis.com/stories/2b3b3e1dd15d40daadabe023cb7d57f4.
Ng, K.S., and A. Yang. 2023. Development of a system model to predict flows and performance of regional waste management planning: A case study of England. Journal of Environmental Management 325:116585.
Noehammer, H.C., and P.H. Byer. 1997. Effect of design variables on participation in residential curbside recycling programs. Waste Management & Research 15(4):407–427.
Ogieriakhi, M.O., and X. Wang. 2024. Do mandatory environmental policies really work? A case study of California’s mandatory commercial recycling law. Economic Analysis and Policy 81:915–930.
Olafasakin, O., J. Ma, S.L. Bradshaw, H.A. Aguirre-Villegas, C. Benson, G.W. Huber, V.M. Zavala, and M. Mba-Wright. 2023. Techno-economic and life cycle assessment of standalone Single-Stream material recovery facilities in the United States. Waste Management 166:368–376.
Palmer, K., H. Sigman, and M. Walls. 1995. The cost of reducing municipal solid waste. Journal of Environmental Economics and Management 33(2):128–150.
Pinto, A.D., H. Jalloul, N. Nickdoost, F. Sanusi, J. Choi, and T. Abichou. 2022. Challenges and adaptive measures for U.S. municipal solid waste management systems during the COVID-19 pandemic. Sustainability 14(8):4834.
Prenovitz, E.C., P.K. Hazlett, and C.S. Reilly. 2023. Can markets improve recycling performance? A cross-country regression analysis and case studies. Sustainability 15(6):4785.
Psyrri, G., M.Z. Hauschild, T.F. Astrup, and A.T.M. Lima. 2024. Recycling for a sustainable future: Advancing resource efficiency through life cycle assessment resource indicators. Resources, Conservation and Recycling 209:107759. https://doi.org/10.1016/j.resconrec.2024.107759.
Salemdeeb, R., R. Saint, F. Pomponi, K. Pratt, and M. Lenaghan. 2022. Beyond recycling: An LCA-based decision-support tool to accelerate Scotland’s transition to a circular economy. Resources, Conservation & Recycling Advances 13:200069.
Schmidt, S., and D. Laner. 2023. Environmental waste utilization score to monitor the performance of waste management systems: A novel indicator applied to case studies in Germany. Resources, Conservation & Recycling Advances 18:200160.
Sharma, K.D., and S. Jain. 2020. Municipal solid waste generation, composition, and management: The global scenario. Social Responsibility Journal 16(6):917–948.
Šomplák, R., V. Smejkalová, M. Rosecký, L. Szásziová, V. Nevrlý, D. Hrabec, and M. Pavlas. 2023. Comprehensive review on waste generation modeling. Sustainability 15(4):3278.
Sondh, S., D.S. Upadhyay, S. Patel, and R.N. Patel. 2024. Strategic approach towards sustainability by promoting circular economy-based municipal solid waste management system-A review. Sustainable Chemistry and Pharmacy 37:101337.
Subramanyam, V., D. Paramshivan, A. Kumar, and Md. A.H. Mondal. 2015. Using Sankey diagrams to map energy flow from primary fuel to end use. Energy Conversion and Management 91:342–352. https://doi.org/10.1016/j.enconman.2014.12.024.
Taelman, S., D. Sanjuan-Delmás, D. Tonini, and J. Dewulf. 2020. An operational framework for sustainability assessment including local to global impacts: Focus on waste management systems. Resources, Conservation, and Recycling 162.
The Recycling Partnership. 2024. State of recycling: The present and future of residential recycling in the US. https://recyclingpartnership.org/wp-content/uploads/2024/01/Recycling-Partnership-State-of-Recycling-Report-1.9.23.pdf.
Tsai, F.M., T.D. Bui, M.L. Tseng, M.K. Lim, and J. Hu. 2020. Municipal solid waste management in a circular economy: A data-driven bibliometric analysis. Journal of Cleaner Production 275:124132.
Vines, V., M. Pasquali, S. Ganguli, and D.E. Meyer. 2023. Understanding the trade-offs of national municipal solid waste estimation methods for circular economy policy. Journal of Cleaner Production 412:137349.
Viscusi, W.K., J. Huber, and J. Bell. 2022. Quasi-experimental evidence on the impact of state recycling and deposit laws: Household recycling following interstate moves. American Law and Economics Review 24(2):614–658. https://doi.org/10.1093/aler/ahac006.
Wang, D., Y.T. Tang, Y. Sun, and J. He. 2022. Assessing the transition of municipal solid waste management by combining material flow analysis and life cycle assessment. Resources, Conservation and Recycling 177:105966.
Wang, Y., J.W. Levis, and M.A. Barlaz. 2021. Development of streamlined life-cycle assessment for the solid waste management system. Environmental Science & Technology 55(8):5475–5484.
Weiker, J. 2024. August 6. Rumpke opens what it calls the largest recycling center in North America on Joyce Avenue. The Columbus Dispatch. https://www.dispatch.com/story/news/environment/2024/08/06/new-rumpke-recycling-center-is-largest-in-north-america-company-says/74685159007/.
Wilson, D.C. 2023. Learning from the past to plan for the future: An historical review of the evolution of waste and resource management 1970–2020 and reflections on priorities 2020–2030—The perspective of an involved witness. Waste Management & Research 41(12):1754–1813.
Wilson, D.C., L. Rodic, M.J. Cowing, C.A. Velis, A.D. Whiteman, A. Scheinberg, R. Vilches, D. Masterson, J. Stretz, and B. Oelz. 2015. “Wasteaware” benchmark indicators for integrated sustainable waste management in cities. Waste Management 35:329–342.
Wise Guy Reports. 2024. Global arm type garbage truck market research report. https://www.wiseguyreports.com/reports/arm-type-garbage-truck-market.
Zhang, Q., X. Zhang, Z. Mu, R. Tian, X. Wang, and X. Liu. 2021. Recyclable waste recognition based on deep learning. Resources, Conservation and Recycling 171:105636.


