Municipal Solid Waste Recycling in the United States: Analysis of Current and Alternative Approaches (2025)
Chapter: 6 Behavioral Considerations and Social Impacts of Recycling Programs
6
Behavioral Considerations and Social Impacts of Recycling Programs
Summary of Key Messages
- Barriers to recycling: While consumer surveys consistently find high support among respondents for recycling and its programs, they also highlight barriers—mainly a lack of convenience and confusion over what materials can be recycled.
- Successful recycling programs: To be successful, residential recycling services must be convenient, easy to use, and low in cost to residents and business owners. These factors alone, however, are not always sufficient to increase recycling.
- Labeling: Inconsistent and misleading packaging labels, including the use of the chasing arrows symbol and resin identification codes, are significant causes of consumer uncertainty and misunderstanding.
- Predictors of recycling behavior: Studies indicate that the greatest predictors of recycling participation are residence type and income.
- Targeted interventions: Behavioral interventions for promoting recycling and decreasing contamination are most effective when they target a specific barrier to recycling for a given population of consumers.
- Policy support: Evidence suggests that consumers and voters would support policies that place greater responsibility for recycling onto product manufacturers.
- Research needs: More regular collection and reporting of direct observations of household and commercial behavior related to recycling are needed to support recycling policy decision-making. As one example, new and more rigorously collected data on household time costs are needed to perform recycling cost-benefit analyses more accurately.
This chapter explores the science and policies relevant to household attitudes and behaviors around recycling. It also explores the social impacts of recycling. Understanding how and why individuals engage in recycling practices is crucial for designing policies that effectively increase participation rates and improve recycling outcomes. Household recycling behavior is shaped by various factors, including the availability and accessibility of recycling programs, convenience, public awareness, and economic incentives. Additionally, the presence of social norms and community engagement can further influence participation in recycling efforts.
6.1 RESIDENTIAL PROGRAM AVAILABILITY
Household recycling behavior is influenced by a combination of structural and psychological factors, including program availability, ease of access, education, and personal motivation. While many residents express strong support for recycling, participation rates often lag behind access due to barriers such as unclear recycling guidelines, a lack of convenient options, and the perceived effort required. This section explores the availability of residential recycling programs, a contributing factor in household recycling decisions.
6.1.1 Availability of Residential Recycling Programs
As discussed in Chapter 2, U.S. residents can recycle their household materials in two ways (Sustainable Packaging Coalition, 2021):
- Curbside recycling collection at their home by public or private service providers, either automatically or on an opt-in basis or subscription basis.
- A publicly or privately operated drop-off recycling location within their municipality.
Alternatively, households can dispose of recyclable materials in general trash bins intended for the landfill or incinerator. Intermediate diverters (sometimes referred to as scavengers) may collect recyclable material from curbside recycling or trash containers and drop it off at recycling centers to receive payment for those materials. Scavengers’ role in diverting material from the waste stream to the recycling stream is important, because otherwise those materials would have ended up in landfills or incinerators. Finally, materials recovery facilities (MRFs) obtain recyclable materials from curbside haulers or drop-off centers (see Figure 6-1).
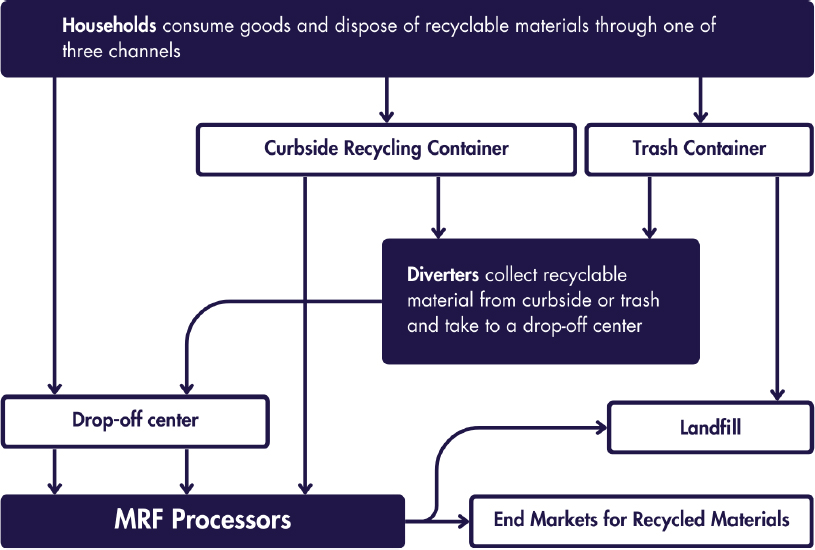
NOTE: MRF = materials recovery facility.
The availability of these residential recycling programs varies substantially across the United States, which becomes important to consider in the attitudes of individuals toward recycling, as discussed in the next section. A study by the Sustainable Packaging Coalition (2021) on the availability of recycling programs in 1,950 U.S. communities found that approximately 34 percent of the sampled population had only curbside collection available, 25 percent had both curbside programs and drop-off programs available, 32 percent had only drop-off programs available, and 9 percent had no recycling program available.1 Recycling program availability was found to be strongly correlated with housing type: only about 3 percent
___________________
1The Sustainable Packaging Coalition (2021) defines the availability of recycling as a resident having access to either one or more of consumer recycling services at their place of residence.
of respondents living in single-family homes reported no access to recycling programs, and nearly one in four respondents who live in multifamily housing reported no access to recycling programs (Sustainable Packaging Coalition, 2021).
Other organizations estimate lower rates of recycling access. For instance, The Recycling Partnership (2024) estimates recycling access to be only 73 percent across all households in the United States. However, this lower rate partly reflects the organization’s definition of access, which does not count access to deposit-return systems. Yet, similar to other studies, The Recycling Partnership (2024) also found differences by housing type, where access for single-family households is 85 percent and for multifamily households it is 37 percent. Additionally, while 73 percent of households have access, only 59 percent of those who have access participate in recycling (43 percent of all households participate) (The Recycling Partnership, 2024).
Availability of recycling also varies by type of product. While metal, paper, and plastics are commonly assumed to be recyclable, what can actually be recycled depends on the characteristics of products and not just their material. The Sustainable Packaging Coalition (2021) assessed the availability of residential recycling programs by product type. Products with the highest recycling availability included aluminum beverage cans (89 percent), corrugated boxes (88 percent), steel food cans (87 percent), polyethylene terephthalate (PET) bottles (87 percent), high-density polyethylene (HDPE) bottles (87 percent), and paperboard boxes (84 percent). Materials with the lowest recycling availability included aluminum foil and foil packaging (37 percent); rigid polystyrene packaging (45 percent); PET cups (52 percent); and PET clamshells, tubs, and trays (54 percent).
Figure 6-2 shows substantial heterogeneity in recycling participation by state, with participation rates lagging access rates in all states. The recycling participation rate is the percentage of all households that participate in recycling; analogous rates can be defined for composting, incineration, and landfill (The Recycling Partnership, 2024). The lowest recycling participation rates are 20 percent (Mississippi) and 21 percent (Louisiana); the highest are 62 percent (California) and 59 percent (Oregon), and the national average recycling participation rate is 43 percent (The Recycling Partnership, 2024). The fraction of municipal solid waste (MSW) that gets landfilled follows similar patterns to the recycling rate. For instance, the South-Central region has the highest landfilling rate, 83 percent, whereas the Northeast has the lowest landfilling rate, 47 percent (The Recycling Partnership, 2024).
Figure 6-3 depicts the fate of recyclable materials in the residential recycling process in number of tons. The materials are differentiated by the amount recycled, lost at the MRF, and lost to trash. On average, 21 percent (10 million tons) of residential recyclable materials are recycled, 3 percent are lost to processing at the MRF, and the remaining 76 percent of recyclable materials are thrown out by households as trash (The Recycling Partnership, 2024). However, as indicated by Figure 6-3, heterogeneity of recycling rates by material is considerable: the highest rates nationally are for cardboard (32 percent) and aluminum cans (30 percent), while the lowest rates are for film and flexible materials, bulky rigid plastics, and plastic types 3–7 (at or below 1 percent).
6.1.2 Availability of Residential Food Waste Programs
In the United States, the availability of residential food waste programs is much lower than the availability of recycling programs. A 2023 survey of cities, counties, and solid waste authorities estimated that 12 percent of U.S. households had access to residential food waste collection programs (BioCycle, 2023). However, the number of residential food waste programs has been growing over the past decade. A prior version of this survey found that less than 3 million U.S. households had access to residential food waste programs in 2013–2014; over the next 10 years, this number grew five times to roughly 15 million households (BioCycle, 2023; see Figure 6-4).
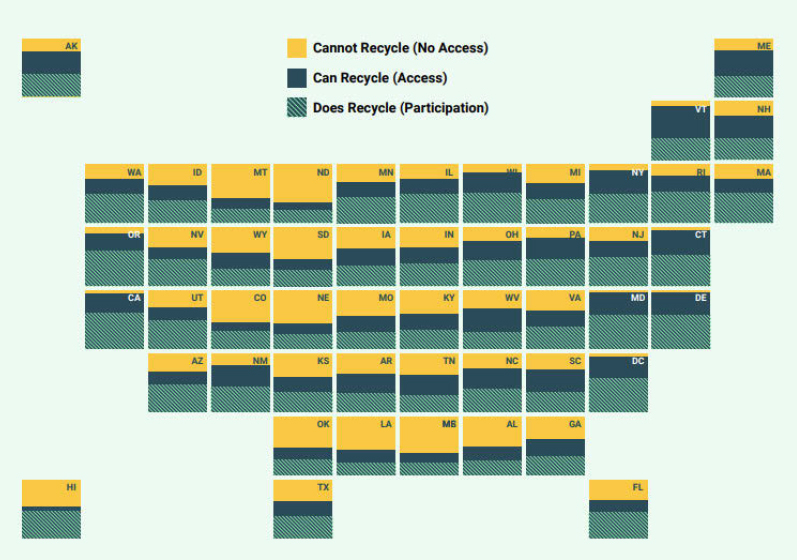
NOTES: Access data do not include access to a deposit-return system. Curbside recycling participation data were derived from a community survey. Participation data for drop-off systems and on-property multifamily recycling were unavailable and presumed rates of 30 percent and 50 percent were used, respectively. A subscription uptake rate of 30 percent was assumed, based on engagement with communities and data from previously published studies.
SOURCE: The Recycling Partnership, 2024.
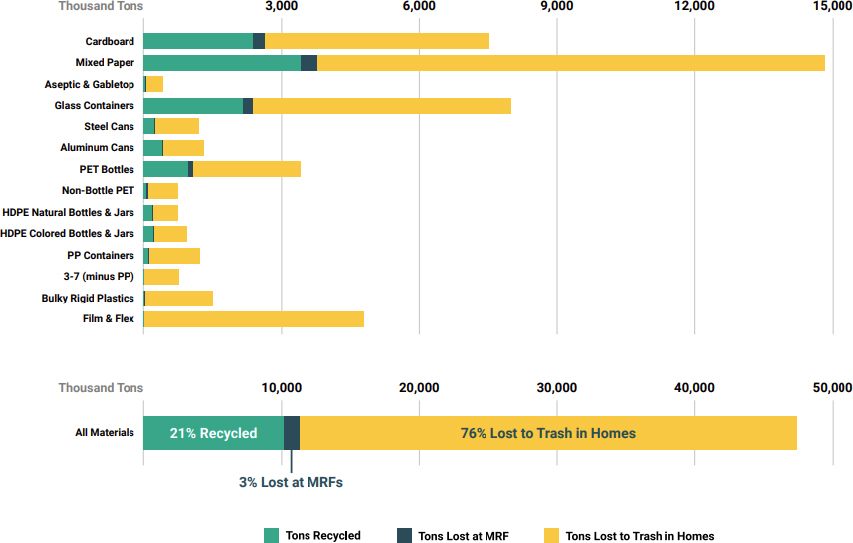
NOTE: HDPE = high-density polyethylene; MRF = materials recovery facility; PET = polyethylene terephthalate; PP = polypropylene.
SOURCE: The Recycling Partnership, 2024.
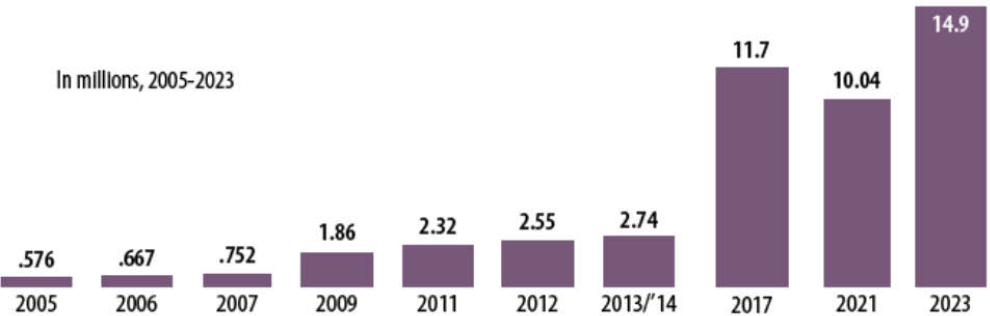
SOURCE: BioCycle, 2023.
Most residential food waste programs are provided via curbside collection. Of the 400 programs tracked in BioCycle (2023), 230 offered curbside only, 139 offered drop-off only, and 31 offered both curbside and drop-off (see Figure 6-5).
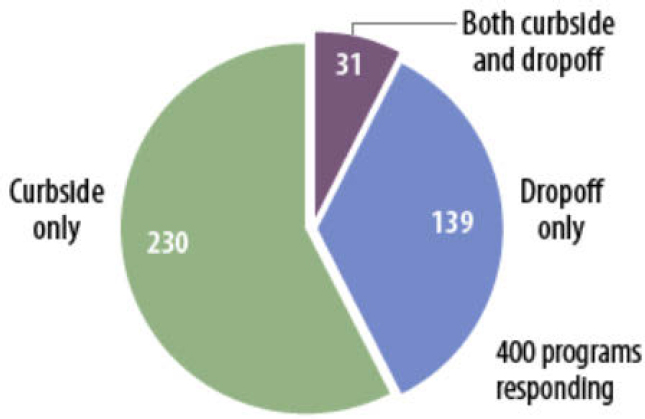
SOURCE: BioCycle, 2023.
BioCycle (2023) also describes the uneven spread of residential food waste programs across states. California has over 100 programs, and Illinois, New York, and Minnesota have over 40 programs each. However, 26 states have no residential food waste programs (see Figure 6-6).
6.2 ATTITUDES TOWARD AND BARRIERS TO RECYCLING
Much survey data and academic evidence have focused on recycling, and this section reviews those findings. However, less data and evidence are available on attitudes toward composting and anaerobic digestion options for residents to recycle organic waste (such as biomass, manure, leaf or yard waste, and food waste).

SOURCE: BioCycle, 2023.
6.2.1 Overview of Current Consumer Attitudes Toward Household Recycling
Polling companies, consulting firms, and nongovernmental organizations have conducted numerous representative consumer surveys to gauge individuals’ attitudes and beliefs toward recycling. These surveys consistently find high support among respondents for recycling and recycling programs. However, they also highlight barriers to recycling, such inconvenience and confusion over what materials can be recycled.
The World Economic Forum, SAP, and Qualtrics conducted a joint survey in 2021 that questioned people from different parts of the globe about their attitudes toward recycling, among other sustainability topics (World Economic Forum, 2021). This survey collected 11,686 responses across 28 countries. Globally, 84 percent of respondents reported that it is “extremely or very important for them to personally recycle when they can.” Across the eight regions surveyed, responses were relatively consistent, varying between 74 percent in East Asia and the Pacific and 93 percent in Latin America and Caribbean (World Economic Forum, 2021; see Figure 6-7). North America falls in the middle, at 80 percent. In North America, the top barriers respondents reported that kept them from recycling more were “lack of programs/services to enable recycling” (with 30 percent reporting this barrier) and “inconvenience of recycling” (with 28 percent reporting this barrier). Approximately 50 percent of respondents in North America also reported that they would be willing to avoid products that are hard to recycle (World Economic Forum, 2021).
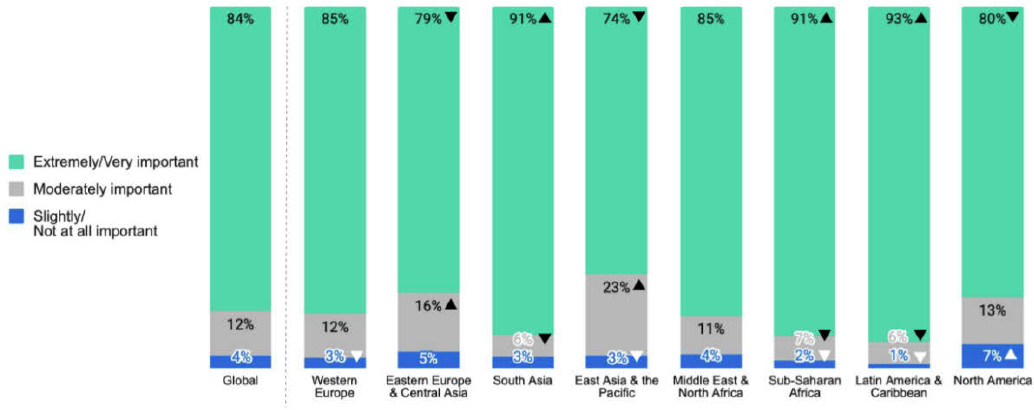
SOURCE: World Economic Forum, 2021. CC BY-NC-ND 4.0.
A 2014 survey conducted by Harris Poll on behalf of Recycled Materials Association surveyed 2,013 U.S. adults about their recycling attitudes and opinions; 68 percent of respondents reported that “recycling is the right thing to do” (Harris Poll, 2014). Reasons chosen for recycling included “it’s the socially responsible thing to do” (55 percent), it is critical to reduce landfill space” (54 percent), “it is critical to conserve natural resources” (49 percent), and “it’s critical to reduce energy consumption” (40 percent). This survey also found that the vast majority of respondents say they have recycled, with 43 percent saying they always recycle, 26 percent saying they often recycle, 24 percent saying they sometimes recycle, and only 6 percent saying they never recycle (Harris Poll, 2014).
6.2.2 Barriers to Household Recycling
While surveys reveal broad support for recycling in principle, they also highlight the difficulties people have with recycling in practice. A survey of 1,000 U.S. adults, conducted by Reputation Leaders (2023), found that 43 percent of respondents throw away most items instead of recycling them. Approximately one-third of all respondents reported that the biggest challenge is that they are not always sure which packaging can and cannot be recycled. For those reporting that they do not recycle, other barriers reported were inconvenience (22 percent), having to use a separate bin for recycling (20 percent), and not believing that recycling will make a difference or that the benefits of recycling do not outweigh the costs (17 percent) (Reputation Leaders, 2023). Reschovsky and Stone (1994) found that household storage space matters, with households much more likely to report that they recycle if they have adequate storage space, though this may be influenced by the availability of curbside recycling as opposed to use of drop-off centers.
In terms of confusion over which products are recyclable, according to a survey by McKinsey & Company (2020), two-thirds of respondents are not confident that they know which products are recyclable, and 17 percent find it difficult to know if something is recyclable. A separate survey conducted by Corona Insights (2020) on behalf of the World Wildlife Fund surveyed 1,098 adults using the nationally representative AmeriSpeak panel. This survey found that availability and uncertainty of what is accepted were the top reasons for not recycling more household plastic waste. About 14 percent of respondents reported no access to recycling, with nonmetro communities being more likely not to have access (Corona Insights, 2020; see Figure 6-8).
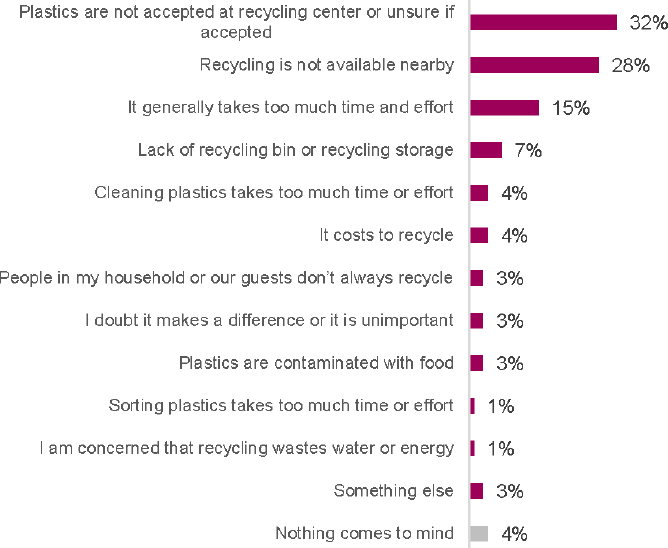
NOTES: Results are coded from open-ended responses.
SOURCE: Corona Insights, 2020.
Since one of the most common barriers to recycling reported by U.S. households is time costs, studies have estimated the time it takes for households to sort and dispose of their recycling. Jakus and colleagues (1996) used survey data (of self-reported times to recycle one unit of a material) to estimate an average of 36.38 (range: 3.67–102.4) seconds per unit to recycle newspaper and 53.75 (range: 6.64–154.1) seconds per unit to recycle glass at drop-off centers. For the weekly time requirement per household for the activities associated with preparing recyclables for curbside collection, the U.S. Environmental Protection Agency (EPA, 1974) calculated 15.9 minutes per week, while Schaumberg and Doyle (1994) assumed households take 5–15 minutes per week. For translating time costs for nonwork hours into dollar values, a common practice is to use half the U.S. average hourly wage (Small, 2013), which was $35.07 × 0.5 = $17.54 per hour in July 2024 (U.S. Bureau of Labor Statistics, 2024). Alternatively, the federal minimum wage of $7.25 per hour could be used to value time. Table 6-1 shows how the time costs of recycling would vary under different scenarios, based on household data from the U.S. Census Bureau (2024).
TABLE 6-1 Time Costs of Recycling Under Different Scenarios
| Household Time Spent Recycling | Household Time Cost, Using Federal Minimum Wage | Household Time Cost, Using Half Average Hourly Wage | Time Cost for All U.S. Households, Using Federal Minimum Wage | Time Cost for All U.S. Households, Using Half Average Hourly Wage |
|---|---|---|---|---|
| 5 minutes/week | $2.62/month | $6.33/month | $4.12 billion/year | $9.97 billion/year |
| 15 minutes/week | $7.85/month | $18.98/month | $12.37 billion/year | $29.91 billion/year |
NOTE: Total U.S. households was 131,332,360 according to the latest American Community Survey 1-year estimates by the U.S. Census Bureau (https://data.census.gov/profile/United_States?g=010XX00US).
SOURCE: U.S. Census Bureau, 2024.
However, the assumption that households spend 5–15 minutes per week on recycling may be an underestimate. An informal poll conducted online by Earth911 (2018) found that 27 percent of respondents spend 10–30 minutes on recycling, 25 percent spend 30 minutes to 1 hour, and 25 percent spend more than 1 hour, suggesting the values reported in Table 6-1 are lower than current time costs. New and more rigorously collected data on household time and costs are needed, both on average and by household characteristics.
Some surveys on recycling have focused on product labels. A June 2021 survey of 1,300 U.S. consumers conducted by The Recycling Partnership (2023) asked consumers about their use of and attitudes toward recycling information on products and product labels. Consumers were found to rely heavily on product recycling labels, with 78 percent of consumers reporting that they look at recycling information on products to try to sort them correctly. Approximately 82 percent of consumers trust the recycling information found on products to be accurate, and 71 percent feel deceived and discouraged when a product claims to be recyclable when it is not. Among consumers that look at product recycling labels, 63 percent report still being confused about whether an item is recyclable (The Recycling Partnership, 2023).
Surveys have also asked respondents what actions they would be willing to take to improve recycling rates and what government policies they would support. The 2014 Harris Poll survey on behalf of Recycled Materials Association found that respondents, on average, would be willing to spend 13 percent more for a product if they knew it was easy and convenient to recycle (either via curbside collection or drop-off center), and 55 percent said they would be willing to spend more for a product if they knew it was made of recycled materials (Harris Poll, 2014). Among the respondents, 90 percent agreed that “recycling collection sites need to be more readily accessible to consumers.” And 68 percent of respondents agreed that “manufacturers and/or retailers should pay for recycling programs when they are not already available to consumers” (Harris Poll, 2014).
Other studies have found that, in the absence of information on environmental impact, consumers are willing to pay less for products made of recycled and remanufactured material compared with products made of new material, because they believe that recycled materials are lower in quality (Michaud and Llerena, 2011; Pretner et al., 2021). Once informed of the environmental benefits, consumers no longer have a lower willingness to pay for products made of recycled materials.
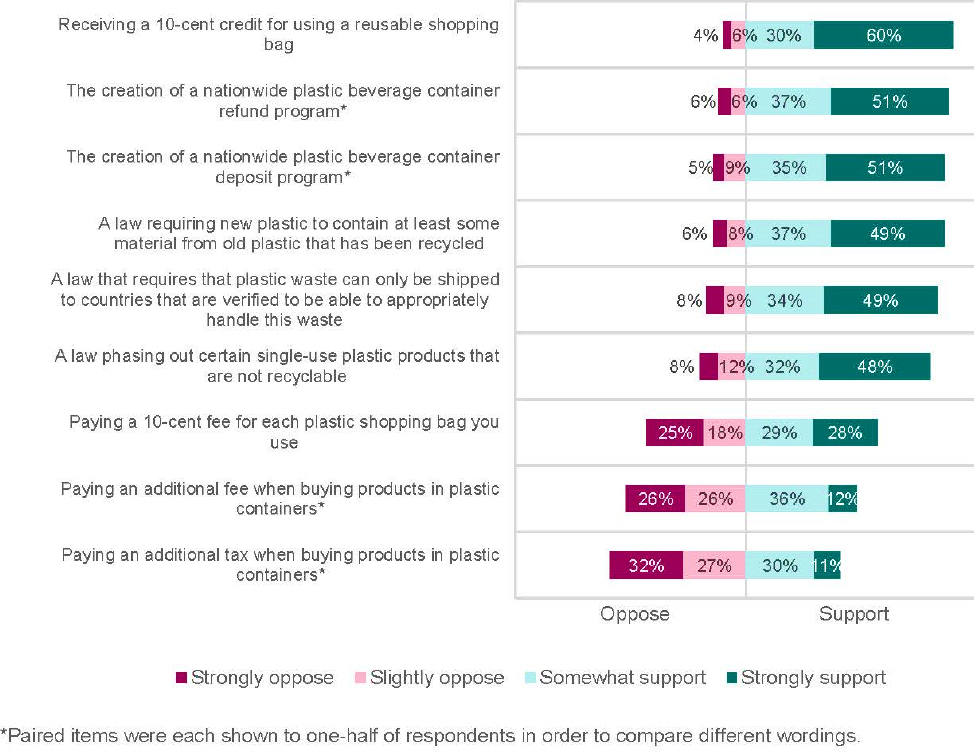
Similarly, a Corona Insights (2020) survey found that 88 percent of respondents agreed that “the recycling system for plastic in the United States needs improvement.” Most respondents (67 percent) believed that individuals that use plastic, businesses that produce/sell plastic, and government share responsibility for reducing plastic waste. However, when asked to rank these groups’ responsibility, businesses were ranked as the most responsible (Corona Insights, 2020). The survey also revealed that respondents slightly preferred subsidies for reusing and recycling items over banning nonrecyclable items. Taxes and fees for using nonrecyclable plastics were preferred the least (Corona Insights, 2020; see Figure 6-9).
6.2.3 Heterogeneity in Consumer Attitudes and Barriers
Consumer surveys reveal diverse beliefs, barriers, and behaviors around recycling at the household and individual levels. Researchers have examined how these beliefs vary across sociodemographic, geographic, and psychographic characteristics.
With respect to sociodemographic characteristics, Huber and colleagues (2023) analyzed annual survey data from 2005 to 2014 for 145,000 participants in the Knowledge Networks-GfK Knowledge Panel. The authors found that the individual characteristic that is most predictive of recycling support is educational attainment—individuals with college degrees are more likely to recycle than those with no college degree. Huber and colleagues (2023) also find that recycling rates grow with age and are higher among individuals who are White, who vote Democrat, and who are women. In terms of household characteristics, the authors found that the most important household characteristic is home type, with households living in a single-family house having higher recycling rates than those living in other types of dwellings. Recycling also increases with household income (Huber et al., 2023). To a smaller degree, higher recycling rates are associated with owning a home, being married, and not having children under the age of 6 years. These
findings have implications for targeted recycling programs and support (e.g., in counties with lower household incomes). Huber and colleagues’ (2023) findings are supported by other studies, as compiled by Shaw and colleagues (2014):
Individual characteristics that increase likelihood of recycling:
- Women (Ando and Gosselin, 2005; Barr, 2007; Harris Poll, 2014; Oates and McDonald, 2006)
- Older adults (Barr, 2007; Harris Poll, 2014; Jenkins et al., 2003; Nixon and Saphores, 2009; Sidique et al., 2010)
- Larger households (e.g., Ando and Gosselin, 2005; Nixon and Saphores, 2009)
- Higher education (Owens et al., 2000; Sidique et al., 2010)
- White (Johnson et al., 2004)
Individual characteristics that decrease likelihood of recycling:
- African Americans (Johnson et al., 2004; Nixon and Saphores, 2009)
- Foreign-born Latinos (Johnson et al., 2004)
- Renters (Nixon and Saphores, 2009; Owens et al., 2000)
SOURCE: Corona Insights, 2020.
With respect to geographic characteristics, recycling participation is higher in Pacific Coast and Northeast states than in the South and Midwest states (see Figure 6-2). Recycling rates also vary by county- and state-level characteristics. Recycling rates increase with a county’s median income, population, percent White, and population density (Huber et al., 2023). At the state level, recycling rates increase with tipping fees per ton, the presence of container deposit-return and mandatory recycling laws, and state spending per person (Huber et al., 2023).
With respect to psychographics, The Recycling Partnership (2022) conducted a qualitative research study—with in-depth interviews of 24 participants and an online survey of 2,506 adult participants—to identify distinct types of recyclers or audience segments. They identified five types of recyclers based on their attitudes and beliefs and the barriers they face with recycling (see Table 6-2).
TABLE 6-2 Five Types of Recyclers
| Type of Recycler | Percentage | Description |
|---|---|---|
| Eco activators | 25% | “They care about the environment, research and share how to recycle with others, and have overcome inconveniences to do so. They are hopeful and take pride in their local program but ideally, they want greater systemwide investment, and clear information. They are social and civic minded and encourage others to be as well.” |
| Committed followers | 24% | “This straight-forward group feels good about doing their duty for their community, especially since it helps reduce waste and is easy for them to do. They are confident they know exactly what to do and feel they need little additional support but would benefit from reassurance. They are civic minded but private.” |
| Discouraged self-doubters | 18% | “They’re not confident in their knowledge of recycling and feel negatively toward it, possibly due to key obstacles like confusion about what and how to recycle, which may be helped with frequent reminders. They lack confidence, clarity, and an understanding of why recycling matters.” |
| Detached abiders | 16% | “They recycle because it’s convenient and, in many cases, because it is required or feels like it is. They’re not confident in what to do and their obstacles lead to negativity. It is as if they are keeping score. They want to know how recycling benefits them and their community and don’t want to make an extra effort.” |
| Conflicted and overwhelmed | 16% | “This diverse segment agrees that recycling has some benefits, but they experience many obstacles. In the context of their busy life, recycling feels important conceptually, but the practical steps required to do it fall short of being worthwhile. This conflict leaves them frustrated and worried. They feel judged whether they do or don’t recycle. They need more information and support on specific ‘to-dos’ from their municipality. It needs to be easier, and they need to see others doing it as well.” |
SOURCE: The Recycling Partnership, 2022.
Geiger and colleagues (2019) performed a meta-analysis of 91 studies on individual and household recycling and classified the most robust predictors of recycling across studies. The authors found that behavior-specific factors (e.g., past recycling behaviors and personal norms toward recycling) were better predictors of recycling than general factors (such as general knowledge about environmental concerns and general environmental attitudes) (Geiger et al., 2019):
Factors predictive of recycling behavior:
- past recycling behaviors—whether a person has recycled in the past
- personal norms toward recycling—feelings of moral obligation to engage in recycling
- perceived behavioral control over recycling—degree to which an individual perceives themself as being able to engage in a certain behavior
- recycling self-identity—degree to which a person sees themself as a person who recycles their waste
- descriptive norms to engage in recycling—extent to which people think other people recycle their waste
- attitudes toward recycling—extent to which people evaluate recycling favorably
Factors less predictive of recycling behavior:
- general knowledge about environmental problems—extent to which people know about the causes and consequences of environmental problems, or know which behaviors cause such problems
- general environmental attitudes—extent to which an individual is concerned about the environment in general
- general personal norm—feelings of moral obligation to engage in pro-environmental behavior generally
Geiger and colleagues (2019) also considered contextual factors such as home ownership, housing type, number of recycling facilities in the neighborhood, possession of a recycling bin at home, distance to a drop-off recycling location, and the size of the neighborhood. The authors found that possessing a recycling bin at home was a strong predictor of recycling.
Similarly, in an earlier meta-analysis of 63 studies, Miafodzyeva and Brandt (2013) found that personal norms toward recycling (i.e., moral concern), convenience (i.e., how easy it is to understand and use a recycling program), and information (i.e., an individual’s specific recycling knowledge) are strong predictors of recycling.
Jacobsen and colleagues (2022) conducted a systematic review of empirical research published between 2015 and 2020 on plastic packaging waste recycling. They classified drivers and barriers to recycling as (1) consumer motivation, (2) consumer ability, and (3) consumer opportunity. Jacobsen and colleagues (2022) summarized their systematic review as follows:
Overall, research suggests that consumers’ PPW [plastic packaging waste] recycling is driven by their environmental concern and that environmentally related messages can increase their motivation to recycle. Research on consumers’ ability to recycle mainly uncovered a negative impact of insufficient consumer knowledge on how to source-separate correctly and also found that recycling can be increased through better communication. The research on consumers’ opportunity to recycle find that the design of the waste sorting system and its built-in convenience (in terms of time and effort to recycle) are strong determinants of consumers’ PPW recycling. (p. 73)
Multiple studies in this systematic review found that differences in the waste collection system account for a substantial portion of differences in recycling rates across municipalities: recycling rates are higher with curbside collection than drop-off centers (Hage et al., 2018; Hahladakis et al., 2018; van Velzen et al., 2019), and recycling rates are higher with greater density of drop-off centers (Hage et al., 2018; Oliveira et al., 2018).
6.2.4 Attitudes of Local Government About Recycling
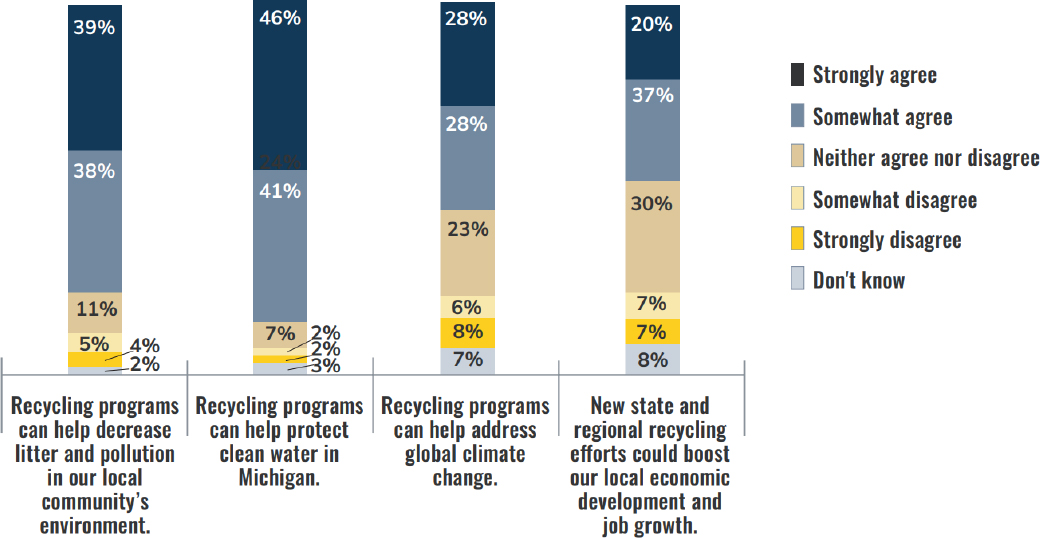
Fewer academic studies and opinion surveys have been conducted on the attitudes and beliefs of local government leaders about recycling. However, a handful of examples do exist, such as the Michigan
Public Policy Survey conducted by the Center for Local, State, and Urban Policy (Horner et al., 2022a,b, 2023). In Michigan, 86 percent of local leaders report that recycling is somewhat or very important to their community. Additionally, 67 percent of local leaders from jurisdictions with at least some recycling services are satisfied with the current recycling opportunities available, while only 24 percent of local leaders from communities with no access to recycling services are satisfied with their lack of services. Local leaders were more likely to say their community would choose lower taxes and fewer recycling services instead of higher taxes and more services, but many such leaders expressed uncertainty (Horner et al., 2022a,b, 2023; see Figure 6-10).
SOURCE: Horner et al., 2023.
6.2.5 Willingness to Pay for Recycling Programs
People may have different views regarding the benefits of a proposed program and its anticipated outcomes. In order to assess consumers’ valuation of recycling programs, several studies estimate willingness to pay, or the maximum price a consumer is willing to pay for a product or service. Willingness to pay estimates, and their variations across groups, can inform decisions about what policies or projects to implement. Estimates of average household willingness to pay for recycling services vary from $1.47 to $28.35 per month (in 2017 USD; see Table 6-3).
The methodologies applied to generate the results in Table 6-3 have been used for many years by scientists, economists, and planners to inform decisions about public perspectives on the benefits and costs of the decision. These methodologies are often used to place a value on public goods, services, or programs for which market transactions are not available, and for which social preferences are expressed indirectly through political decisions. Examples include a proposed program’s associated taxes, budgets, regulations, approvals, and mandates.
The methodologies chosen can result in nuanced results. For example, the Jakus et al. (1996) and Tiller et al. (1997) willingness to pay studies examined drop-off centers in Williamson County, Tennessee. This rural area has households dispersed across wide distances, making curbside recycling pick-up services prohibitively costly and unavailable. Similarly, garbage collection services are limited for some residents.
As a result, many households rely on “convenience centers” for both garbage disposal and recycling. Jakus and colleagues (1996) employed a two-stage model to estimate recycling demand while accounting for selection bias. They found an average willingness to pay of approximately $10.10 for drop-off recycling services. In contrast, Tiller et al. (1997) used a contingent valuation method (CVM) to assess consumers’ hypothetical willingness to pay for additional drop-off centers. Their findings revealed an average willingness to pay ranging from $7.08 for nonrecyclers without curbside trash collection to $20.51 for recyclers with access to curbside trash pick-up.
TABLE 6-3 Literature on Willingness-to Pay Estimates
| Authors | Year | Program Type | 2017 USD/Month | N | Setting | Method |
|---|---|---|---|---|---|---|
| Jakus et al. | 1996 | drop-off | $10.00 | 284 | Williamson County, TN | revealed preference, stated/observed behavior |
| Lake et al. | 1996 | curbside | $7.61 | 285 | Hethersett, South Norfolk, UK | CVM-dichotomous choice |
| Tiller et al. | 1997 | drop-off | $7.08–$20.51 | 481 | Williamson County, TN | CVM-dichotomous choice with follow-up |
| Aadland and Caplan | 1999 | curbside | $3.13 | 401 | Ogden, UT | CVM-ordered interval choice |
| Kinnaman | 2000 | curbside | $12.04 | 100 | Lewisburg, PA | CVM- dichotomous choice |
| Caplan et al. | 2002 | curbside an green waste pick-up | d $9.17–$13.75 | 350 | Ogden City, UT | CVM-contingent ranking |
| Aadland and Caplan | 2003 | curbside | $8.30–$9.69 | 1,000 | Utah | CVM-double-bounded dic. choice and revealed pref. stated behavior |
| Blaine et al. | 2005 | curbside | $1.47–$3.20 | 2,000 | Lake County, OH | CVM-single-bounded referendum and CVM-payment card |
| Aadland and Caplan | 2006 | curbside | $4.05–$7.64 | 4,000 | 40 Western U.S. cities | CVM-double-bounded dic. choice and revealed pref. stated behavior |
| Jamelske and Kipperberg | 2006 | upgrade to automatic/single strea | $4.11–$4.13 m | 301 | Madison, WI | CVM-double-bounded dic. choice |
| Bohara et al. | 2007 | curbside | $7.47 | 400 | Logan, UT | CVM-single-bounded dic. choice |
| Karousakis and Birol | 2008 | curbside | $5.82/material | 188 | London, UK | Stated preference choice experiment |
| Troske et al. | 2009 | curbside | $2.71 | 600 | Lexington, KY | CVM-dichotomous choice |
| Gillespie and Bennett | 2013 | curbside (fortnight collection) | $11.33 | 600 | Brisbane, AU | Stated preference choice modeling |
| Berck et al. | 2017 | drop-off | $28.35 | 1,005 | California | Stated preference choice modeling |
NOTE: CVM = contingent valuation method.
The use of CVM to calculate survey estimates of willingness to pay has generated controversy regarding theoretical issues of (a) how to represent the options and how project attributes can be substitutes for other commodities, (b) methodological issues of replication validity, (c) evidence that willingness-to-pay estimates are highly influenced by the options and scales used in the valuation questions, and (d) ethical issues regarding informed consent for subjects as to how their responses may or may not be used to support decisions. Examples of these concerns, along with counterarguments favoring the use of well-designed and well-implemented willingness-to-pay studies, are presented in Box 6-1. Many argue that CVM and willingness-to-pay surveys—when conducted with clear and simple options, replication, and pretesting of option descriptions—are the most effective way to gather estimates of economic benefits applicable across a broad sample of a population. As a result, government agencies often use these methods to develop and evaluate their management options.
BOX 6-1
Opposition and Support for Contingent Valuation and Willingness to Pay
The following arguments are findings and conclusions from various studies with arguments for or against contingency valuation methods and willingness to pay.
ARGUMENTS IN OPPOSITION
Willingness to pay fails to capture the complex interaction among economic and ethical attributes:
Among [contingent valuation studies] is evidence that modified lexicographic preferences, where the substitutability of environmental quality with other commodities is rejected, can be common. Human value formation with respect to the environment combines ethical and economic aspects in a more complex way than most economists have assumed. (Spash, 2000, p. 1433)
Lack of quality control, reporting standards, and validity tests:
The currently dominant survey protocols and practices are inadequate. This is most evident from robust findings that the valuations are heavily influenced by the response options or response scales used in the valuation questions. The widely accepted survey guidelines do not require the validity tests and reporting standards that would be needed to make the uncertainty of the results transparent. The increasing use of inadequate survey results by policymakers threatens to undermine trust in environmental valuation, environmental policies, and political institutions. (Schläpfer, 2021, p. 1)
Lack of informed consent by subjects regarding use of study results:
Agreeing to participate in a study eliciting environmental values means agreeing to abide by the commitment implied by any proposal that one accepts or rejects in it. That might mean anything from addressing the gist of an issue to expressing an explicit willingness to pay for an environmental change. By soliciting such participation, investigators promise to provide the information that participants need in order to evaluate the proposals being presented. This paper proposes a standard for providing such information that must be met in order to conduct valid and ethical value-elicitation studies. Namely, investigators must secure the informed consent of participants. (Fischhoff, 2000, p. 1439)
ARGUMENTS IN SUPPORT
Contingent valuation estimates are methodologically sound and fit for purpose:
Such surveys are a practical alternative approach for eliciting the value of public goods, including those with passive use considerations. . . . Although discussions of contingent valuation often focus on whether the method is sufficiently reliable for use in assessing natural resource damages in lawsuits, it is important to remember that most estimates from contingent valuation studies are used in benefit–cost assessments. I put forward an affirmative case for contingent valuation and address a number of the concerns that have arisen. (Carson, 2012, pp. 28–29)
The method has undergone high-level review and approval, and is often used:
The CVM [contingent valuation method] was debated in a symposium sponsored by the Exxon Corporation, which led to the creation of a government panel– established by the National Oceanic and Atmospheric Administration (NOAA) and chaired by two Nobel laureates in economics – to assess the scientific validity of the CVM. The NOAA panel offered its approval of CVM subject to a set of best-practice guidelines that influenced the development of the methodology. Nowadays, the CVM is a method widely used in academic research and in environmental valuation studies. (Ferreira and Marques, 2015, p. 112)
The contingent valuation method is acceptable, but research is needed on ethics, protest behavior, reliability, and construct validity:
The contingent valuation method (CV) has become a recognised tool for estimating monetary non-market values. Despite the pragmatic acceptance of CV in policy evaluation, the application of CV-based estimates in decision-making remains controversial, as critics argue that CV suffers of hypothetical bias and question its accuracy to reflect non-market values via willingness to pay (WTP) estimates. . . . Our findings suggest that WTP estimates are suitable to infer the economic value of environmental assets . . . capable of eliciting rational behaviour from individuals that is free of hypothetical bias. However, hypothetical bias might be lurking in a less researched area, that of market participation, which calls for a rigorous treatment of protest behaviour. (Perni et al., 2021, p. 1)
6.2.6 Approaches for Comparing Willingness to Pay and Recycling Costs
The analysis in this report is limited to a direct comparison of the range of costs and willingness-to-pay values reported in the literature for curbside programs.2 As shown in Table 6-3, for the 11 curbside studies reviewed (spanning locations in the United States, the United Kingdom, and Australia), the estimated values of willingness to pay ranged from $1.47 to $28.35 per month per household (in 2017 USD). In comparison, our review of curbside cost estimates in Chapter 4 found costs in North Carolina municipalities ranging from $2.79 per month to $3.75 per month per household (in 2021 USD). These cost estimates overlap the range of reported willingness to pay in Table 6-3. Similarly, the average U.S. household time costs estimated in Table 6-1, ranging from $2.62/month to $18.90/month (in 2024 USD), are within the range of willingness-to-pay values. This comparison provides moderate (though not definitive) evidence that the elicited benefits in these cases generally exceed reported costs, though perhaps not by much. This finding for curbside recycling is similar to that of Aadland and Caplan (2006) who studied 40 western U.S. cities and found that the average unit cost and the average willingness to pay were nearly identical, though with a high degree of variability around each mean.
6.3 STRATEGIES FOR PROMOTING BEHAVIOR CHANGES
Municipalities and researchers have applied various psychological intervention strategies for promoting household recycling. In a meta-analysis of randomized field studies, Varotto and Spagnolli (2017) grouped 70 interventions into six types, based on previous work by Osbaldiston and Schott (2012, p. 272):
- Prompts and information: providing information on recycling (factual, persuasive, or merely reminders) to targeted individuals to encourage recycling behavior. Information can be delivered face-to-face, though written information (in print or online) is more common as it can reach a considerable number of people with low effort and costs.
___________________
2The willingness-to-pay estimates capture the maximum price an individual is willing to pay for a certain recycling feature, the perceived benefits, and willingness to pay. It does not include external benefits.
- Feedback: providing either individuals or groups with information regarding their recycling behavior along with a comparison to a predefined standard, to show the difference between the standard and their current recycling behavior.
- Commitment: asking individuals to commit to produce a certain behavior or reach a certain goal.
- Incentives: any kind of benefit received by consumers as a result of their participation in a recycling program (e.g., monetary rewards, refund and unit pricing programs, gifts, prizes, lottery tickets, discount coupons).
- Environmental alterations: making recycling more convenient and easier to perform by modifying the physical environment, for instance by increasing bin proximity or number, changing bin appearance, or providing home equipment for sorting waste.
- Social modeling: any kind of passing of information via demonstration or discussion in which the initiators indicate that they personally engage in the behavior.
Varotto and Spagnolli (2017) found that all six types of interventions increased recycling behavior on average, but the magnitude of the behavioral change varied substantially across interventions. Social modeling was by far the most effective intervention technique, followed by environmental alterations; the remaining groups were about equally effective.
Social Modeling
The assumption behind social modeling is that people learn through observation of the behavior of their peers. The field studies that examined social modeling recruited community members who already participated in a recycling program to act as block leaders. These block leaders were then tasked with modeling proper recycling behaviors and informing and convincing their nonrecycling neighbors to also participate in recycling. Varotto and Spagnolli (2017) pull from Burn (1991) to posit that social modeling techniques are effective because they (1) communicate to individuals that their neighbors are recycling, engendering a social recycling norm, and (2) may lead individuals to perform the behavior out of a desire for social approval. While social modeling has low costs compared with other techniques, its effectiveness depends on the extent to which block leaders are present and willing to participate, and the extent to which residents see themselves as part of the community.
Environmental Alterations
The second most effective strategy was environmental alterations. Varotto and Spagnolli (2017) suggest that the effectiveness of environmental alterations may be due to the reduced amount of effort required to recycle and thus the perceived costs of recycling. However, no single bin size and collection frequency suits all households, and households report wanting to choose their bin sizes depending on their waste habits and home storage space (Willman, 2015).
Prompts and Information
Prompts and information are the most commonly tried interventions because of the relative ease and low-cost nature of disseminating written information via fliers, brochures, and websites that advocate recycling and explain how, why, and when to carry it out. When lack of information is the main barrier to household recycling (i.e., households are motivated to recycle but do not know how to recycle), then simple dissemination of information can lead to changes in recycling behavior (McKenzie-Mohr, 2011). This situation often occurs at the start of a new recycling program or when the existing program changes or is particularly complex (NRC, 2002). However, lack of information may not be the main barrier to recycling (e.g., the program may be difficult to use). In that case, households can choose not to read the information
provided, and information interventions may not lead to behavioral change. The type of information provided also matters. Beyond informing households how to recycle and what can be recycled, some initiatives provide information on the broader benefits of recycling. While some studies found no additional effects of highlighting the benefits of recycling (Klaiman et al., 2017), other studies found positive effects of this information (Winterich et al., 2019). Together, these studies suggest that providing information may not always increase recycling rates, but at least it does not seem to reduce recycling rates, nor is it particularly costly to implement.
In the domain of food waste, Schäufele-Elbers and colleagues (2024) found that guests at a European hotel who were made aware of the food waste problem were responsive to information nudges on the topic. Messages were posted at the buffet providing arguments for reducing personal food waste, such as “Use instead of waste—Reduce food waste for a sustainable future,” and “1/3 of all food never reaches the human stomach. You can help reduce this by wasting less.” Guests reduced their average rate of food waste generation significantly during the study period (Schäufele-Elbers et al., 2024).
Incentives
Several monetary incentives aimed at encouraging recycling have been used in the United States, as surveyed in Kinnaman and Fullerton (2000) and Kinnaman (2000). Chapter 3 describes the use of corrective (“Pigovian”) taxes as a market-based instrument for promoting recycling behavior, essentially imposing a fine when recycling behavior is not correct.
Another monetary incentive is a deposit-return system, which requires consumers to pay a small deposit for each eligible beverage container at the time of purchase; consumers can get the deposit back as a refund when the container is properly returned to a drop-off recycling center. The idea behind this model is that the potential for a financial return will encourage recycling. See Box 3-3 in Chapter 3 for more information on incentives via deposit-return systems and Chapter 4 for deposit-return system policies and examples of their implementation.
While many of the policies mentioned above and discussed in previous chapters are market based, a few additional policies are available that center on household-level behaviors. These include pay-as-you-throw policies and fines for illicit dumping and burning. The idea with these methods is to make garbage collection relatively more expensive than recycling appropriately.
Pay-as-You-Throw Policies
Most U.S. households pay for garbage collection through annual property taxes or a fixed monthly fee. Thus, they do not pay for each additional bag of garbage they add to their weekly collection. However, some municipalities have pay-as-you-throw systems, where households pay for the amount of waste they produce by volume, weight, number of bags (using specially labeled bags or stickers), or frequency of collection (Gradus et al., 2019). Empirical studies of pay-as-you-throw programs have found that they are associated with decreases in household disposal of MSW and increases in recycling, such as in Virginia (Fullerton and Kinnaman, 1996), Minnesota (Sidique et al., 2010), Massachusetts (Starr and Nicolson, 2015), Italy (Bucciol et al., 2015), the Netherlands (Dijkgraaf and Gradus, 2017), and South Korea (Lee, 2023).
Fines for Illicit Burning and Dumping
However, charging a price per bag of garbage may unintentionally provide incentives for illicit burning and dumping (Fullerton and Kinnaman, 1995). It may also increase the amount of “wish-cycling,” when households use their recycling bin for waste that is not recyclable, in order to avoid paying the price for landfill waste. This behavior in turn increases contamination in the recycling stream, making it more expensive for MRFs to sort. Thus, another policy option is using fines to punish illicit dumping and burning and improper recycling sorting. In a randomized field experiment, Vollaard and van Soest (2024) found
that informing households about fines for not separating their recycling led to more than a 10 percent reduction in residual waste.
However, any such fine would require monitoring, enforcement, and administration. If these behaviors cannot be easily monitored or controlled, then a household subsidy for recycling might provide more effective incentives for recycling. While subsidies are popular with consumers, as discussed above, governments must find a way to raise funds to pay the subsidy, which often entails using other taxes, which could have their own social costs. Additionally, subsidies may raise the amount of wish-cycling (to gain the subsidy even for nonrecyclable materials). For these reasons, deposit-return programs, discussed at length in Chapter 4, have been shown to be preferable to pricing garbage collection or subsidizing recycling collection in most cases (Palmer and Walls, 1997).
Commitment
Varotto and Spagnolli (2017) identified commitment (e.g., someone following through on their intended behavior or goal to do something) as a highly individual motivator. Some of the eight studies they examined (e.g., Werner et al., 1995) indicated that garnering commitment is a more effective strategy than providing information or incentives. However, this strategy would be difficult to implement on a large scale.
Feedback
More recent studies demonstrate and compare the effectiveness of different types of feedback campaigns (see Box 6-2; Hewitt et al., 2023; McKie et al., 2024; Schäufele-Elbers et al., 2024).
Another type of feedback is bin tagging, where haulers put a tag on curbside recycling bins that are contaminated with nonrecyclable material. Box 6-3 discusses an example of how bin tagging is used in Seattle. McKie and colleagues (2024) compared recycling quality (as measured by lower contamination rates) for households that received recycling information only against those that were also penalized for excessive contamination or missorting. Households that were also penalized for these errors were subject to temporary loss of their recyclable collection service. The study found that those who were subject to penalties reduced contamination more than those who were only provided with information (McKie et al., 2024).
6.3.1 State-Level Policies and Household Behavior
State-level recycling policies vary substantially across the United States (see Figure 6-12). Cecot and Viscusi (2022) categorized state laws into five types: goal laws, plan laws, opportunity laws, mandatory recycling laws, and deposit laws. Goal laws are aspirational laws that advocate that local governments set a recycling goal but have no concrete policy mechanism that will assist in meeting that goal. Plan laws require municipalities to develop a plan for meeting their recycling goals and to evaluate their current recycling programs. Plan laws are the most common form of recycling law, implemented in 15 states. Opportunity laws, the third level of stringency, include laws that require local governments to implement policies that provide recycling opportunities for households to engage in recycling but do not mandate that all residents recycle. Finally, mandatory laws require all residents to separate their recyclable products from other household waste and appropriately recycle those products. Additionally, some states have deposit laws (i.e., deposit-return systems, discussed in Chapter 4).
Viscusi and colleagues (2022) examined how moving between states with more or less stringent recycling laws impacts a household’s recycling rate. Moving to a state with a deposit-return system increased the number of material types recycled by households by 41 percent, while moving to a state with a strict recycling law (either mandatory or opportunity law) increased the number of materials recycled by 9 percent. Moving out of a state with a deposit-return system decreased the number of materials recycled
by 13 percent, while moving out of a state with a strict recycling law impacted only recycling of plastic, which decreased by 12 percent (Viscusi et al., 2022).
BOX 6-2
Social Feedback Case Study
In New York City, Hewitt and colleagues (2023) studied recycling rates among residents of multifamily buildings. They compared families that received feedback on recycling only in their building (noncomparative feedback) to families who received feedback regarding recycling both in their own building and in another nearby building (comparative feedback; see Figure 6-11). Both buildings exhibited increased recycling, providing evidence for the effectiveness of feedback that appeals to social norms. However, the comparative feedback information in the left panel of Figure 6-11 showed a greater apparent impact than the noncomparative feedback in the right panel (Hewitt et al., 2023).
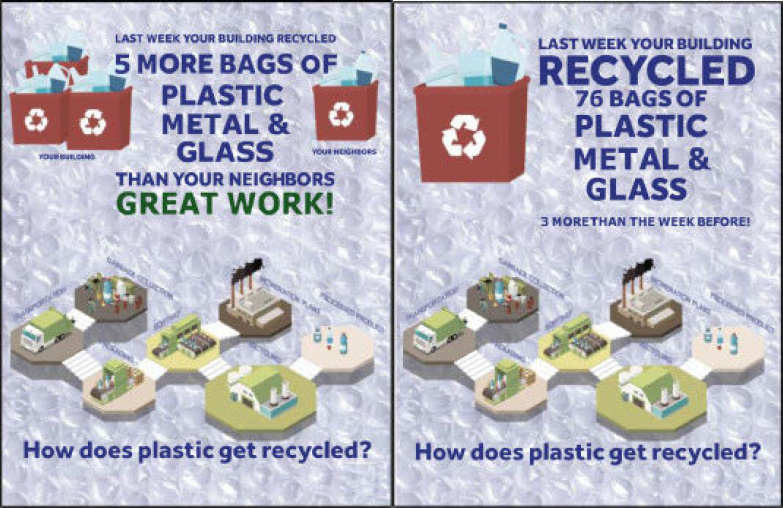
SOURCE: Hewitt et al., 2023. CC BY NC ND.
BOX 6-3
Case Study: Bin Tagging as Feedback in Seattle
Given the constantly changing population it serves, Seattle Public Utilities engages in education and incentive efforts for Seattle’s diverse and growing population; it uses the motto “Educate, educate, educate.” If a household’s curbside material in a recycling bin is contaminated, educational material is left and the bin is tagged as contaminated. Then, if the household fixes the contamination in the bin, the items will be collected later and a fee is charged. Seattle Public Utilities has a group of inspectors that will visit the household to educate and explain why the item was tagged. On the third time a household’s items get tagged, the utility issues a fine, announced to the household in a mailer. However, fines are rarely applied, as education typically results in less contamination and correct recycling behavior.
SOURCE: McKie et al., 2024.
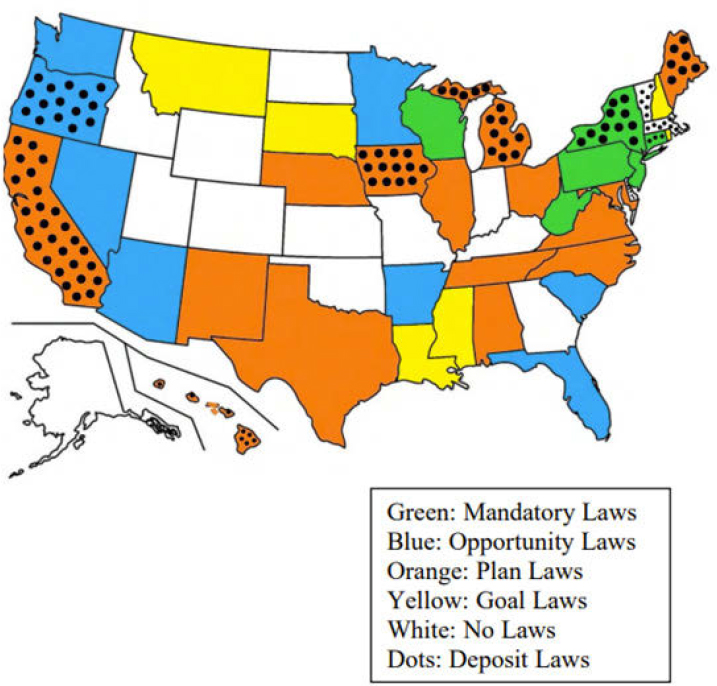
SOURCE: Cecot and Viscusi, 2022.
In a related study, Viscusi and colleagues (2023) examined factors beyond state policy that lead to changes in household recycling behavior. They found that increased market prices for cans and glass were associated with increases in recycling, but the same was not true for increased market prices for plastic and paper. Viscusi and colleagues (2023) hypothesized that the financial return that municipalities can reap from cans and glass, relative to plastic and paper, may “provide an inducement to promote recycling as a revenue source, and the resources obtained by selling the recycled materials may enable the municipality to promote household recycling efforts” (p. 4). Additionally, they found that declines in recycling are associated with large positive or negative household income shocks greater than 20 percent, moving into an apartment, getting married, and having a baby (Viscusi et al., 2023).
6.3.2 Increasing Recycling Access Through Business-Led Programs
As noted in previous chapters, access to municipal recycling collection and drop-off locations varies substantially across regions in the United States, across residential housing types, and across material types. Private-sector businesses sometimes fill in accessibility gaps by providing alternative collection programs. For instance, Ridwell3 provides a subscription service to collect items from subscribers’ doorsteps that are traditionally not accepted in municipal recycling programs, such as multilayered plastics, plastic films, batteries, and lightbulbs. And Terracycle4 collects hard-to-recycle materials via mail; customers purchase from the company a Zero Waste Box, which they can fill and ship back to the company. NexTrex5
___________________
4See https://www.terracycle.com/en-US.
5See https://nextrex.com.
provides drop-off locations for recycling plastic bags and film in major retailers such as Kroger, Albertsons, Meijer, and Kohl’s. More research and data are needed on the extent to which these business-led programs increase recycling access and recycling rates.
Nespresso is an example of a company trying to foster recycling partnerships between households and businesses. In New York City (and Jersey City in the near future), households may dispose of their aluminum Nespresso capsules into the blue recycling bins. In addition, these aluminum capsules can be recycled across the entire country if consumers order a bag that they fill with used capsules and the filled bags are mailed via the post service for recycling.6
6.3.3 Available, Convenient, and Accessible Infrastructure
To assess whether recycling is convenient for consumers requires an understanding of how consumers define convenience for a given recycling option. Consumer recycling convenience for a curbside program includes the time and space needed to sort and store materials. Consumer recycling convenience for drop-off programs involves transportation costs, as most of the existing drop-off centers are located outside city limits. However, some drop-off recycling centers have the benefit that consumers get paid when they redeem their recyclables (e.g., states with container deposit-return laws).
For drop-off options, identifying attributes of a visit that consumers value is key. Berck and colleagues (2021) found that consumers in California generally find drop-off recycling centers convenient when they are close to home, open at convenient times, and have short lines. Drop-off recycling centers in California seem to meet this definition for typical users, who tend to have lower levels of income and education. Those who do not choose to recycle at drop-off centers tend to be more affluent and hence may not find the money gained at drop-off centers to be worthwhile. Instead, they choose to recycle through curbside collections and at businesses (Berck et al., 2021).
Beatty and colleagues (2007) consider what would happen to overall recycling rates in California if access to curbside pick-up services were extended to more consumers. Using a panel regression framework, where material recycled is regressed on share of the population with access to curbside services, they found that marginal gains from extending these services would be small, as they would mostly induce consumers switching from drop-off to curbside recycling (Beatty et al., 2007). Best and Kneip (2019) found that a curbside scheme in Germany had no effect on paper recycling but increased recycling participation by 10–25 percentage points for plastic and packaging. In the United Kingdom, Abbott and colleagues (2017) found that the findings on the trade-off between recycling via curbside or noncurbside methods are ambiguous.
Berck and colleagues (2024) simulated the elimination of government-subsidized recycling drop-off centers, finding that closing them would not significantly alter consumer well-being for any major demographic group and would have little impact on whether households chose to recycle, given households could switch to nonsubsidized recycling drop-off centers and/or curbside recycling.
6.3.4 Community and Household Campaigns to Address Inconsistencies Across Programs
As discussed earlier in this chapter, misleading product labels, such as the chasing arrows symbol, are being used on products that are not accepted by most MRFs in the United States (EPA, 2023). For instance, many consumers are confused by on-product resin identification codes, which use the chasing arrows symbol around a number 1 through 7, as an indicator of a product’s recyclability. However, resin identification codes indicate only the type of resin (e.g., PET, high-density polyethylene [HDPE], polypropylene) and not whether a product is widely recyclable. Section 6.7.1 discusses federal guidelines to restrict the use of the chasing arrow symbol on products and packaging.
___________________
BOX 6-4
Case Study: Seattle’s Online Recycling Search Tools
Seattle offers recycling information for households with the “Where Does It Go” online search tool; this tool provides, in many languages, information about how to dispose of household waste items properly (see Figure 6-13).
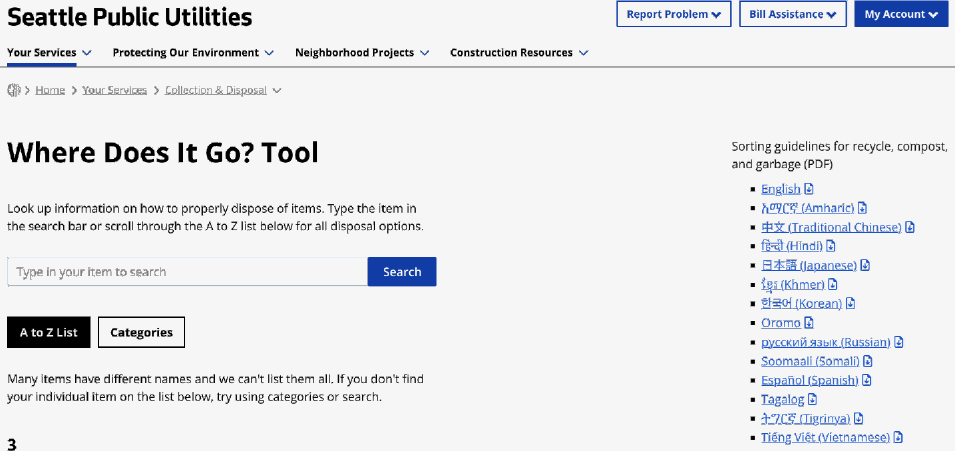
SOURCE: Seattle Public Utilities, see https://www.seattle.gov/utilities/your-services/collection-and-disposal/where-does-it-go#/a-z.
Confusion also arises because the items that can and cannot be collected for recycling may differ from state to state, city to city, and even household to household. For instance, in Champaign, Illinois, households contract individually with one of four curbside collection haulers, with some haulers taking a larger variety of recyclable materials than others (City of Champaign, n.d.). In the bordering town of Urbana, Illinois, all curbside recycling collection is handled through one service, which has a list of recyclable materials that differs from those in Champaign (City of Urbana, n.d.). Complicating matters further, the largest employer in Champaign-Urbana, the University of Illinois, operates a Waste Transfer Station and has its own list of recyclable materials. For instance, plastic shopping bags can be put out for recycling collection in Urbana, but not for some of the haulers in Champaign or at the University of Illinois. Plastics with resin numbers 3–7 are collected for recycling in Urbana and Champaign, but not at the University of Illinois. Section 6.7.1 later suggests a policy option for supporting and evaluating a national recycling label standard that would provide accurate information on which products are widely recyclable across the United States and which products require checking locally.
One avenue for addressing this confusion is community-based information campaigns. This approach could mean offering funding to local governments to develop materials about how residents can recycle in their specific neighborhood and residence type. For instance, the State of Delaware (n.d.) developed on online tool called Recyclopedia, where households can enter their address and find out what can be recycled in their neighborhood and how to recycle it. The State of Florida (n.d.) has a website called Rethink, Reset, Recycle; it discusses various types of recyclable materials and points to the contact information of county recycling coordinators for questions and concerns about what residents can recycle. Local governments, especially in municipalities where residents all have the same access to recycling, also dis-
tribute information on what can and cannot be recycled; for example, see the “What Can I Recycle?” website provided by Hamilton County, Ohio (Hamilton County Environmental Services, n.d.). Box 6-4 provides a case study on the online tools provided in Seattle, Washington.
Private companies are also beginning to provide more information to households. For instance, Recycle Coach7 is a mobile app that provides users with fast information about their local recycling program, including personalized recycling schedules, pick-up reminders, and information on what goes where. Recycle Coach has the goal of making recycling education fun, simple, and engaging. However, as with many crowdsourced mobile apps, Recycle Coach works best when more users verify that the local information is correct. Thus, these types of mobile apps may not be effective in places where recycling rates are currently low.
6.3.5 Targeted Programs for Different Demographics
As discussed earlier in this chapter, surveys and academic studies consistently find differences in recycling rates and recycling attitudes across demographic groups. For instance, groups found to be less likely to recycle include renters, those with lower levels of formal education, smaller households, younger adults, men, foreign-born Latinos, and African Americans (Shaw et al., 2014). Efforts to calibrate campaigns to the specific characteristics of the groups they target (e.g., providing informational material in Spanish in neighborhoods with high Spanish-speaking populations; using forms of media preferred by different demographics) can strengthen campaigns and make them more effective (Varotto and Spagnolli, 2017). While some groups (especially older adults and homeowners) with medium to high recycling rates are motivated to recycle for environmental reasons and for concern about neighborhood cleanliness, those with low recycling rates are more motivated by convenience (Shaw et al., 2014) and understanding how to recycle (Varotto and Spagnolli, 2017). In neighborhoods with high turnover of residents, social modeling and norm initiatives may be less effective, since social modeling works best when residents see themselves as part of the community (Schultz et al., 1995). Thus, ascertaining convenience and information needs for low-recycling populations, as well as social norms, is an important first step for campaigns targeting these groups.
Rural recycling is characterized by long hauling distances, sometimes four times those of urban and suburban areas. Low population density in rural areas results in lower waste generation and high usage of burn barrels. While recycling efforts in rural areas predominantly uses collection boxes scattered throughout large areas of rural counties, maintenance problems associated with those boxes have driven most programs to switch to staffed convenience centers, where both recyclables and mixed waste are collected for transport to more distant landfills. However, rural programs face challenges in finding markets for the materials they have collected, because of low market value and long distances to markets. Thus, efforts are necessary to find and create new markets close to home (Link and Stoke, 2021).
Funding can be tailored to enhance incentives for different demographic groups. For example, in the National Strategy for Reducing Food Loss and Waste and Recycling Organics (White House, 2024), substantial funding is available for tribal communities and communities with environmental justice concerns. More research specifically examining how groups with low recycling rates respond to recycling campaigns is needed. For instance, Lakhan (2016) examined how first-generation ethnic minorities respond to different types of recycling promotion and education campaigns used by municipalities in Ontario, Canada. Lakhan (2016) found that none of the recycling campaigns tested were able to increase recycling awareness or change recycling behavior among first-generation ethnic minorities. Participants reported that the campaigns were excessively complex and confusing, and they were skeptical of what municipalities did with the waste after it was collected. This study shows that (1) municipalities may need to rethink and redesign recycling initiatives to better engage minority communities and (2) more research is needed on what types of campaigns are effective in minority communities (Lakhan, 2016).
___________________
6.4 OVERVIEW OF SOCIAL IMPACTS
Social impact generally refers to the range of consequences, positive or negative, that affects communities (Jena and Ahmed, 2024). The social impacts of waste management span public health, community well-being, and economic opportunities, encompassing both intended and unintended effects on society (Aktar, 2023). Current waste management literature often focuses on environmental and economic aspects, leaving gaps in understanding of some broader social dimensions, such as equity and inclusion (Douglas, 2012; Martuzzi et al., 2010).
Frameworks such as the United Nations (n.d.) Sustainable Development Goals (SDGs) highlight the need for standardized social impact assessments across contexts, as discussed below, but no single framework is specific to waste management. Insights from environmental justice and social cost perspectives shed light on issues of equity and public health, but these perspectives rarely address the full scope of social impacts in waste systems (Murphy, 2010; Sharma et al., 2021). The World Bank’s framework—emphasizing inclusion, cohesion, resilience, and process legitimacy—suggests a holistic approach that can guide future assessments of waste management’s social effects (Haregu et al., 2016; WHO, 2023).
The following sections explore these frameworks, underscoring the need for a more integrated approach to evaluating the social dimensions of waste management comprehensively.
6.4.1 Defining Social Impact
The term social impact refers to the consequences of any action that affect society, which can be positive or negative, intended or unintended (Freudenburg, 1986). The term has multiple definitions, with no consensus reached on a universal definition (Marc and Ponikvar, 2022). Scholars note that the social impacts of waste management are predominantly linked to the environment and economy and that other dimensions, such as equity and well-being, are not considered separately. The lack of a clear definition for social impacts trickles down to social waste management scholarship (Hird, 2022). Some of the well-studied impacts of waste management include those on health and livelihoods (Ma and Hipel, 2016). For instance, waste management practices can impact the health of individuals living near landfills because of the release of hazardous substances into the environment. Waste management systems can also impact livelihoods by creating or diverting jobs from recycling plants or their automation.
Social impacts can be complex and diverse. As such, they need to be studied using common language and assessment criteria. International frameworks, such as the SDGs and the European Pillar of Social Rights, provide a set of guidelines and targets that help to standardize evaluation of social impacts across different contexts (European Commission, n.d.; Marc and Ponikvar, 2022). As discussed below, these frameworks emphasize various social dimensions, including poverty alleviation, education, health, and equality, as well as the environment or, more specifically, waste management. In addition, they aim to guide countries and organizations in achieving sustainable and equitable development. However, no single framework can measure all social impacts of waste.
Academic literature on environmental justice explores the relations between environment and society (Chowkwanyun, 2023). It categorizes social impact into two broad areas: equity, which concerns the distribution of resources, and procedural justice, which relates to the fairness of processes. Environmental justice waste studies tend to focus on the geospatial patterns of landfills or hazardous waste sites and the socioeconomics of nearby communities (Heiman, 1996).
The social cost literature, originating from environmental economics, also offers insights about social impacts. It assigns a monetary value to externalities, or indirect social impacts such as emissions. Typically, this is limited to the social cost of public health or livelihoods. Impacts related to labor in recycling and the well-being of informal recyclers are understudied (Dauvergne and LeBaron, 2013). Like practitioner literature, academic scholarship on the social impact of waste has been limited to an environmental lens instead of a societal lens.
6.4.2 Social Impact Frameworks
The World Bank posits that no single measure of social impact is universally accepted (Ballon Fernandez and Cuesta Leiva, 2024). It suggests that any holistic measure should account for four main dimensions: inclusion, cohesion, resilience, and process legitimacy. These dimensions provide a holistic framework for assessing social impacts, including those related to waste management. An inclusive society ensures access for all to markets, services, and spaces, allowing everyone to thrive. A resilient society can withstand shocks and stresses. A cohesive society has a shared purpose and trust, enabling collective action toward common goals. Process legitimacy refers to the fairness and credibility of the policies and programs implemented, which is crucial for public acceptance and participation (Ballon Fernandez and Cuesta Leiva, 2024).
Despite its comprehensive nature, this framework has not yet been applied to waste management. Scholars have an opportunity to define social dimensions for waste and to create a framework that can be used to explore the social aspects of waste and recycling. Table 6-4 summarizes some ways that the key social dimensions identified by Ballon Fernandez and Cuesta Leiva (2024) can be applied to waste management for a more comprehensive assessment. The indicators in the table were adapted from their original study for waste management and recycling. These indicators provide examples of how the social impact of waste management has been studied in the practitioner literature or academic literature (Ballon Fernandez and Cuesta Leiva, 2024). For example, The Recycling Partnership (2024) summarized how access to recycling differs across communities in the United States.
TABLE 6-4 Social Dimensions in Waste Management
| Dimension | Indicator | Examples of Studies |
|---|---|---|
| Inclusion | Access to recycling programs and recycling infrastructure across different socioeconomic groups | The Recycling Partnership (2024) |
| Proportion of the population with regular waste collection services | The Recycling Partnership (2024) | |
| Involvement of marginalized groups in decision-making related to waste management ADA-compliant and multilingual recycling information on product labels | Petts (2002)Anton et al. (2020) | |
| Cohesion | Level of information shared among households | |
| Ease of coordination among stakeholders in the waste life cycle | ||
| Community participation rates in waste reduction and recycling initiatives | Folz and Hazlett (1990); National Recycling Survey (1990) | |
| Degree of collaboration between various stakeholders in the waste management system | Lintz (2015) | |
| Resilience | The flexibility of waste management systems to adapt to changes in waste volume or composition | EPA (2024) |
| The ability of recycling markets to continue operating during extreme disruptions | ||
| Risks from the waste management system | ||
| Process Legitimacy | Public participation in waste management systems | Bernstein (2004); EPA (2023) (Note: Limited to hazardous waste); Wiedemann and Femers (1993) |
| The level of transparency in the waste management policy formulation process | ||
| Public access to information regarding waste management practices and policies | The Recycling Partnership (2024) | |
| Existence of formal grievance mechanisms for stakeholders to raise concerns about waste management. |
SOURCE: Generated by the committee, adapted from Ballon Fernandez and Cuesta Leiva, 2024.
Additional frameworks have been developed for assessing and measuring the social aspects of development and well-being, which could be applied to the study of the social impacts of recycling and other waste management:
- Global Indicator Framework for the SDGs: Adopted in 2017, the SDGs framework consists of 17 goals and 169 targets, measured through 232 individual indicators. This framework is a comprehensive approach to sustainable development, covering a wide range of social issues such as poverty, education, gender equality, and health. It includes Goal 12, which focuses on ensuring sustainable consumption and production patterns. Indicator 12.4 specifically targets the environmentally sound management of chemicals and all wastes throughout their life cycle. Indicator 12.5 aims to reduce waste generation substantially through prevention, reduction, recycling, and reuse.
- OECD Framework to Measure Well-Being: Through its Better Life Initiative, the Organisation for Economic Co-operation and Development (OECD) has developed a methodology to measure each OECD country’s distance from the SDG targets. The framework aims to support countries in understanding their progress and identifying critical focus areas. It includes environmental quality as a key dimension of well-being, with waste management as a critical component. Indicators related to waste include recycling rates and waste generation.
- Equal Measures 2030 SDG Gender Index: Launched in 2018, this index measures progress on the gender equality aspects of the SDGs. It aggregates gender-related goals into a single measure, providing insights into the status of women and girls in various countries. While this index focuses on gender equality, it includes SDG targets that relate to waste management, such as SDG 6 (clean water and sanitation) and SDG 11 (sustainable cities and communities), which encompass waste treatment and pollution reduction.
- European Pillar of Social Rights (EPSR): The EPSR is a set of 20 principles and rights essential for fair and well-functioning labor markets and welfare systems in the European Union. Introduced in 2017, the EPSR is monitored through the Social Scoreboard, which assesses member states’ progress in relation to the Pillar. While the EPSR primarily addresses social and employment issues, waste management can be related to its principles indirectly, through the promotion of a circular economy and sustainable work environments, which are part of the broader EU sustainability strategy.
- Social Progress Index: Developed by the Social Progress Imperative, this index measures the capacity of a society to meet the basic human needs of its citizens, enhance the quality of their lives, and create conditions for individuals to reach their full potential. The index includes 12 components that focus on actual life outcomes in areas ranging from shelter and nutrition to rights and education. This index includes components such as access to basic knowledge and environmental quality. Waste indicators may be reflected in the measurement of pollution levels and the effectiveness of waste management in contributing to a healthy environment.
- Happy Planet Index: Introduced by the New Economics Foundation in 2006, this index describes human well-being and environmental impacts. It combines subjective well-being, life expectancy, inequality of outcomes, and ecological footprint to show how efficiently residents of different countries use environmental resources to lead long, happy lives. This index’s ecological footprint component directly relates to waste indicators, as it measures the resources used by a country, including waste production and management. It reflects how waste impacts the overall sustainability of a country’s lifestyle.
- Sustainable Society Index: Developed by the Sustainable Society Foundation, this index broadly covers sustainability based on the three-pillar model of human, environmental, and economic well-being. The human well-being dimension, representing the social pillar, includes basic needs, personal development, health, and a well-balanced society. The index comprises 24 indicators across seven categories, providing a comprehensive assessment of a society’s sustainability. The human well-being dimension of this index can be associated with waste indicators through the
- basic needs category, which would include sanitation and waste disposal facilities, as well as through the health category, which is affected by waste management practices.
Each of these frameworks offers a unique perspective on assessing waste management from a social perspective and emphasizes the importance of considering a wide range of social dimensions. Each serves as a valuable tool for policymakers, researchers, and practitioners for measuring and improving social outcomes, ensuring that development efforts lead to a more equitable and sustainable future for all. In their review of several additional frameworks, Gionfriddo and Piccaluga (2024) emphasized that these models lack scientific rigor and flexibility.
While frameworks can be helpful individually, it is essential to develop a standardized framework to be used across multiple settings and scales, including firms and local governments. Such standardization would enable scholars, practitioners, and policymakers to share a consistent understanding of the social dimensions critical to these systems.
6.4.3 Social Impacts Considerations for Value Chain Actors
Social impact studies on waste management have traditionally concentrated on the direct impacts at the point of waste treatment, such as health outcomes from toxic leakage and livelihood effects from recycling centers. While important, these do not account for the entire waste life cycle.
A product’s waste life cycle includes choices and outcomes with significant social implications, including product design choices, consumer purchase and disposal choices, material recovery, material treatment, and material reuse (Hafsa et al., 2022). Hafsa and colleagues (2022) describe how decisions at each of these value chain stages impact end of life waste.
Building on the waste life cycle concept, each value chain stage has social impacts. For instance, the way products are designed can either facilitate or hinder recycling and reuse, impacting the volume and toxicity of waste and, ultimately, public health (Fullerton and Wu, 1998). Retailers influence consumer choices through packaging options and marketing, which can either promote sustainability or contribute to a throw-away culture. Consumer purchasing decisions—often based on price, convenience, or brand loyalty—directly affect the amount and type of waste generated. Additionally, the way consumers dispose of products—whether through recycling, composting, or simply discarding—can be influenced by social norms, education, and the accessibility of waste management infrastructure (as described earlier in this chapter). Finally, social impacts considerations are relevant to waste treatment methods and the functioning of recycling markets (see Chapter 5). These markets are shaped by a complex interplay of social, economic, and policy factors that determine who participates and who benefits. A comprehensive approach to social waste studies that encompasses the entire waste value chain would provide a more holistic understanding of the social impacts at each stage and offer insights into more effective interventions for sustainable waste management.
It would be important, however, to consider the key social dimensions for each value chain actor. To identify some research opportunities for holistic social impact research on waste management and recycling, the committee combined the key social dimensions identified by Ballon Fernandez and Cuesta Leiva (2024) with the waste value chain decision-making framework shown in Table 6-5. Potential research questions are identified for each value chain stage and social dimension. For example, at the product design stage, what sort of considerations can influence inclusion, resilience, social cohesion, and process legitimacy, which will trickle down into waste management? These questions indicate that while the problem-framing remains similar, the nature of the value chain stage impacts the sort of action that can be taken to promote a healthy social impact.
6.5 COMMUNITY IMPACTS
Recycling programs play a pivotal role in enhancing community cohesion and resilience, with impacts that reach beyond environmental benefits to foster social and economic value. Effective recycling
initiatives encourage local participation and shared responsibility, helping to establish recycling as a community norm. Through outreach and education tailored to diverse populations, these programs promote widespread engagement and support long-term behavioral shifts toward sustainability. In smaller communities, such targeted efforts have proven particularly effective, where interpersonal connections can amplify community involvement.
TABLE 6-5 Potential Research Questions for Assessing the Recycling Value Chain and Its Social Impact
| Inclusion | Resilience | Social Cohesion | Process Legitimacy | |
|---|---|---|---|---|
| Product design: The design must be recyclable, compostable, or reusable. | How does inclusive product design impact the use and acceptance of waste-based products by various demographic groups? | What design principles are most effective in creating products whose waste is adaptable to changing environmental conditions? | How can product design for waste strengthen social ties and collective action within communities? | What are the ethical considerations in product design for waste, and how do they impact process legitimacy? |
| Consumer behavior: The consumer must place it in the appropriate material recovery channel. | What barriers do marginalized communities face in accessing recycling facilities, and how can these be overcome? | How do consumers adapt their waste disposal and recycling behaviors in response to changes in local recycling policies or infrastructure? | How does community involvement in recycling initiatives influence individual consumer behavior toward waste disposal? | What factors influence consumers’ trust in the recycling process and their willingness to participate in proper waste sorting? |
| Material recovery: Convenient and efficient channels are necessary for successful material recovery. | How can material recovery channels be designed to accommodate the needs of diverse populations, including people with disabilities, low-income households, and non-English speakers? | What roles do consumer education and awareness play in maintaining resilient material recovery practices? | How do social networks and community organizations contribute to the promotion of effective recycling practices? | What is the role of clear communication and information dissemination in establishing the legitimacy of material recovery channels? |
| Material treatment: It must be profitable to recycle or compost recovered material. | What barriers do small businesses and informal waste pickers face in participating in profitable recycling ventures, and how can these barriers be reduced? | What strategies can be implemented to make recycling businesses resilient to market fluctuations and changes in demand for recycled materials? | What impacts do local recycling cooperatives have on fostering social cohesion and improving economic outcomes? | What roles do certifications and standards play in legitimizing recycling operations and enhancing profitability? |
SOURCES: Generated by the committee, using dimensions from Ballon Fernandez and Cuesta Leiva, 2024, and Hafsa et al., 2022.
6.5.1 Awareness and Education Initiatives
In a Pew Research Center poll (2016), 28 percent of Americans reported that their community’s social norms strongly encourage recycling and reuse, while 22 percent reported that most people in their community do not encourage recycling. The remaining 48 percent reported being somewhere in the middle (Pew Research Center, 2016).
Communication strategies related to implementing waste management systems need to focus on raising awareness while allowing for the consistent and effective flow of information between local authorities and the local community. In addition, education efforts are needed at recycling facilities to ensure that the quality of recycling materials meets end-user buyers’ quality requirements (see Box 6-5).
BOX 6-5
Case Study: Quality Disconnect Between MRFs and Wisconsin End Users
Some materials recovery facilities (MRFs) are not paying adequate attention to the quality of the collected materials they are trying to market, as seen in examples of steel cans leaving recycling facilities (the MRFs) and going to Wisconsin foundries (the end users). The recycled materials arrived contaminated with shredded paper, engine parts, plastics, and the materials that were picked up when the cans were processed (Burgert, 1993). Local governments could engage in education to improve MRF management, especially in rural areas, to make sure they can meet the quality requirements of end users’ recycled can markets, which is the most profitable material for rural areas. The Wisconsin Department of Natural Resourcesa has implemented initiatives aimed at improving recycling programs that can help address the quality and marketability of recyclables such as the Wisconsin Recycling Markets Directory.b
6.5.2 Reducing Public Health Risks
Research has documented reduced exposure to litter, leakage, or waste in general due to recycling behavior. For instance, Deeney and colleagues (2023) conducted a meta-analysis of studies focusing on consumer plastics in high-income countries. Their evidence suggests that the health risks of plastic use and improper disposal could be reduced by increasing recycling. And other studies have shown that leakage from landfills can be toxic to groundwater and nearby populations, particularly where landfill design and operating requirements are insufficient (Alslaibi et al., 2011; EPA, 2001; Regadío et al., 2012); thus, diverting recyclables from landfills can improve groundwater quality and human health of nearby residents.
6.5.3 Creating Value from Recycled Materials
Local communities have developed efforts to reduce the need to dispose of recyclable materials and create alternative uses for recycled or remanufactured materials (see Boxes 6-6 and 6-7). Examples include using old newspapers for soil preparation and animal bedding (Bond, 2017) and reusing glass as aggregate in paving materials (Harrison et al., 2020).
BOX 6-6
Case Study: The Minnesota-Based Wood From the Hood
Minnesota uses its recycling development program to support local businesses that use recycled materials from local waste in their business model. An example is Wood From the Hood (2024), which “was born with a simple idea: Reclaim discarded trees from local neighborhoods to create beautiful, high-quality hardwoods.”
6.5.4 Creating Jobs
Since 2014, MRF operators have increasingly adopted automation, robotics, and artificial intelligence in mechanical recycling processes, most commonly in sorting. While several of these technologies
replaced human labor, in some cases automation was implemented because a shortage of sorters (Pyzyk, 2019).
BOX 6-7
Case Study: Community-Centered Recycling in Phoenix
The City of Phoenix launched the Circular Plastics Microfactory in partnership with Arizona State University (ASU), Goodwill of Central and Northern Arizona, and Hustle PHX (Kass, 2024). This initiative aims to recycle plastic waste into valuable products such as skateboards, furniture, and durable plastic components.
The facility consolidates multiple processes (plastic collection, processing, and remanufacturing) in one location. Plastic waste sourced from Goodwill serves as raw material for future projects, ensuring a steady supply chain. ASU plays a pivotal role in the design process through its Circular Living Lab, which tests and develops products made from recycled plastics. Hustle PHX contributes by supporting minority entrepreneurs through financial capital and training programs. This partnership underscores the potential of shared goals and collective action in creating a sustainable future.
The microfactory addresses pressing environmental challenges while fostering economic growth and job creation for the community. The facility currently employs 10 workers, equipping them with valuable skills and generating economic opportunities within the community.
This approach exemplifies the power of collaboration between institutions committed to sustainability. By integrating sustainability practices with economic resilience, the Circular Plastics Microfactory serves as a model for other cities, proving that local initiatives can drive global change while benefiting communities directly.
While waste disposal has traditionally involved labor in the garbage collection and landfilling industries, Morris and Morawski (2011) found that the number of jobs created by disposing of material pales in comparison with the job creation potential in the circular economy through reuse, recycling, and remanufacturing.
6.6 PURSUING FAIRNESS IN ACCESS TO BENEFITS OF RECYCLING
Environmental justice considerations in recycling involve ensuring that all communities have fair access to waste management services, including convenient recycling facilities and infrastructure for waste sorting and recovery. Environmental justice includes addressing disparities in service availability, such as differences between public and private facilities, and ensuring that decision-making processes in waste management are inclusive and transparent. Expanding the extensive research on environmental justice to include the impact of recycling and waste management policies on vulnerable communities can help create more effective recycling systems.
6.6.1 Environmental Justice in Recycling Services
Environmental justice in the context of recycling and waste management focuses on two primary approaches: equity and justice. These approaches aim to address the fair distribution of waste management resources and just processes for their allocation. Despite the importance of these issues, scholarship has been limited on how environmental justice intersects with waste and recycling, compared with areas such as emissions and infrastructure. This section explores the current trends in environmental justice related to waste management, the existing gaps in the literature, and directions for future research.
Equity in waste management includes the fair allocation of segregated recycling collection centers, the establishment of recycling markets, the placement of MRFs, and the availability of services for collecting hard-to-recycle waste. It ensures that all communities, regardless of income or race, have access to
facilities and services that allow them to manage waste responsibly. Without equity, low-income and marginalized communities often face the brunt of poor waste management practices, leading to increased exposure to pollution and health hazards.
Procedural justice in waste management focuses on fairness of the processes used to allocate resources and manage waste, including transparent decision-making, inclusive participation, and accountability in setting up waste management systems. Procedural justice ensures that community members have a voice in decisions that affect their environment, particularly in marginalized communities that have historically been excluded from such processes. By incorporating procedural justice, waste management practices can be made more democratic and reflective of the needs and rights of all community members.
According to Chowkwanyun (2023), the environmental justice literature has focused predominantly on issues of income and race, environmental emissions, and infrastructure (e.g., schools, highways). The existing literature has effectively identified reasons for disproportionate exposure to environmental harms and issues of mitigation and maldistribution. However, relatively little literature has been devoted to environmental justice issues specific to MSW and recycling. Several critical areas are in need of further research:
- Policy decisions and regulations: Given a gap in understanding of how policy decisions and regulatory frameworks shape waste management practices, the literature often fails to address how different policies may lead to unequal outcomes in waste distribution and exposure.
- Demographic transformations: Changes in population demographics, such as urbanization and aging, have significant impacts on waste generation and management. The environmental justice literature has not adequately explored how these transformations affect waste management practices and the resulting effects on justice.
- Migration patterns: The movement of populations, whether due to economic opportunities or environmental displacement, affects waste management. But little research has tried to understand the intersection between migration and waste management from an environmental justice perspective.
- Political arrangements: The role of local, state, and national political structures in shaping waste management policies and practices is another area not thoroughly examined. Political arrangements can influence how resources are allocated and which communities are prioritized.
- Corporate behavior: The actions of private corporations, which often manage waste facilities, play a crucial role in waste management practices. The environmental justice literature has not fully addressed how corporate behavior influences environmental justice outcomes, particularly in terms of waste management.
To address these gaps, future research needs to focus on broader social impacts and historical accounts of policies that explain modern-day problems. Understanding the historical evolution of recycling infrastructure and policies can shed light on current disparities in waste management. By examining how past policies and practices have led to present-day issues, researchers can better identify pathways for more equitable waste management systems. The following research questions could guide such studies:
- How have historical waste management policies impacted different communities over time?
- How have race and socioeconomic status influenced the placement of landfills, incinerators, and recycling centers? What historical policies or practices led to these patterns?
- What are the long-term health impacts on communities that were historically exposed to poor waste management practices?
Environmental justice research has often been closely related to litigation, which has been a crucial tool for addressing disparities. Ongoing litigations or government accounts of waste management practices can provide valuable insights into the systemic issues that lead to unequal outcomes. For instance, the United Church of Christ (1987) highlighted that communities of color disproportionately bore the burden of exposure to toxic waste. And a study by the U.S. Government Accounting Office (1995) identified spatial
patterns of landfill and hazardous waste locations along race and income. These studies underscore the importance of using litigation and governmental research to uncover and address environmental injustices in waste management. Some questions to consider:
- What waste-related litigation has led to significant policy or regulatory changes?
- How do federal and state policies differ in their approach to environmental justice litigation?
- Are disparities in litigation outcomes based on the demographics of the plaintiffs? How do these disparities reflect broader societal inequities?
Addressing these gaps requires a focus on equitable distribution of waste management resources and just processes for decision-making. By expanding the scope of environmental justice research to include waste management, policymakers and scholars can develop more comprehensive strategies for ensuring that all communities are treated fairly in the distribution and management of waste.
6.6.2 Sources for Environmental Justice–Related Data
Two data sources have been developed for understanding the social impacts of waste management. After describing each one, the committee offers suggested questions for guiding research using the data offered in these sources.
EPA’s Interactive Recycling Infrastructure and Market Opportunities Map
EPA’s Interactive Recycling Infrastructure and Market Opportunities Map8 offers a detailed overview of waste management facilities across the United States, supporting the goals of the National Recycling Strategy and the Bipartisan Infrastructure Law. This map provides information on existing recycling infrastructure, per capita waste generation, and recycling rates for postconsumer materials, along with other market-related factors.
By mapping these details, the tool aims to bolster both primary and secondary markets for recyclable materials, promote cleaner communities by reducing landfill waste, and support climate change initiatives by diverting waste from landfills. The map covers all stages of the recycling process from waste generation to end use. It identifies the locations of 15 types of waste management facilities, including MRFs, composting sites, electronics recyclers, recycling facilities for various specific materials, anaerobic digesters, municipal solid waste landfills, transfer stations, and secondary processors for glass and wood. For each facility, the map provides comprehensive data such as the facility’s name, address, contact information, type, and feedstock, where available.
Additionally, the map offers insights into the estimated tons of generated and recycled materials, categorized by zip code and material type. It includes data on 16 types of recyclable materials, such as aluminum, cardboard, electronics, various plastics, food waste, glass, steel cans, tires, paper, textiles, yard trimmings, and wood.
The data presented in this tool are based on the best available information from 2021 to 2022. The map serves as a valuable resource for understanding the current landscape of recycling infrastructure and opportunities for market development in the United States.
Complementing EPA’s waste management map with demographic information and historical accounts offers promising research opportunities to explore the social impacts of recycling infrastructure and waste management practices. By correlating facility locations with socioeconomic indicators such as income levels, education, and employment, researchers can examine how economic factors influence recycling rates and access to infrastructure, potentially revealing disparities between affluent and lower-income communities. Integrating health statistics can provide insights into whether areas with more robust recycling programs and better waste management infrastructure experience improved health outcomes, especially concerning waste-
___________________
8See https://www.epa.gov/circulareconomy/recycling-infrastructure-and-market-opportunities-map.
related illnesses. Additionally, studying the evolution of recycling practices and infrastructure over time can reveal trends and the historical impact of waste management policies on different communities. Analyzing historical pollution and landfill data can further illustrate past environmental burdens and assess how advancements in recycling have addressed these issues over the years.
Plastic Litigation Tracker
In 2022, the New York University School of Law launched the Plastics Litigation Tracker,9 which provides a database of the past and pending cases involving plastic products or pollution. The database includes 44 distinct cases dating back to 1971. The tracker enables environmental justice scholars to identify examples of waste-related litigation and observe how they may lead to policy changes.
For example, in 2018, Smith v. Keurig Green Mountain, Inc. (No. 4:18-cv-06690),10 a federal court approved a class-action settlement involving claims that a company misled customers about the recyclability of its single-use coffee pods. The lawsuit argued that the company violated laws in California and Massachusetts by falsely advertising the pods as recyclable, which could contribute to plastic waste and climate change. The settlement includes a $10 million payment for customers, legal fees, and other costs. The company must also add a disclaimer, “Check locally—Not recycled in many communities,” on packaging and ads. Any leftover settlement funds will go to Ocean Conservancy and Consumer Reports.
In Minnesota, Attorney General Keith Ellison filed a lawsuit against Reynolds Consumer Products and Walmart for misleading consumers by advertising Hefty recycling bags as recyclable, even though they are made from low-density polyethylene, which cannot be processed at recycling facilities (No. 62-CV-23-3104 [Minn. Dist. Ct. 2024]). As a result, recyclable items placed in these bags end up in landfills. In August 2024, the companies reached a settlement, agreeing to halt the sale of the bags in Minnesota for 2.5 years. Afterward, they will label the bags as “not recyclable.” The companies will also pay $216,670, covering profits from the bags, and Reynolds will implement antigreen washing training and revise its marketing review process.
These litigations show that many states are concerned about recycling labels on products and following the “polluter pays” principle. In both cases the firms were asked to retract their labels and use information that correctly portrayed whether the product could be recycled locally (in those states).
6.7. KEY POLICY OPTIONS
6.7.1 National Recycling Labels and Regulations for Products and Packaging
One of the primary objectives of MSW recycling programs is to make them easy to understand and use. Surveys show high levels of confusion on the part of consumers as to what can be recycled and how to dispose of recyclables “correctly.” Labels on products and their packaging are sometimes inconsistent with local rules about what consumers can recycle. For an important example, in the 1980s, the American Society of the Plastic Industry developed resin identification codes (1–7) to indicate the type of plastic used in a product or packaging. In addition to the plastic code number, these codes use the chasing arrows symbol, which is an internationally recognized symbol for recycling. The arrows lead consumers to believe the product or packaging can be recycled, even though the codes indicate only the type of plastic and technical feasibility of recycling and not whether it can be recycled in any given location.
While several U.S. cities offer consumer-oriented programs to improve information and reduce confusion in recycling, more could be done at the national level to evaluate existing efforts and develop consistent messaging to reduce confusion at the point of recycling decisions. Specifically, the Federal Trade Commission and EPA could support the adoption of on-product recycling labels that reflect the recyclability of products more accurately, as well as the variability of recycling across the United States. The same labels
___________________
9See https://plasticslitigationtracker.org.
10See the Plastics Litigation Tracker at https://plasticslitigationtracker.org/?keywords=18-cv-06690.
should be used for online purchases. An example of a state law is California’s SB 343 (Allen, Chapter 507, Statutes of 2021), which “directs CalRecycle to publish data about the types of materials actually recycled in California. Manufacturers and other interested parties must use that information as part of their assessment of whether products can be considered recyclable for labeling purposes. The law outlaws manufacturers and others from selling products or packaging labeled as recyclable unless the items are regularly collected and processed for recycling in the state” (CalRecycle, n.d.).
National labeling standards have been enacted in Australia and New Zealand through the Australasian Recycling Label (ARL).11 This label was developed by the nonprofit Australian Packaging Covenant Organization. The Australian National Government (2023) supports the ARL with educational materials (see, e.g., Department of Climate Change, Energy, Environment and Water, n.d.) and by investing “$5 million to support 20,000 small to medium-sized enterprises (SMEs) to improve the sustainability of their packaging and adopt the Australasian Recycling Label (ARL) on their packaging through the SME ARL Program” (para. 13). The Australian Packaging Covenant Organisation assumes responsibility for the ARL, and since 2022, has owned and operated the label with the support of other nonprofits, such as Planet Ark and PREPDESIGN.
Similarly, EPA, in partnership with producers, could support national recycling label standards; the How2Recycle labels presented in Table 6-6 were created by the Sustainable Packaging Coalition. If EPA considers a new label instead, it would be important to pretest to ensure that it is accurate and clear to consumers across a full range of educational and demographic backgrounds. Additional costs for this program include:
- Funding regular, nationwide analyses at MRFs to identify which materials are commonly collected, sorted, sold, or transferred for recycling in the United States. This data collection would be similar to what was required in California under SB 343.
- Monitoring the proper use of the new label, as well as any improper use of chasing arrow symbols.
- Creating funds for businesses, especially small and medium enterprises, to adopt the new label.
Regulating the use of the chasing arrow symbol would eventually reduce consumer confusion and restore trust in on-package recycling information. The label could be developed in a similar fashion to the U.S. Department of Agriculture’s USDA Organic label to clarify and coordinate market information. Additionally, it can be used in conjunction with other policy options as part of an extended producer responsibility program. A trade-off for this policy is the monitoring it would require on the part of the federal government.
Implementation of this policy could begin with a 2-year initial product labeling study at the national level. It could draw on waste characterization studies already being conducted or funded by states (e.g., California), federal agencies (e.g., Department of Energy, Bioenergy Technology Office), and industry groups (e.g., Sustainable Packaging Coalition) to identify data gaps. The study would then collect data to fill in identified gaps in evidence available. New prohibitions against mislabeling products could be enforced 2 years after completing the initial study. Future product studies would then be needed every 5 years after the first study.
A consumer survey could be developed to assess the effectiveness of the policy implementation, investigating consumer recognition of new labels and their clarity and effectiveness in communicating the intended information (e.g., Boyer et al., 2021; Donato and Adıgüzel, 2022; Fischhoff et al., 1998). Curbside audits could collect measures of contamination before and after the policy is implemented. Regular monitoring of misuse of recycling labels would also be needed.
___________________
| Widely Recyclable | Recycle packages with the Widely Recyclable label through curbside or drop-off programs. Packages with this label are accepted by 60% of America’s recycling facilities and 50% of Canada’s. |  |
| Check Locally | Recycling programs vary across communities. Always check locally to see what your area accepts. |  |
| Store Drop-off | In the United States, plastic bags, wraps, and films are not accepted in most curbside or drop-off programs. However, many of these packages are eligible for Store Drop-off recycling. |  |
| Not Yet Recyclable | Dispose of packages with the Not Yet Recyclable label in the trash. Less than 20% of Americans and Canadians can recycle this package or significant challenges exist in sortation, reprocessing, or end markets. Check online for regular updates to the list of recyclable products. |  |
NOTE: The labels shown here will be updated in 2025; the version displayed reflects the state at the time this report was written.
SOURCE: How2Recycle.info.
Conclusion 6-1: Reforming product labeling regulations and practices to provide accurate information (i.e., to prevent mislabeling) on what products are or are not recyclable would achieve multiple policy objectives, including clarifying information for consumers, decreasing contamination, and increasing efficiency of recycling systems.
Recommendation 6-1: The Federal Trade Commission (FTC) should revise its Guides for the Use of Environmental Marketing Claims so that resin identification codes no longer use the chasing arrows symbol. Additionally, FTC should prohibit use of the chasing arrows symbol
or any other indicator of recyclability on products and packaging unless the items are regularly and widely collected and processed for recycling across the United States. Furthermore, with or without a mandate to do so, producers should adopt and use updated resin identification symbols that do not include the chasing arrows symbol.
Key Policy Option 6-1: The U.S. Environmental Protection Agency (EPA), in partnership with producers could support and evaluate national recycling label standards—through education, outreach, and funding—such as the How2Recycle symbols created by the Sustainable Packaging Coalition. Additionally, the U.S. Congress, through EPA, could provide funding for small- to medium-sized companies that lack capability for transitioning to a new national recycling label standard.
6.7.2 Funding Social Modeling Programs
Social norms are beliefs or behaviors held by individuals in a social network or in a perceived identity group with whom individuals wish to affiliate. This group identification can be local (e.g., family, friends, coworkers) or regional, national, or global, especially as facilitated by the internet. Social norms may be used to design communications that address the concerns and values of a target population.
As discussed earlier in this chapter, Varotto and Spagnolli (2017) found that social modeling was by far the most effective intervention for increasing recycling behaviors. Many of the programs studied recruited community members who were already participating in a recycling program to act as leaders in their community. These “block leaders,” as they are often known, are tasked with modeling proper recycling behaviors and informing and convincing their nonrecycling neighbors to participate in recycling. Block leaders may organize meetings or may have more informal face-to-face interactions with those in their community. Other means of education and communication, such as a website or library display, may support block leaders’ efforts and provide further opportunities for social modeling.
Varotto and Spagnolli’s (2017) findings are consistent with other studies of recycling behavior (Burn, 2006) and studies in other domains, such as energy and water conservation, where social modeling with the block leader approach is used to promote targeted behaviors (Abrahamse and Steg, 2019; Champine, 2023; Fiorillo and Senatore, 2024; Geiger et al., 2019; Niemiec et al., 2021). The block leader approach, and social modeling more generally, are consistently found to be effective at influencing individual behavior. The intuition behind social modeling programs is that the desire to comply with social norms often provides a strong motivation for individual and group behavior.
The objectives of the proposed policy are to advance social and environmental goals (including distributional effects); increase community engagement in recycling; and reduce household confusion, in order to ultimately reduce contamination. Face-to-face programs and sharing advice have been shown to be very effective at influencing beliefs and behaviors. These programs are typically run among neighbors or other residential groups (e.g., homeowners’ association, local charitable organization), or in work and office settings.
An advantage of social modeling is its low cost, as compared with other techniques. A disadvantage is that it depends on the extent to which block leaders are present and willing to participate and the extent to which residents see themselves as part of the community. Face-to-face programs require ongoing effort to recruit and retain block leaders and to provide programming and feedback to block leaders. The ability to maintain and spread these programs over a large area and for a long time has not (as far as we know) been demonstrated. Additionally, the broader impact may be limited by the participant makeup. Residential groups tend to attract participants who are already environmentally conscious and already recycle, with less potential for significant upward shifts by a more representative demographic. Workplace groups may include a mix of those who volunteer and those that are “voluntold,” and a range of workplace concerns and agendas may distract from the recycling purpose. Thus, rather than relying solely on residential and workplace groups, block leaders can likely increase their impact by going out into the community and reaching people in “third places”—informal public gathering places, such as cafes, coffee shops, community and recreation centers, beauty parlors, general stores, bars, and church groups (Oldenburg, 1989).
Following a call for proposals (from state or municipal agencies administering the grants), the following timeline is suggested: 1 year (Year 0) to gather a team, appoint project leaders, and write and submit a responsive proposal. In Year 1 (following funding): convene first diagnostic social modeling group and block leader to develop and iterate on materials and procedures for group meetings. Have participants report on their commitments, planned behavior, and actual recycling behavior. In Year 2 use the results from Year 1 to develop revised materials and procedures for a second group (or two). Compare the level of success achieved in Year 2 with that in Year 1. Then in Year 3, write and submit community reports and a website describing the study and its achievements. Begin to explore opportunities for spawning multiple groups across the MSW service area.
To assess the effectiveness of the policy implementation, consumer surveys could be developed to investigate consumer recycling knowledge. Curbside audits could collect measures of contamination before and after the policy is implemented. Data on material recovery before and after the policy is implemented could be collected from MRFs in areas that implemented it compared with control MRFs in areas without social modeling programs.
Conclusion 6-2: Social modeling programs are effective interventions for enhancing recycling behavior and establishing positive recycling norms in communities. Policies that promote social modeling programs can achieve various objectives for recycling. They can clarify information for consumers, decrease contamination, increase the cost-effectiveness of recycling collection and processing, and enhance the social and environmental benefits associated with recycling.
Recommendation 6-2: The U.S. Environmental Protection Agency should provide grants for state, municipal, local, and tribal governments for enhancing and expanding local social modeling programs, especially in disadvantaged communities and communities with high numbers of multifamily dwellings. Local governments, in turn, should implement or support social modeling programs, potentially through partnership with local nonprofits or other community-based groups, to engage directly with community members to promote positive social norms and recycling practices.
Key Policy Option 6-2: The U.S. Congress could reauthorize and further appropriate funds to the Consumer Recycling Education and Outreach Grant Program, authorized in the Infrastructure Investment and Jobs Act, to support social modeling programs.
Key Policy Option 6-3: To ensure sufficient data are available to inform policy decisions on recycling, the U.S. Environmental Protection Agency (EPA) could support studies to update or otherwise fill important data gaps and research needs. These options include:
- Regularly collect and report direct observations of household and commercial behavior related to recycling. In addition to filling knowledge gaps, these data would complement top-down modeling in the recycling system and enable empirical study of the impact of public policy. As part of these efforts, EPA could consider a periodic household and commercial survey for waste and recycling akin to the Energy Information Administration’s Residential Energy Consumption Survey.
- Track household time spent on recycling to support more complete and accurate estimates of the economic and social costs of recycling and to ensure that lifecycle assessment models are as updated and as accurate as possible.
REFERENCES
Aadland, D., and A.J. Caplan. 1999. Household valuation of curbside recycling. Journal of Environmental Planning and Management 42(6):781–799.
Aadland, D., and A.J. Caplan. 2003. Willingness to pay for curbside recycling with detection and mitigation of hypothetical bias. American Journal of Agricultural Economics 85(2):492–502.
Aadland, D., and A.J. Caplan. 2006. Curbside recycling: Waste resource or waste of resources? Journal of Policy Analysis and Management: The Journal of the Association for Public Policy Analysis and Management 25(4):855–874.
Abbott, A., S. Nandeibam, and L. O’Shea. 2017. The displacement effect of convenience: The case of recycling. Ecological Economics 136:159–168.
Abrahamse, W. 2019. Encouraging pro-environmental behaviour: What works, what doesn’t, and why. Academic Press.
Aktar, N. 2023. Unveiling the impact of solid waste management on health and poverty alleviation in Dhaka City. Global Journal of Human-Social Science. https://www.academia.edu/download/105564005/5_Unveiling_the_Impact.pdf.
Alslaibi, T., Y. Mogheir, and S. Afifi. 2011. Assessment of groundwater quality due to municipal solid waste landfills leachate. Journal of Environmental Science and Technology 4. https://doi.org/10.3923/jest.2011.419.436.
Ando, A., and A. Gosselin. 2005. Recycling in multifamily dwellings: does convenience matter? Economic Inquiry 43:426–438. https://doi.org/10.1093/ei/cbi029.
Antón, E., N.B. Soleto, and J.A. Duñabeitia. 2020. Recycling in Babel: The Impact of Foreign Languages in Rule Learning. International Journal of Environmental Research and Public Health 17(11):3784. https://doi.org/10.3390/ijerph17113784.
Ballon, F., P. Marcela, and J.A.C. Leiva. 2024. Measuring social sustainability: A multidimensional approach. Policy Research Working Paper Series.
Barr, S. 2007. Factors influencing environmental attitudes and behaviors: A U.K. case study of household waste management. Environment and Behavior 39(4):435–473. https://doi.org/10.1177/0013916505283421.
Beatty, T.K.M., P. Berck, and J.P. Shimshack. 2007. Curbside recycling in the presence of alternatives. Economic Inquiry 45(4):739–755.
Berck, P., G. Englander, S. Gold, S. He, J. Horsager, S. Kaplan, M. Sears, A. Stevens, C. Trachtman, R. Taylor, and S.B. Villas-Boas. 2021. Recycling policies, behavior and convenience: Survey evidence from the CalRecycle program. Applied Economic Perspectives and Policy 43(2):641–658. https://doi.org/10.1002/aepp.13117.
Berck, P., M. Sears, R.L.C. Taylor, C. Trachtman, and S.B. Villas-Boas. 2024. Reduce, reuse, redeem: Deposit-refund recycling programs in the presence of alternatives. Ecological Economics 217:108080. https://doi.org/10.1016/j.ecolecon.2023.108080.
Bernstein, J.D. 2004. Social Assessment and Public Participation in Municipal Solid Waste Management. Washington, DC: World Bank Group.
Best, H., and T. Kneip. 2019. Assessing the causal effect of curbside collection on recycling behavior in a non-randomized experiment with self-reported outcome. Environmental and Resource Economics 72. https://doi.org/10.1007/s10640-018-0244-x.
BioCycle. 2023. 2023 BioCycle Residential Food Waste Collection Access Study. Industry Report. https://www.biocycle.net/residential-food-waste-collection-access-in-u-s.
Blaine, T.W., F.R. Lichtkoppler, K.R. Jones, and R.H. Zondag. 2005. An assessment of household willingness to pay for curbside recycling: A comparison of payment card and referendum approaches. Journal of Environmental Management 76(1):15–22.
Bond, C. 2017. “Preparing Newsprint for Bedding.” Ohioline, Ohio State University Extension.
Boyer, R.H., A.D. Hunka, M. Linder, K.A. Whalen, and S. Habibi. 2021. Product labels for the circular economy: Are customers willing to pay for circular? Sustainable Production and Consumption 27:61–71.
Bucciol, A., N. Montinari, and M. Piovesan. 2015. Do not trash the incentive! Monetary incentives and waste sorting. Scandinavian Journal of Economics 117(4):1204–1229.
Burn., S. 2006. Social psychology and the stimulation of recycling behaviors: The Block Leader Approach. Journal of Applied Social Psychology 21(8):611–629. http://dx.doi.org/10.1111/j.1559-1816.1991.tb00539.x.
CalRecycle. 2025. Accurate Recycling Labels. https://calrecycle.ca.gov/wcs/recyclinglabels.
Caplan, A.J., T.C. Grijalva, and P.M. Jakus. 2002. Waste not or want not? a contingent ranking analysis of curbside waste disposal options. Ecological Economics 43(2–3):185–197.
Carson, R.T. 2012. Contingent valuation: A practical alternative when prices aren’t available. Journal of Economic Perspectives 26(4):27–42. https://doi.org/10.1257/jep.26.4.27.
Cecot, C., and W.K. Viscusi. 2022. The hierarchy and performance of state recycling and deposit laws. Vermont Journal of Environmental Law 23(4):319–348. https://irp.cdn-website.com/ee52edf5/files/uploaded/Cecot%26Viscusi_State%20Recycling%20and%20Deposit%20Laws%5B29%5D.pdf.
Champine, V.M., M.S. Jones, and R.M. Niemiec. 2023. Encouraging social diffusion of pro‐environmental behavior through online workshop‐based interventions. Conservation Science and Practice 5(10):e13016.
Chowkwanyun, M. 2023. Environmental justice: Where it has been, and where it might be going. Annual Review of Public Health 44(1):93–111.
City of Champaign. 2025. Champaign environmental sustainability/recycling. Public Works Department. https://champaignil.gov/public-works/recycling.
Corona Insights. 2020. Public Opinion Surrounding Plastic Consumption and Waste Management of Consumer Packaging. https://www.merkley.senate.gov/wp-content/uploads/imo/media/doc/Public%20Opinion%20Research%20to%20WWF%202021.pdf.
Dauvergne, P., and G. LeBaron. 2013. The social cost of environmental solutions. New Political Economy 18(3):410–430. https://doi.org/10.1080/13563467.2012.740818.
Deeney, M., R. Green, X. Yan, C. Dooley, J. Yates, H.B. Rolker, and S. Kadiyala. 2023. Human health effects of recycling and reusing food sector consumer plastics: A systematic review and meta-analysis of life cycle assessments. Journal of Cleaner Production 397:136567. https://doi.org/10.1016/j.jclepro.2023.136567.
Dijkgraaf, E., and R. Gradus. 2017. An EU recycling target: What does the Dutch evidence tell us? Environmental and Resource Economics 68(3):501–526. https://doi.org/10.1007/s10640-016-0027-1.
Donato, C., and F. Adıgüzel. 2022. Visual complexity of eco-labels and product evaluations in online setting: is simple always better? Journal of Retailing and Consumer Services 67:102961.
Douglas, I. 2012. Urban ecology and urban ecosystems: Understanding the links to human health and well-being. Current Opinion in Environmental Sustainability 4(4):385–392. https://doi.org/10.1016/j.cosust.2012.07.005.
Earth911. 2018. Survey Results: How Much Time Do You Spend Recycling? - Earth911 %. https://earth911.com/survey/survey-results-time-spent-recycling.
EPA (U.S. Environmental Protection Agency). 1974. Analysis of Source Separate Collection of Recyclable Solid Waste-Collection Center Studies.
EPA. 2001. Risk assessment guidance for Superfund. Human Health Evaluation Manual. Part D, Standardized Planning, Reporting, and Review of Superfund Risk Assessment. Final Publication 9285.7-47.
EPA. 2016. Public Participation and Citizen Action. https://archive.epa.gov/epawaste/hazard/web/html/index-46.html.
EPA. 2023. Green Guides Review, Matter No. P954501. U.S. Environmental Protection Agency Comments on the Federal Trade Commission’s Proposed Rule entitled “Guides for the Use of Environmental Marketing Claims,” April 20, 2023. FTC-2022-0077-1366_attachment_1.pdf.
European Commission. 2025. “European Pillar of Social Rights.” Employment, Social Affairs and Inclusion. https://employment-social-affairs.ec.europa.eu/policies-and-activities/european-pillar-social-rights-building-fairer-and-more-inclusive-european-union_en.
Fischhoff, B., D. Riley, D.C. Kovacs, and M. Small. 1998. What information belongs in a warning? Psychology & Marketing 15(7):663–686.
Folz, D.H., and J.M. Hazlett. 1990. A national survey of local government recycling. Resource Recycling 82–85.
Freudenburg, W.R. 1986. Social impact assessment. Annual Review of Sociology 12(1):451–478.
Fullerton, D., and T.C. Kinnaman. 1995. Garbage, recycling, and illicit burning or dumping. Journal of Environmental Economics and Management 29(1):78–91. https://doi.org/10.1006/jeem.1995.1032.
Fullerton, D., and W. Wu. 1998. Policies for green design. Journal of Environmental Economics and Management 36(2):131–148. https://doi.org/10.1006/jeem.1998.1044.
Geiger, J., L. Steg, E. van de Werff, and A.B. Unal. 2019. A meta-analysis of factors related to recycling. Journal of Environmental Psychology 64:78–97. https://doi.org/10.1016/j.jenvp.2019.05.004.
Gionfriddo, G., and A. Piccaluga. 2024. “Startups’ contribution to SDGs: A tailored framework for assessing social impact.” Journal of Management and Organization 30(3):545–573. https://doi.org/10.1017/jmo.2024.3.
Gradus, R., G.C. Homsy, L. Liao, and M.E. Warner. 2019. Which US municipalities adopt pay-as-you-throw and curbside recycling? Resources, Conservation and Recycling 143:178–183. https://doi.org/10.1016/j.resconrec.2018.12.012.
Hafsa, F., K.J. Dooley, G. Basile, and R. Buch, R. (2022). A typology and assessment of innovations for circular plastic packaging. Journal of Cleaner Production 369:133313.
Hage, O., K. Sandberg, P. Söderholm, and C. Berglund. 2018. The regional heterogeneity of household recycling: A spatial-econometric analysis of Swedish plastic packing waste. Letters In Spatial and Resource Sciences 11:245–267.
Hahladakis, J. N., P. Purnell, E. Iacovidou, C.A. Velis, and M. Atseyinku. 2018. Post-consumer plastic packaging waste in England: Assessing the yield of multiple collection-recycling schemes. Waste Management 75:149–159.
Hamilton County Environmental Services. n.d. https://hamiltoncountyresource.org/residents/what_can_i_recycle.php.
Haregu, T.N., A.K. Ziraba, and B. Mberu. 2016. A review and framework for understanding the potential impact of poor solid waste management on health in developing countries. Archives of Public Health 74(1):54. https://doi.org/10.1186/s13690-016-0166-4.
Harrison, E., A. Berenjian, and M. Seifan. 2020. Recycling of waste glass as aggregate in cement-based materials. Environmental Science & Ecotechnology 4:100064.
Heiman, M.K. 1996. Race, waste, and class: New perspectives on environmental justice. Antipode 28(2):111–121.
Hewitt, E.L., Y. Wang, A.S. Eck, and D.J. Tonjes. 2023. Keeping up with my neighbors: The influence of social norm feedback interventions on recycling behavior in urban multifamily buildings. Resources, Conservation and Recycling Advances 18:200156.
Hird, M.J. 2022. A Public Sociology of Waste. 1st ed. Bristol: University Press.
Horner, D., N. Fitzpatrick, T. Ivacko, and J. Berger. 2022a. Recycling Issues, Policies, and Practices among Michigan Local Governments. The Center for Local, State, and Urban Policy. https://closup.umich.edu/michigan-public-policy-survey/98/recycling-issues-policies-and-practices-among-michigan-local-governments.
Horner, D., N. Fitzpatrick, and T. Ivacko. 2022b. Michigan local leaders’ views on recycling: Current challenges and opportunities for improvement. The Center for Local, State, and Urban Policy. https://closup.umich.edu/michigan-public-policy-survey/99/michigan-local-leaders-views-recycling-current-challenges-and-opportunities#embed.
Horner, D., N. Fitzpatrick, and T. Ivacko. 2023. Michigan local leaders report widespread support for community recycling programs. The Center for Local, State, and Urban Policy. https://closup.umich.edu/michigan-public-policy-survey/111/michigan-local-leaders-report-widespread-support-community-recycling-pro grams.
Huber, J., W.K. Viscusi, and J. Bell. 2023. Using objective characteristics to target household recycling policies. Environmental Law Reporter 53:10804.
Jacobsen, L.F., S. Pedersen, and J. Thogersen. 2022. Drivers of and barriers to consumers’ plastic packaging waste avoidance and recycling—A systematic literature review. Waste Management 141:763–789. https://doi.org/10.1016/j.wasman.2022.01.021.
Jakus, P.M., K.H. Tiller, and W.M. Park. 1996. Generation of recyclables by rural households. Journal of Agricultural and Resource Economics 96–108.
Jena, L., and M.M. Ahmed. 2024. Integrating Innovative Sustainability Practices for Public Health, Economic Benefits, and Community Well-Being. http://junikhyatjournal.in/no_1_Online_24/37_online_july.pdf.
Johnson, C.Y., J.M. Bowker, and H.K. Cordell. 2004. Ethnic variation in environmental belief and behavior: An examination of the new ecological paradigm in a social psychological context. Environment and Behavior 36(2):157–186. https://doi.org/10.1177/0013916503251478.
Kass, M. 2024. “First-of-its-kind plastics recycling microfactory to transform waste, create new jobs.” ASU News, 2024. https://news.asu.edu/20240207-environment-and-sustainability-firstofitskind-plastics-recycling-microfactory-transform.
Kinnaman, T.C. 2000. Explaining the growth in municipal recycling programs: The role of market and nonmarket factors. Public Works Management and Policy 5(1):37–51.
Kinnaman, T.C., and D. Fullerton, D. 2000. The economics of residential solid waste management. In H. Folmer and T. Tietenberg (eds.), The International Yearbook of Environmental and Resource Economics 2000/2001. Cheltenham, UK: Edward Elgar.
Klaiman, K., D.L. Ortega, and C. Garnache. 2017. Perceived barriers to food packaging recycling: Evidence from a choice experiment of US consumers. Food Control 73:291–299.
Lakhan, C. 2016. Effectiveness of recycling promotion and education initiatives among first-generation ethnic minorities in Ontario, Canada. Social Sciences 5(2):23.
Lee, S. 2023. “The Benefits and Costs of a Small Food Waste Tax and Implications for Climate Change Mitigation.” https://harris.uchicago.edu/files/seunghoon_lee_jmp_foodwaste_sl.pdf.
Link, T., and B. Stoke. 2011. “Intervening in the Rural and Small Community Waste Reduction System,” Circular Economies. https://ced.msu.edu/upload/%5Bada%5DFinal%20CERI%20Report%201-19-22.pdf.
Lintz, G. 2016. A conceptual framework for analysing inter-municipal cooperation on the environment. Regional Studies 50(6):956–970. https://doi.org/10.1080/00343404.2015.1020776.
Ma, J. and K.W. Hipel. 2016. Exploring social dimensions of municipal solid waste management around the globe—A systematic literature review. Waste Management 56:3–12. https://doi.org/10.1016/j.wasman.2016.06.041.
Marc, M., and N. Ponikvar. 2022. How to measure our impact on society: An illustration of social impact analysis. Dynamic Relationships Management Journal 11(2):79–96.
Martuzzi, M., F. Mitis, and F. Forastiere. 2010. Inequalities, inequities, environmental justice in waste management and health. European Journal of Public Health 20(1):21–25.
McKenzie-Mohr, D. 2011. Fostering sustainable behavior: An introduction to community-based social marketing. New Society Publishers.
McKie, E.C., A. Chandrasekaran, and S. Venkataraman. 2024. How do curbside feedback tactics impact households’ recycling performance? Evidence from community programs. Production and Operations Management 33(5):1064–1082.
McKinsey & Company. 2020. Sustainability in packaging: US survey insights https://www.mckinsey.com/industries/packaging-and-paper/our-insights/sustainability-in-packaging-us-survey-insights.
Miafodzyeva, S., and N. Brandt. 2013. Recycling behaviour among householders: Synthesizing determinants via a meta-analysis. Waste Biomass Valorization 4:221–235. https://doi.org/10.1007/s12649-012-9144-4.
Michaud, C., and D. Llerena. 2011. Green consumer behaviour: An experimental analysis of willingness to pay for remanufactured products. Business Strategy and the Environment 20(6):408–420. https://doi.org/10.1002/bse.703.
Morris, J., and C. Morawski. 2011. Returning to Work: Understanding the Domestic Jobs Impacts from Different Methods of Recycling Beverage Containers. https://cooplesvaloristes.ca/v2/wp-content/uploads/2015/04/returning-to-work.pdf.
Murphy, B. 2010. Community Well-Being: An Overview of the Concept. https://www.nwmo.ca/-/media/Reports--Reports/1681_researchsupportprogram_communitywellbeingoverview.ashx?rev=4e4609ae66c4488ebb6fbb2601c143a7&sc_lang=en.
NRC (National Research Council). 2002. New Tools for Environmental Protection, Education, Information, and Voluntary Measures. Washington, DC: The National Academies Press.
Niemiec, R., M.S. Jones, S. Lischka, and V. Champine. 2021. Efficacy‐based and normative interventions for facilitating the diffusion of conservation behavior through social networks. Conservation Biology 35(4):1073–1085.
Nixon, H., and J.-D. Saphores. 2009. Information and the decision to recycle: Results from a survey of US households. Journal of Environmental Planning and Management 52:257–277. https://doi.org/10.1080/09640560802666610.
Oates, C.J., and S. McDonald. 2006. Recycling and the domestic division of labour: Is green pink or blue? Sociology 40(3):417–433. https://doi.org/10.1177/0038038506063667.
Oldenburg, R. 1989. The Great Good Place: Cafés, Coffee Shops, Community Centers, Beauty Parlors, General Stores, Bars, Hangouts, and How They Get You Through the Day. Paragon House.
Oliveira, V., V. Sousa, J.M. Vaz, and C. Dias-Ferreira. 2018. Model for the separate collection of packaging waste in Portuguese low-performing recycling regions. Journal of Environmental Management 216:13–24.
Owens, J., S. Dickerson, and D.L. Macintosh. 2000. Demographic covariates of residential recycling efficiency. Environment and Behavior 32(5):637–650. https://doi.org/10.1177/00139160021972711.
Palmer, K., and M. Walls. 1997. Optimal policies for solid waste disposal: Taxes, subsidies, and standards. Journal of Public Economics 65(2):193–205. https://doi.org/10.1016/S0047-2727(97)00028-5.
Perni, Á., J. Barreiro-Hurlé, and J.M. Martínez-Paz. Contingent valuation estimates for environmental goods: Validity and reliability. Ecological Economics 189(2021):107144.
Petts, J. 2000. Municipal waste management: Inequities and the role of deliberation. Risk Analysis 20(6):821–832. https://doi.org/10.1111/0272-4332.206075.
Pew Research Center. 2016. Perceptions and realities of recycling vary widely from place to place. https://www.pewresearch.org/short-reads/2016/10/07/perceptions-and-realities-of-recycling-vary-widely-from-place-to-place.
Pretner, G., N. Darnall, F. Iraldo, and F. Testa. 2021. Are consumers willing to pay for circular products? The role of recycled and second-hand attributes, messaging, and third-party certification. Resources, Conservation and Recycling 175. https://doi.org/10.1016/j.resconrec.2021.105888.
Pyzyk, K. 2019. “Robots Move In.” Recycling Labor Series. https://www.wastedive.com/news/recycling-labor-mrf-robots-move-in/568554.
Recycled Materials Association. 2014. Younger Americans Not as “Green” as Older Generations. Younger Americans Not as “Green” as Older Generations. ReMA.
Recycling Partnership. 2022. 2022 Foundational Audience Segmentation Research. https://recyclingpartnership.org/wp-content/uploads/dlm_uploads/2023/06/Audience_Segmentation_Report_Final.pdf.
Recycling Partnership. 2023. Consumer Research on Recycling Behavior and Attitudes Regarding On-Pack Labeling. https://recyclingpartnership.org/consumer-research-on-recycling-behavior-and-attitudes-regarding-on-pack-labeling.
Recycling Partnership. 2024. State of Recycling: The present and future of Residential Recycling in the U.S. https://recyclingpartnership.org/wp-content/uploads/dlm_uploads/2024/01/Recycling-PartnershipState-of-Recycling-Report-1.12.24.pdf.
Regadío, M., A.I. Ruiz, I.S. de Soto, M. Rodriguez Rastrero, N. Sánchez, M.J. Gismera, M.T. Sevilla, P. da Silva, J.R. Procopio, and J. Cuevas. 2012. Pollution profiles and physicochemical parameters in old uncontrolled landfills. Waste Management 32(3):482–497. https://doi.org/10.1016/j.wasman.2011.11.008.
Reputation Leaders. 2023. Recycling is too much effort for many Americans. https://www.reputationleaders.com/media/zerowaste2023.
Reschovsky, J.D., and S.E. Stone. 1994. Market incentives to encourage household waste recycling: Paying for what you throw away. Journal of Policy Analysis and Management 13(1):120–139.
Schaumberg, G.W., Jr., and K.T. Doyle. 1994. Wasting resources to reduce waste: Recycling in New Jersey (Policy Analysis No. 202). Washington, DC: Cato Institute.
Schäufele-Elbers, I., G. Schamel, and M. Perathoner. 2024. Nudging food waste off the plate? An explorative study investigating the generation of plate waste over time and the effectiveness of information nudges to bridge the attitude-behavior gap. Journal of Foodservice Business Research 1–19.
Schultz, P. W., S. Oskamp, and T. Mainieri, T. 1995. Who recycles and when? A review of personal and situational factors. Journal of Environmental Psychology 15(2):105–121.
Sharma, H.B., K.R. Vanapalli, B. Samal, et al. 2021. Circular economy approach in solid waste management system to achieve UN-SDGs: Solutions for Post-COVID recovery. Science of the Total Environment. https://www.ncbi.nlm.nih.gov/pmc/articles/PMC9622352.
Shaw, B., J. Resick, and J. Van Rossum. 2014. Research Review of Best Practices in Campaigns to Promote Recycling, Report for the Wisconsin Recycling and Waste Management Program Leaders. https://dnr.wisconsin.gov/sites/default/files/topic/Recycling/RecyclingBestPracticesWISummary.pdf.
Sidique, S.F., S.V. Joshi, and F. Lupi. 2010. Factors influencing the rate of recycling: An analysis of Minnesota counties. Resources, Conservation and Recycling 54(4):242–249. https://doi.org/10.1016/j.resconrec.2009.08.006.
Small, K. 2013. Urban Transportation Economics. Routledge.
Starr, J., and C. Nicolson. 2015. Patterns in trash: Factors driving municipal recycling in Massachusetts. Resources, Conservation and Recycling 99:7–18. https://doi.org/10.1016/j.resconrec.2015.03.009.
State of Minnesota. 2025. By its Attorney General, Keith Ellison, v. Reynolds Consumer Products, Inc., Reynolds Consumer Products, LLC, & Walmart Inc., No. 62-CV-23-3104 (Minn. Dist. Ct. 2024). Plastics Litigation Tracker. https://plasticslitigationtracker.org/?keywords=No.+62-CV-23-310.
Sustainable Packaging Coalition. 2021. 2020–21 centralized study on availability of recycling. Industry report. https://sustainablepackaging.org/wp-content/uploads/2022/03/UPDATED-2020-21-Centralized-Study-on-Availability-of-Recycling-SPC-3-2022.pdf.
Tiller, K.H., P.M. Jakus, and W.M. Park. 1997. Household willingness to pay for drop off recycling. Journal of Agricultural and Resource Economics 22(2):310–320.
UN (United Nations). 2025. Sustainable Development Goals. Department of Economic and Social Affairs. https://sdgs.un.org/goals.
U.S. Bureau of Labor Statistics. 2024. Average hourly and weekly earnings of all employees on private nonfarm payrolls by industry sector, seasonally adjusted (Table B-3). https://www.bls.gov/news.release/empsit.t19.htm.
van Velzen, E.T., M.T. Brouwer, and A. Feil. 2019. Collection behavior of lightweight packaging waste by individual households and implications for the analysis of collection schemes. Waste Management 89:284–293.
Varotto, A., and A. Spagnolli. 2017. Psychological strategies to promote household recycling. A systematic review with meta-analysis of validated field interventions. Journal of Environmental Psychology 51:168–188. https://doi.org/10.1016/j.jenvp.2017.03.011.
Vhowkwanyun, M. 2023. Environmental justice: Where it has been, and where it might be going. Annual Review of Public Health 44:93–111.
Viscusi, W.K., J. Huber, and J. Bell. 2022. Quasi-experimental evidence on the impact of state recycling and deposit laws: Household recycling following interstate moves. American Law and Economics Review 24(2):614–658. https://doi.org/10.1093/aler/ahac006.
Viscusi, W.K., J. Huber, and J. Bell. 2023. Changes in household recycling behavior: Evidence from panel data. Ecological Economics 208:107819.
Vollaard, B., and D. van Soest. 2024. Punishment to promote prosocial behavior: A field experiment. Journal of Environmental Economics and Management 124:102899. https://doi.org/10.1016/j.jeem.2023.102899.
White House. 2024. National Strategy for Reducing Food Loss and Waste and Organic Recycling. https://www.whitehouse.gov/wp-content/uploads/2024/06/national-strategy-for-reducing-food-loss-and-waste-and-recycling-organics_6.11.24.pdf.
WHO (World Health Organization). 2023. Assessing the health impacts of waste management in the context of the circular economy. https://apps.who.int/iris/handle/10665/366667.
Wiedemann, P.M., and S. Femers. 1993. Public participation in waste management decision making: Analysis and management of conflicts. Journal of Hazardous Materials 33(3):355–368. https://doi.org/10.1016/0304-3894(93)85085-S.
Willman, K.W. 2015. Information sharing and curbside recycling: A pilot study to evaluate the value of door-to-door distribution of informational literature. Resources, Conservation and Recycling 104:162–171.
Winterich, K.P., G.Y. Nenkov, and G.E. Gonzales. 2019. Knowing what it makes: How product transformation salience increases recycling. Journal of Marketing 83(4):21–37.
Wood From the Hood. 2024. Reclaimed Wood Minneapolis. Wood From the Hood. https://woodfromthehood.com.
World Economic Forum. 2021. The Climate Progress Survey: Business & consumer worries & hopes. https://www3.weforum.org/docs/SAP_WEF_Sustainability_Report.pdf.


