Municipal Solid Waste Recycling in the United States: Analysis of Current and Alternative Approaches (2025)
Chapter: 5 Materials and Markets
5
Materials and Markets
Summary of Key Messages
- Commonly recycled materials: Most U.S. communities focus on recycling plastics, paper, cardboard, glass, and metals.
- Managing food and yard waste: Some states prohibit the landfilling of yard waste and have mandatory recycling policies for these materials. Municipal solid waste authorities have increasing interest in managing these materials through composting and anaerobic digestion. While these management strategies deliver high environmental benefits through the reduction of greenhouse gas emissions, separate collection present challenges.
- Variability in recycling efficiency: Recycling rates vary significantly across the United States, with some cities achieving higher efficiency due to mandates, specialized programs, effective education and enforcement, and focused public policies. These efforts demonstrate the potential for recycling efficiency to surpass national averages through targeted local actions.
- Importance of reducing contamination: Contamination in recycling streams hinders the economic and environmental effectiveness of recycling systems; reducing contamination is a critical focus for national recycling strategies.
- Challenges in recycling plastics: Recycling plastics is important because of their persistence in the environment, their generation from non-renewable sources, their contribution to litter problems, and more. However, their recycling rates are low, partly because only certain resin types are accepted for recycling (as influenced by market demand and technological limitations).
- Role of end markets: End markets play a critical role in sustaining recycling systems, with cardboard and high-value materials such as metals and HDPE and PET plastics contributing the most reliable revenues.
- Global recycling markets: Global market shifts, such as China’s import bans on recyclables have reshaped global recycling markets, exposed the need for resilient domestic markets, and led to increased recycling capacity and market development in the United States.
This chapter explores the various materials commonly accepted for recycling that are within the committee’s scope of task, and it identifies relevant issues that are unique or specific to individual materials. It also builds on previous chapters’ discussions of end markets, which are critical to an effective recycling system, and outlines various public policies relevant to enhancing those markets.
5.1 RECYCLING RATES
In the United States, most communities focus on five material types collected curbside or at drop-off centers and processed at materials recovery facilities (MRFs): plastics, paper, cardboard, glass, and metals (ferrous and aluminum). Less commonly collected are food and yard wastes, which can be managed through composting or anaerobic digestion. Industry plays an important role by collecting and recycling some of its own materials. Understanding the materials accepted by MRFs across the country, and the rates at which those materials are collected, is complicated because of a lack of standardized reporting; see Box 5-1 for legislation proposed to address these issues.
BOX 5-1
Recycling and Composting Accountability Act
The Recycling and Composting Accountability Act (S. 3743) is aimed at strengthening recycling and composting systems across the United States through enhanced data collection, standardized reporting, and actionable analysis for policymakers and stakeholders. Passed by the Senate in July 2022 with support from 11 cosponsors (5 Democratic, 5 Republican, and 1 Independent), the act directs the U.S. Environmental Protection Agency (EPA) to evaluate the nation’s recycling and composting infrastructure, establish baseline metrics, and provide comprehensive reports on material recovery. These measures seek to address existing inefficiencies, improve transparency, and guide improvements in waste management practices.
Central to the act is a focus on improving data reporting. It tasks EPA with creating detailed inventories of public and private materials recovery facilities, cataloging the types of materials—such as plastics, paper, metals, and glass—that each facility can process. This initiative provides a clearer picture of the national recycling landscape, highlighting gaps in infrastructure and opportunities for optimization. Furthermore, the act mandates the standardization of recycling and composting rate reporting across states, ensuring consistent and comparable data nationwide. These standardized metrics will help reduce confusion about recycling and composting capabilities and improve the ability of local and federal agencies to make data-driven decisions.
The act also emphasizes the development of metrics for contamination and capture rates within recycling systems. By identifying inefficiencies in material processing and recycling outcomes, these metrics will guide targeted improvements in collection, sorting, and recycling practices. This data-centric approach will enable federal, state, local, and tribal governments to enhance the efficiency and effectiveness of recycling systems, ultimately reducing contamination and promoting a more sustainable use of resources. By prioritizing comprehensive and consistent data collection, the act lays the groundwork for informed policymaking that supports both environmental and economic goals.
SOURCE: Recycling and Composting Accountability Act, S. 3743, 117th Congress (2022), see https://www.congress.gov/bill/117th-congress/senate-bill/3743/text.
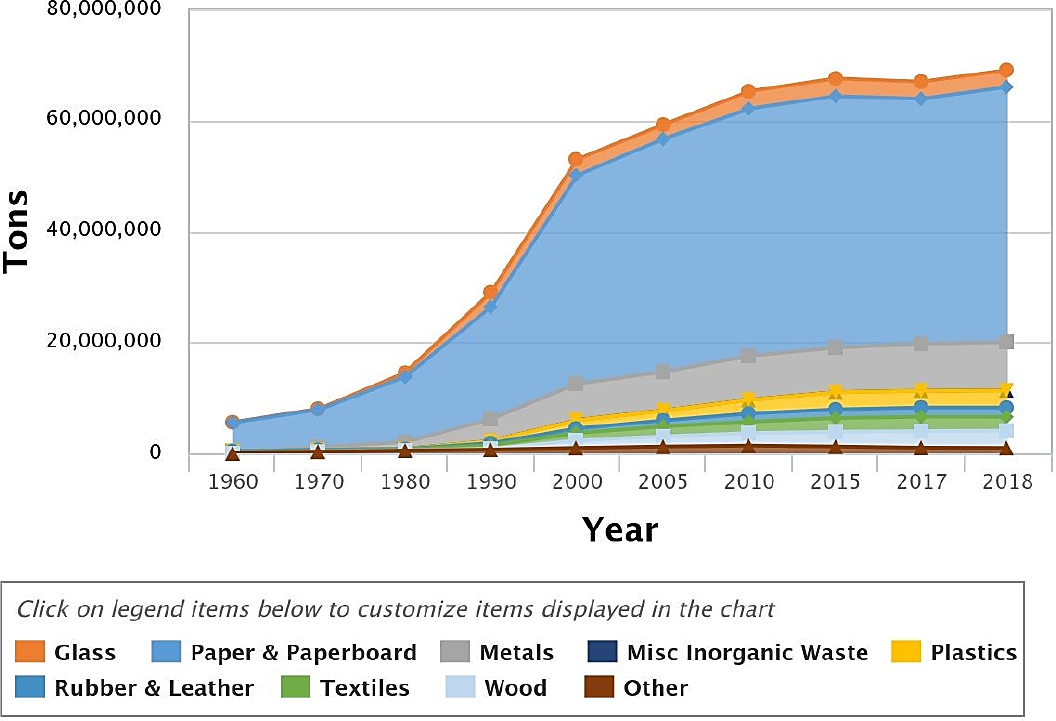
Absent standardized reporting, data on national collection and processing of recyclables are updated rarely. The most recent data were published in 2020 and reflect estimates of diversion in 2018 (see Figure 5-1 and Table 5-1; EPA, 2020). Figure 5-1 shows the amount of material recycled rose rapidly in the 1990s and early 2000s but has risen much more slowly since.
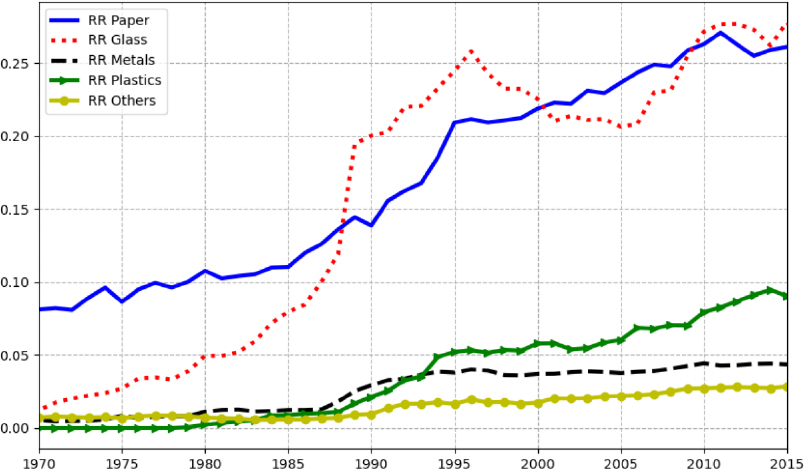
In addition to total recycling material tonnages, efforts have been made to calculate recycling rates for different materials over time. As displayed in Figure 5-1B, Arbex and Mahone (2024) use data from the U.S. EPA, together with material flow accounts, which track economy-wide material use (Eurostat, 2018), to calculate an overall recycling rate for recycled materials from 1970-2015. While recycling rates for materials differ, all materials display an increase in recycling rate during this time. Recent changes in recycling may be explained by a combination of technical factors such as differences in the inherent flexibility of materials for sorting and reuse, and economic and regulatory factors affecting waste processor costs and consumer preferences (Bening et al., 2021; Butler and Hooper, 2005; Le Pera et al., 2023).
In Figure 5-1, the tonnages for all recycling categories increase over the entire 50-year period, but the largest tonnage in all those years is for “paper and paperboard.” The next largest tonnage across this period is for “metals.” Interestingly, Figure 5-1 shows that tonnages for the glass category remain small relative to the others, but Figure 5-2 shows that the recycling rate for glass has increased more than any other category. The recycling rate for plastics started small but has increased somewhat more than the increase for metals. These recycling rates are each an average across the country, so they understate rates for individual materials currently recycled in locations such as cities that invest heavily in recycling (see Box 5-2).
SOURCE: EPA, 2020.
To help understand these trends in recycling tonnages and recycling rates, we might like to see trends in total recycling expenditures by government. However, most local governments report total MSW expenditures, and do not break down collection of garbage for the landfill and other collection for recycling. In general, recycling might be an increasing fraction of total MSW expenditures, but it is difficult to determine how much that share has increased. Thus, recycling expenditures cannot be shown for the several time-trends in Figure 5-3. However, the dark blue trend does show total U.S. MSW expenditures as a fraction of gross domestic product (GDP). That ratio doubles from 100 percent of its 1970 level to 200 percent of that level in 1992 and then levels off until 1995, before falling steadily thereafter. In other words, after 1995, any growth in MSW expenditures was exceeded by overall growth in GDP. This decline in relative MSW spending may or may not partially explain the slowdown in growth of the overall recycling rate (shown in the orange trend line for the aggregate of all materials in the previous figure).
Another influence on recycling tonnages or recycling rates over this period might be changes in prices, so Figure 5-3 also shows a time-trend for the prices paid by firms for recycled materials (in light blue) and for the price of virgin materials (in green). For average recycled materials prices, data are not available until 1990 and then unavailable again in 1997 and 1998. These prices are highly volatile, though they end in 2015 somewhat higher than in 1990. In contrast, the price for virgin materials bounces up and down across the entire period, but it falls by 2015 to about 70 percent of its 1970 level. That price decline is only partly explained by recent reductions in prices for petrochemicals used to make plastic.
TABLE 5-1 Recycling Tonnages in the United States, 1960–2018
| Recycled | 1960 | 1970 | 1980 | 1990 | 2000 | 2005 | 2010 | 2015 | 2017 | 2018 |
|---|---|---|---|---|---|---|---|---|---|---|
| Paper and Paperboard | 5,080 | 6,770 | 11,740 | 20,230 | 37,560 | 41,960 | 44,570 | 45,320 | 44,170 | 45,970 |
| Glass | 100 | 160 | 750 | 2,630 | 2,880 | 2,590 | 3,130 | 3,190 | 3,070 | 3,060 |
| Metals | ||||||||||
| Ferrous | 50 | 150 | 370 | 2,230 | 4,680 | 5,020 | 5,800 | 6,070 | 6,170 | 6,360 |
| Aluminum | Neg. | 10 | 310 | 1,010 | 860 | 690 | 680 | 670 | 600 | 670 |
| Other Nonferrous | Neg. | 320 | 540 | 730 | 1,060 | 1,280 | 1,440 | 1,290 | 1,710 | 1,690 |
| Total Metals | 50 | 480 | 1,220 | 3,970 | 6,600 | 6,990 | 7,920 | 8,030 | 8,480 | 8,720 |
| Plastics | Neg. | Neg. | 20 | 370 | 1,480 | 1,780 | 2,500 | 3,120 | 3,000 | 3,020 |
| Rubber and Leather | 330 | 250 | 130 | 370 | 820 | 1,050 | 1,440 | 1,550 | 1,670 | 1,670 |
| Textiles | 50 | 60 | 160 | 660 | 1,320 | 1,830 | 2,050 | 2,460 | 2,570 | 2,510 |
| Wood | Neg. | Neg. | Neg. | 130 | 1,370 | 1,830 | 2,280 | 2,660 | 3,030 | 3,100 |
| Other | Neg. | 300 | 500 | 680 | 980 | 1,210 | 1,370 | 1,230 | 990 | 970 |
| Total MSW Recycled | 5,610 | 8,020 | 14,520 | 29,040 | 53,010 | 59,240 | 65,260 | 67,560 | 66,980 | 69,020 |
SOURCE: EPA, 2024a.
SOURCE: Arbex and Mahone, 2024.
As it turns out, the trends in recycling tonnages and rates cannot be explained either by changes in government MSW expenditures nor by these two price trends. This is because the time-trends are determined simultaneously by the same complicated economic influences. For example, an increase in economic growth could explain increased demand for virgin materials, but any resulting increase in price of virgin materials could shift some of that demand to recycled materials. That shift might increase recycling rates, with or without more MSW expenditures. The trends cannot readily be disentangled.
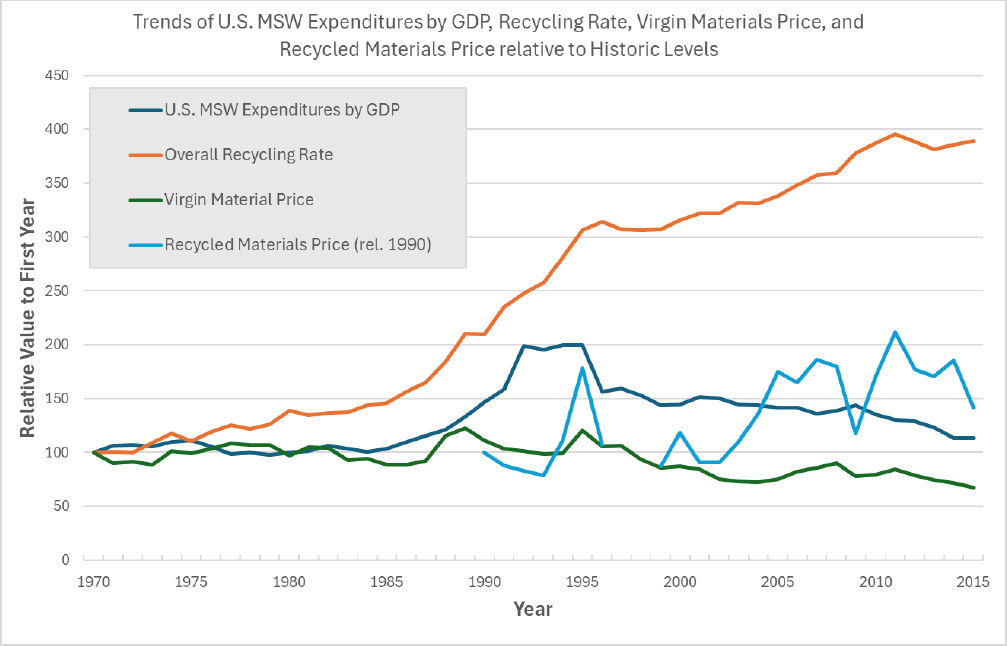
NOTES: The virgin material and recycled material prices have been corrected for inflation. Data on recycling materials price are not available prior to 1990, so subsequent years are shown relative to 1990.
SOURCE: Derived from Arbex and Mahone, 2024. MSW and recycling data primarily from EPA, and virgin material price primarily from Federal Reserve Economic Data.
BOX 5-2
Case Study: Recycling Excellence in the United States
Three U.S. cities report efficiency rates that far exceed national averages (see Table 5-2). These rates differ in part because some cities likely include a broader range of materials, including organic waste, particularly in cities such as Seattle, Washington, and Portland, Oregon. For example, Seattle’s 60 percent recycling rate reflects contributions from organics, as the city has local mandates for food waste separation. This material differs from the traditional recyclables highlighted in subsequent figures, which may not capture the same breadth of materials.
TABLE 5-2 Examples of Recycling Excellence in the United States
| Community | Reported Overall Recycling Rate | Tactics |
|---|---|---|
| Boulder, Colorado | 38% | 100% curbside collection, special event recycling, occupational trash tax, commercial recyclable separation |
| Seattle, Washington | 60% | Local food waste separation mandate, lower collection charges, variable garbage rates, recycling requirements |
| Portland, Oregon | 39% (statewide) | State mandates, supervised drop-off centers, recycling requirements, every-other-week garbage collection |
SOURCES: Generated by the committee with data from Brewer, 2025; ODEQ, 2024.
EPA (2020) estimated the financial benefits of recycling in terms of jobs (681,000 in 2012), wages ($37.8 billion), and tax revenues ($5.5 billion). Yet, according to The Recycling Partnership (2024), over 76 percent of residential recyclables are landfilled or incinerated. Part of the loss in recyclables can be attributed to the fact that only 85 percent of communities have curbside collection and 63 percent of multifamily communities have no access to recyclables collection for an overall access to recycling of 73 percent. Unfortunately, over 57 percent of households do not participate in recycling (for lack of access or interest), and the average MRF captures only 87 percent of its accepted recyclable materials. Therefore, The Recycling Project (2024) estimates that over 50 percent of recyclables from homes with curbside collection is landfilled or incinerated.
Efficient recycling has technical, behavioral, and economic barriers, and multiple challenges that include contamination of recycling streams, single-stream recyclable collection, limited access to recycling collection, failure to properly separate recyclables, and inefficient processing of recyclables at MRFs.
Contamination of materials in recycling bins and drop-off facilities reduces the economic benefits of recycling. EPA (2021) identified contamination reduction as a key element of its National Recycling Strategy. The Recycling Partnership (2020) estimates that nationally the contamination rate is 17 percent, but in some cases it may be as high as 50 percent (Runewese et al., 2020). Contamination can occur because of poor communication between municipalities and participants, confusion over what can be recycled, indifference to the environment, and “wish-cycling” (placing materials in bins that participants hope can be recycled).
The following sections discuss the collection and use of the five main materials collected for recycling, as well as food and yard waste.
5.1.1 Plastics
Plastic is a ubiquitous component because of its strength, low cost, durability, environmental benefits, and wide range of properties (Avery et al., 2025). Dozens of types of plastic resins are or have been in use (see Table 5-3). Most have single or short-term use and therefore routinely and quickly find their way into municipal solid waste (MSW) streams. The production of plastics consumes 6 percent of the world’s refined crude oil (Dal et al., 2022).
Although these resins are all types of plastic, each resin has different characteristics that are beneficial for different types of manufacturing and product uses. Different challenges also relate to recycling for each resin type. Thus, to be useful for manufacturing, plastic recyclables must be separated by resin type.
Although plastics make up only 12 percent of MSW generated in the United States, many people see it as the most problematic type for several reasons. Plastic has low density, so it represents a greater share of waste by volume than by mass. Plastic waste has especially high environmental costs because it is long lasting, highly visible in the environment as litter, and has recently been identified as the source of micro and nano plastic particles in the environment. Approximately 5 percent of plastic waste is managed inappropriately, harming marine and terrestrial life when animals become entangled in it or ingest it (NASEM, 2023). Micro and nano plastics have been found in every environment on earth and may harm human health.
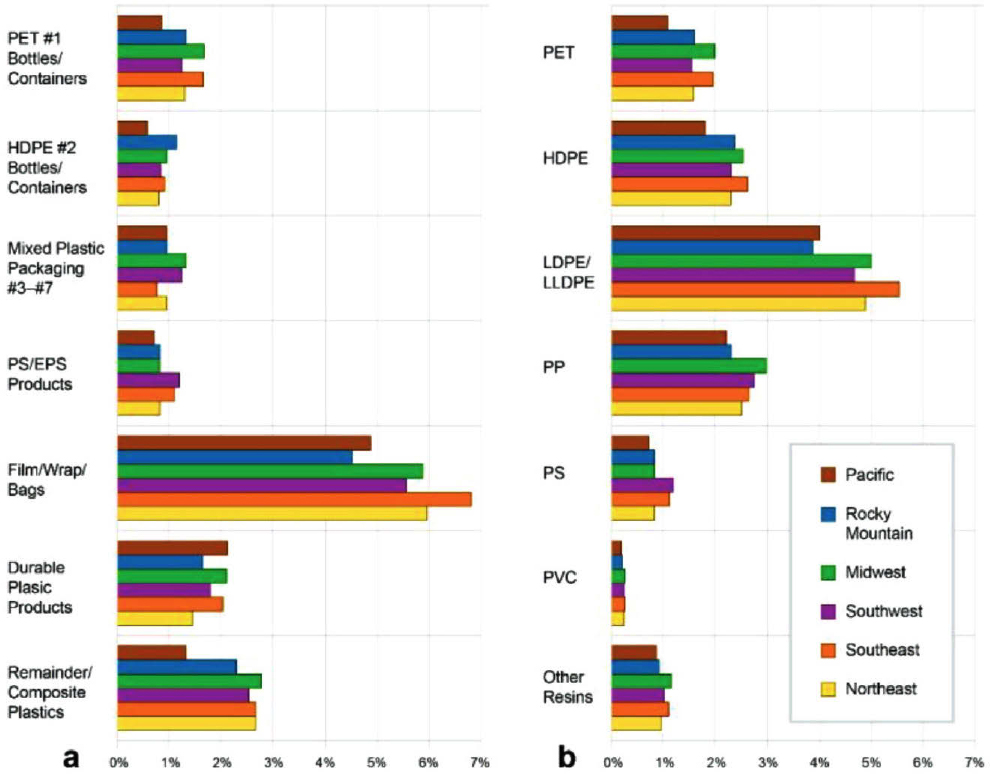
Some types of plastics are collected by almost every curbside recycling program. EPA (2024a) estimated that, in total, approximately 9 percent of plastic waste was recycled in 2018. Recycling of plastics avoids the consumption of energy and fossil fuels to produce virgin plastics. Figure 5-4 shows the breakdown of plastic waste by resin and product type as determined by Milbrandt (2022), who reported that 5 percent of plastics were recycled globally in 2019. Although most thermoplastics (plastics that can be remelted and molded into new plastics) can be recyclable, only resin numbers 1 and 2 are commonly collected in household curbside collection programs or at drop-off centers (see Table 5-3). Types 3–7 are considered hard to recycle, although interest is increasing among developing programs to manage these waste types. Film, wrap, and bags made of low-density polyethylene (LDPE) dominate plastic wastes, representing 5.8 percent of MSW by weight (Milbrandt, 2022; see Figure 5-2). LDPE is still poorly recycled because of the
high cost of processing and difficulty of processing for MRFs. However, the industry is investing in new sorting and recycling technologies that may help address these challenges.
TABLE 5-3 Resin Identification Codes
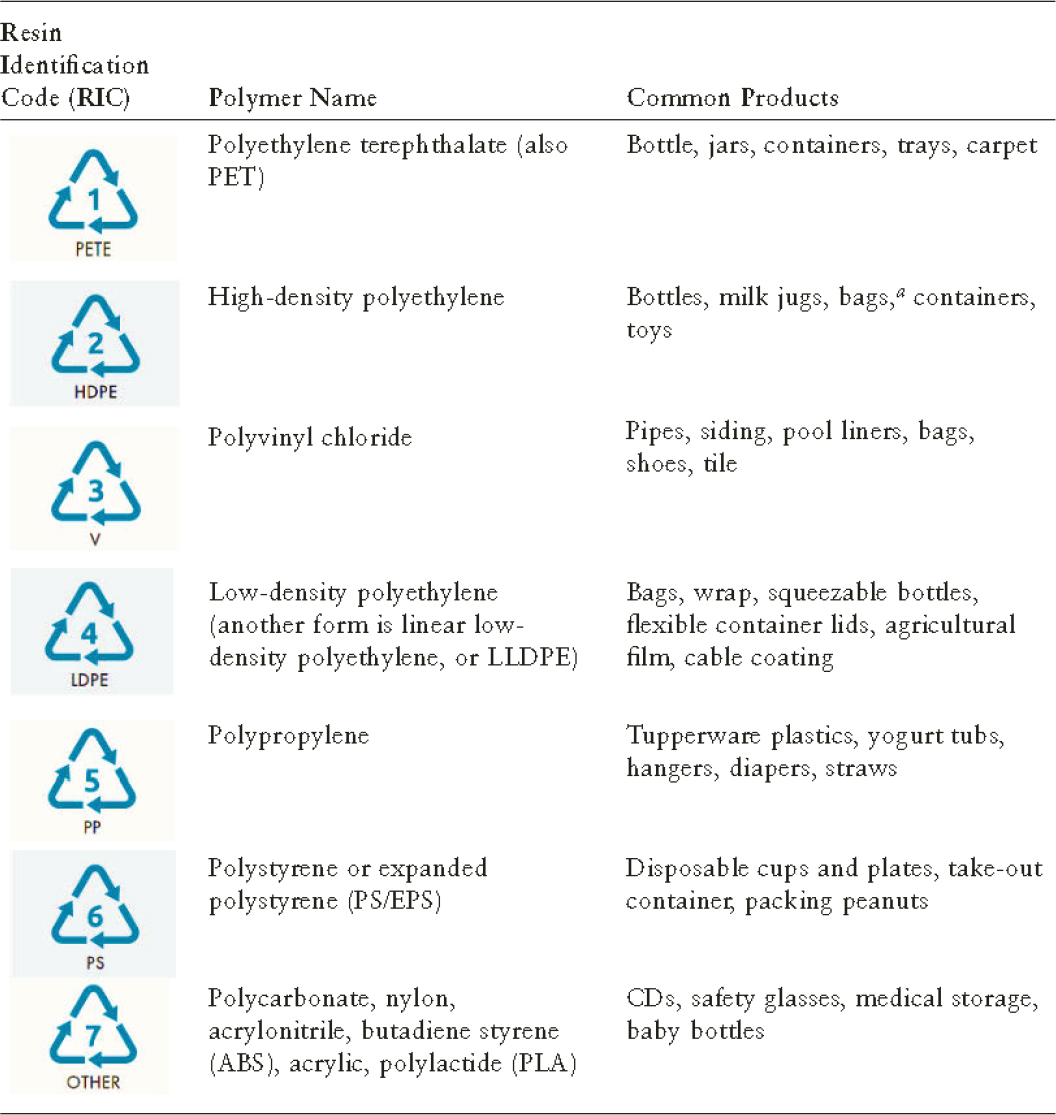
a Plastics bags are manufactured with HDPE, LDPE, and LLDPE. While most shopping bags (e.g., grocery store bags) are manufactured with HDPE, LDPE is typically used for tear-away dry cleaner bags, and LLDPE is used for heavier and thicker bags, for example those used by clothing stores.
SOURCES: ASTM, 2022; NASEM, 2023.
NOTE: EPS = expanded polystyrene (Styrofoam); HDPE = high-density polyethylene; LDPE = low-density polyethylene; LLDPE = linear low-density polyethylene; PET = polyethylene terephthalate; PS = polystyrene; PVC = polyvinyl chloride.
SOURCE: Milbrandt et al., 2022.
Milbrandt and colleagues (2022) also reported that about 86 percent of plastics was landfilled and 9 percent was combusted in the United States in 2019. Based on these data, the authors calculated the total mass of plastics landfilled as 44 million tons, representing $2.3 billion in value and 3.4 Ej (exajoule) of embodied energy (or 12 percent of the energy consumed by the industrial sector).
Since 2018, when EPA published its latest dataset regarding national waste generation and management, several confounding events have occurred. First, China banned imports of recyclables with its National Sword policy in 2018 (discussed further in later sections of this chapter). Nearly 3 million metric tons of U.S. recyclables (largely plastics and mixed paper) that would have been exported to China diverted elsewhere, often to landfills (Sigman and Strow, 2024) or to other countries, where they may have been mismanaged (Taylor et al., 2024).
Additionally, beginning in early 2020, the COVID-19 pandemic had multiple effects on MSW generation and recycling. As many people worked from home, waste from commercial businesses decreased, while household waste increased markedly. Plastic wastes increased because personal protection equipment (predominately gloves and masks) was discarded in large numbers. Take-out packaging also increased, as fewer families ate at restaurants (Olawade et al., 2024). Finally, online shopping grew to over 13 percent of U.S. commerce in 2020. E-commerce packaging can use up to 4.2 times the material of that used for
brick-and-mortar packaging (Kim et al., 2022), including paper bills, envelopes, cardboard, plastic bags, tape, protective bubble wrap, and Styrofoam. These factors have not been captured in national data yet. Estimates suggest increasing tonnages of plastic and reduced recycling since the start of the pandemic (OECD, 2022). See Box 5-3 for innovative packaging choices meant to increase recyclability.
BOX 5-3
Case Study: Navigating Recycling Challenges for Toothpaste Containers
Many toothpaste tubes are made from multilayered materials, including plastic and aluminum, which can complicate the recycling process. Some manufacturers, including Colgate, have introduced recyclable tubes made from high-density polyethylene. However, variability in municipal solid waste (MSW) recycling programs and unclear labeling can make it difficult for consumers to determine whether and how these items can be recycled.
Research has shown that uncertainty about recycling guidelines often leads consumers to discard recyclable materials in general waste (Schneller et al., 2023). Without consistent instructions or assurances that local facilities can process such items, consumers may dispose of the entire toothpaste container rather than attempt to separate recyclable components. Colgate’s “Recycle Me!” campaign aims to improve awareness about recyclable packaging (Colgate-Palmolive, 2022).
In addition to consumer education on proper disposal practices, the successful diversion of toothpaste containers from landfills depends on more uniform recycling systems.
SOURCES: Colgate-Palmolive, 2022; Schneller et al., 2023.
5.1.2 Paper and Cardboard
Keeping paper and cardboard out of landfills reduces greenhouse gas emissions. Paper and cardboard waste is a general category that captures multiple types of wood-derived fibrous materials, including newspapers, mechanical papers, directories, inserts, direct mail printing, and others. Almost every curbside recycling program collect materials in this category.
Recycling paper and cardboard reduces the demand for tree harvesting and requires less water and up to 40 percent less energy than production from virgin materials (Kumar, 2017). On the other hand, producing paper and cardboard from virgin pulp allows manufacturers to make nonfossil biofuels for heat and electricity, using pulp byproducts (bark, branches, and leaves).
Certain types of paper cannot currently be recycled, including napkins, tissues, paper towels, toilet paper, waxed paper, receipts and sticky paper/notes (note, however, that some can be composted). EPA (2024a) reported that more than 67.4 million tons of paper and paperboard (cardboard) were generated in 2018, and 68.2 percent was recycled, the highest product recycling rate measured. Estimates of more recent recycling rates from the American Forest & Paper Association (2025) are similar, with recycling of 65 to 69 percent of paper and 71 to 76 percent of cardboard. However, using a bottom-up rather than a top-down methodology, Milbrandt and colleagues (2024) found that 56 percent of paper and cardboard waste in the United States was landfilled, 6 percent combusted, and only 38 percent recycled. The difference in estimates derives from a larger estimate of paper and cardboard generation in the study by Milbrandt and colleagues than by EPA. Milbrandt and colleagues (2024) estimated that landfilled paper and paperboard could have generated $4 billion in end markets and embodied 2,158 joules of energy.
5.1.3 Metals
Metals in MSW are valuable commodities that are generally collected through curbside programs and received at drop-off or buy back centers. Most scrap metal, however, is not part of MSW but instead is generated from end-of-life vehicles and in various manufacturing facilities. EPA (2024a) reported that 25.6
million tons of metal waste (8.76 percent of MSW) were generated in 2018, of which 34 percent was recycled. Metal waste collected from households is primarily ferrous (steel, cast iron, wrought iron, carbon steel) (e.g., some food cans and small metal objects) and nonferrous (aluminum) (e.g., some beverage and food cans). Approximately 50 percent of aluminum cans was recycled in 2022, although this number has been higher in the past (The Aluminum Association, 2024). Metal can be recycled many times, which makes it particularly suitable for the circular economy.1 Environmental benefits of recycling metals are numerous, including reduced energy requirements compared with metal ore processing and extraction. Environmental benefits associated with avoided mining include reduced greenhouse gas, water, and air emissions. Therefore, low recycling rates mean valuable materials are ending up in the landfill.
5.1.4 Glass
Glass waste is commonly collected curbside and at drop-off centers. In 2018, 12.2 million tons of glass waste were generated in the United States, representing 4.2 percent of MSW (EPA, 2024a). Approximately 3.1 million tons were recycled, representing 25 percent of generated glass waste; (a percentage that has persisted for about 25 years) (EPA, 2020). Glass recycling benefits include savings on raw materials (sand, soda ash, limestone, and feldspar), reduced energy use, and greenhouse gases production (because of lower furnace temperature); additionally, in most cases, glass is 100 percent recyclable (Glass Packaging Institute, 2024). Glass recycling is particularly successful in states with deposit-return systems (see Chapter 4).
Despite these many benefits, glass presents challenges in single-stream collection programs. Glass breaks during collection, and its inherent abrasive characteristics become problematic for other commodities and for equipment (trucks and MRF conveyers). Broken glass is a significant problem when collected alongside paper, adding cost to the paper recycling process. As the MRFs sort the glass pieces (called “fines”) from the other recyclables, the result is a highly contaminated glass stream with rocks, lids, and other small contaminants that are removed from the stream along with the broken glass. This ultimately creates a low-value product requiring an expensive process before it can be remanufactured into new glass bottles. The weight of glass compared with its value also limits transporting over long distances to manufacturing facilities.
Consequently, according to a 2023 survey, 43 percent of curbside collection programs no longer accept glass (Glass Recycling Coalition, 2024). One area of increased use for glass waste is in construction, including concrete aggregates, geotechnical applications, tile and brick manufacturing, and water filtration (Kazmi et al., 2019); this may be especially relevant for projects located near MRFs that process glass. In many cases, glass waste leaving MRFs is too contaminated to reuse and is diverted to landfills, where it is used as “alternative daily cover” (i.e., non-earthen material placed on the surface of an active MSW landfill at the end of the day) (NERC, 2023).
5.1.5 Food Waste and Yard Waste
EPA (2024a) reported that in 2018, 21.6 percent of MSW (63.1 million tons) was food waste and 12.1 percent (35.4 million tons) was yard trimmings. Approximately 4.1 percent of food waste was composted (2.6 million tons), down from 6.3 percent in 2017. EPA (2024a) analyzed information from state composting programs to calculate the composting of yard trimmings. This analysis resulted in an estimate of 22.3 million tons of yard trimmings composted or wood waste mulched in 2018 with a 63 percent composting rate. Badgett and Milbrandt (2021), however, calculated that 75 percent of food and yard waste was landfilled and 18 percent combusted.
___________________
1Note that for aluminum recycling, each cycle may result in relatively small net losses of material induced through mill operations (as residual slag) and oxidation during the recycling process. See https://www.aluminum.org/Recycling (accessed May 25, 2025).
Food waste has the highest methane generation potential of all wastes landfilled. This fact, coupled with the high degradation rate of food waste and the typical delay in formal gas collection from landfills, means that most, if not all, of the methane potential in food waste is generated prior to collection of landfill gas (Amini and Reinhart, 2011).
Beyond the impact landfilled food waste has on the environment, the social implications of food wasted (at the retail level) and lost (during harvesting, storage, or transport) on a global scale mean that 24 percent of the world’s calories go uneaten (Goodwin, 2023). Also lost are the land, fertilizer, water, and energy used to generate uneaten food. Regulations at the federal, state, and local levels have tried to prevent food waste through more accurate date labeling; rescue of food for the hungry through food safety and liability protection; and diversion from landfills through animal feeding, organic waste bans, and mandatory recycling policies.
Food and yard wastes can be composted, digested, or converted into biofuel. Kiran and colleagues (2014) estimated that 1.32 × 10⁹ m3/year of methane could be produced globally from food waste, which would generate some 2.6 × 10⁷ joules of energy. Today, composting is the most common alternative to landfilling for food and yard waste, but interest is growing in anaerobic digestion of organic waste, which produces biogas and digestate that can be used as a soil amendment. Badgett and Milbrandt (2021) reported that 283 anaerobic digestion facilities, or digesters, in the United States are processing food waste, including 82 located at wastewater treatment plants and 68 at livestock facilities.
One of the impediments to recovery of food wastes is the difficulty and cost associated with its collection. Many communities that have banned food waste from landfills have created drop-off locations (e.g., New York City) or added collection routes for separated food waste, or allow food waste to be collected along with other green waste. Additional collection routes increase the number of trucks on the road, along with tailpipe emissions, increased accident risks, and cost. However, these disadvantages are offset by reduced landfill gas emissions and potential sale of biogas generated by food waste treatment. A recent study of the impact of adding a food waste collection line (beyond garbage, recyclables, and recyclables) found that food waste diversion reduces the global warming potential of waste collection significantly at a relatively low cost (Reinhart et al., 2023). Furthermore, separation of food waste may decrease the contamination of recyclables, which can have significant advantages for reducing cost and global warming potentials.
5.2 DEMAND FOR RECYCLABLE MATERIALS: END MARKETS
Sales of recyclable commodities in end markets provide revenues that reduce the expense of recycling for local governments and private parties. Commodity revenues can cover a substantial share of the costs of processing recyclables (see Chapter 4). Ideally, recycled commodity prices would be high and steady enough to contribute reliable revenue toward supporting the recycling system. However, the effect of end markets is not exclusively financial, because end uses determine much of the environmental benefit of recycling. Recycling is more likely to improve environmental quality when secondary materials successfully substitute for extraction or production of environmentally damaging primary materials and when these recycled materials can be incorporated into new products without themselves requiring resource-intensive processing. Thus, end markets and programs to support them should be assessed not just in terms of revenue but also in terms of environmental attributes.
Table 5-4 provides summary information about common, current end uses for materials in the United States and Canada. The prices represent the average sales prices of each material after it has been sorted at a MRF in the U.S. Northeast and Canadian Maritime provinces. The price ranges reflect variation in values of the average prices by week for the first half of 2024. Only for some materials do these end markets meet the goals for supporting the recycling system: high prices, steady prices, and environmentally favorable replacements for extraction of primary materials.
TABLE 5-4 End Uses and Prices for Recycled Commodities
| Waste | Price per Tona(Jan–July 2024) | Typical End Usesb,c |
|---|---|---|
| Steel cans | $155–$210 | Many steel products |
| Aluminum cans | $1,210–$1,550 | Aluminum cans, industrial aluminum sheet |
| Glass bottles (color separated) | $10–$58 | Glass bottles |
| Glass bottles (mixed) | Fiberglass, asphalt, other aggregates, landfill cover | |
| Corrugated cardboard | $93–$110 | Corrugated cardboard |
| Other cardboard | Cardboard | |
| Mixed paper | $48–$68 | Cardboard, some other paper grades |
| Plastics: | ||
| PET bottles | $250–$360 | Fiber (e.g., carpet, clothing), bottles (31%) |
| PET clamshells | Fiber | |
| Uncolored HDPE bottles | $610–$770 | Nonfood-contact HDPE bottles |
| Colored HDPE | $370–$540 | Nonpackaging plastics (e.g., pipes) |
| Polypropylene packaging | Durable plastics | |
| Plastic film | Plastic lumber | |
| Flexible plastic packaging | None |
NOTES: HDPE = high-density polyethylene; PET = polyethylene terephthalate. Prices ranges are for a recent 6-month period. A longer time series is shown in Figure 5-3 below.
a Data from wv.gov based on recycle.net data.
c PET bottle reuse: Brian Staley in presentation to committee, June 11, 2024.
As Table 5-4 reports, prices per ton vary greatly across recycled commodities. Materials that are good substitutes for valuable primary materials, such as metals and corrugated cardboard, typically maintain high prices. However, many materials do not easily substitute for primary materials. For example, dyes are often added to color high-density polyethylene (HDPE) and glass bottles, making the postconsumer material suitable only for uses that are not sensitive to the color of the material. And, for another example, reprocessing strips some plastics and paper of desirable chemical or physical properties, restricting the number of times they can be recycled or requiring they be reused only when mixed with primary materials (Basushi et al., 2023). Thus, improved markets for many materials will require either invention of new technologies or vastly improved sorting processes. Federal research funding could help address this important weakness in the recycling system by supporting development of these new technologies. Pointing to the importance of end markets, Bradshaw and colleagues (2025) conclude that “large MRFs also demonstrate success finding markets for a variety of plastics and gain significant revenue from plastics compared to smaller MRFs” (p. 326).
Competition with low-price virgin materials in end markets creates a challenge for recyclables. Virgin materials prices are often lower than the full social costs of producing these materials—both because of the environmental impacts of mining and other raw material production, and because of subsidies for energy production that lower the cost of feedstocks for virgin plastic manufacture. With low prices for virgin materials, manufacturers have limited incentives to use recycled materials in their production. Virgin plastic has become especially cheap in recent years because of fracking in the production of petrochemicals, and because of low-cost imports from China. For 2023–2024, Figure 5-3 shows prices for food-grade recycled polyethylene terephthalate (PET) and a similar grade of virgin PET. It demonstrates that the recycled resin price is consistently higher than the virgin resin price over time, which limits demand for recycled products.2
___________________
2That these price lines track each other is not a coincidence. If the virgin material price were to fall, for example, then demand would shift toward virgin material and away from recycled material, which would reduce the price of recycled material along with the reduced price of virgin material.
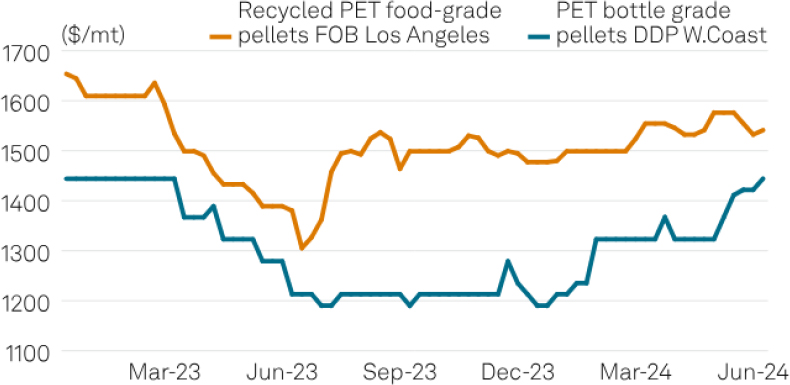
NOTES: The recycled price is free on board or freight on board (FOB), meaning that the buyer may be responsible for delivery and related costs. The virgin price is delivered duty paid (DDP), meaning that the seller pays those costs. Because of this distinction, the figure may understate the true price gap. Mt = metric ton; PET = polyethylene terephthalate.
SOURCE: Platts, part of S&P Global Commodity Insights, 2024.
Volatile prices present another challenge. Price volatility creates stress on local governments that finance most recycling, and it creates fragility in the recycling system because investments are risky. In the history of prices for several commodities, shown in Figure 5-6, prices commonly double or triple and then fall back again on a year-to-year basis. Recycled commodity prices are substantially more volatile than other commodity prices (Moore et al., 2022; Timpane, 2024).
Several features of markets for recycled commodities may explain this price volatility. First, supply of recycled materials is insensitive to price (“price inelastic”). Households do not receive any compensation for recycled materials, so the amount they send to MRFs and other processors is unrelated to the value of the material. MRFs may be contractually obligated to process recyclable material and attempt to sell it regardless of whether they expect to cover their costs in doing so. With this price-inelastic supply, fluctuations in demand for the material translate into large price swings. In addition, in many recycling markets, demand for the materials is driven largely by the prices of the primary commodities for which they substitute, and these primary materials prices themselves are volatile. In the United States, plastics derive from natural gas and from feedstocks from natural gas processing and crude oil refining, resulting in prices that vary with energy market conditions. They are also subject to other global production shocks, such as a recent surge in low-cost imports of virgin PET from China (Staub, 2024). Finally, volatility in these prices relates to the fact that prices are low, because small absolute changes in value can create large percentage price swings. Many of these prices can be very low: mixed paper prices were below zero in 2019 but rebounded dramatically by 2021 with the development of new domestic paper mills (NERC, 2021). These factors are fundamental features of these markets; recycling policies must manage volatility but cannot eliminate it.
5.2.1 Evaluating End Uses
When a recycled commodity is a close substitute for the primary material, their prices are similar, and the recycled commodity’s price reflects the private costs avoided when 1 ton of the recycled material replaces 1 ton of the primary material. These savings may include savings in labor and energy inputs in addition to mineral or other raw material values. They also include costs of environmental controls on
production of the primary material, so tightening environmental regulations on primary production will be reflected in higher prices for the recycled material.
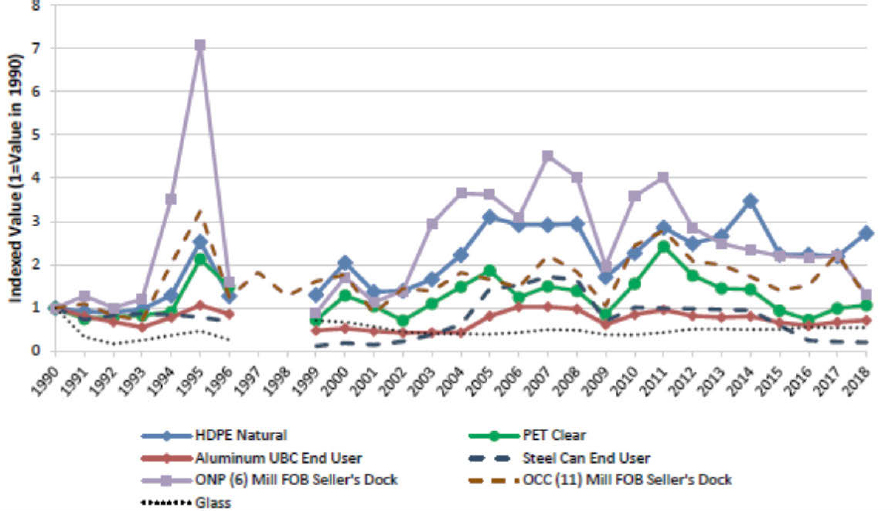
NOTES: Prices adjusted by the Consumer Price Index. OCC = old corrugated cardboard; ONP = old newspaper; UBC = used beverage container.
SOURCE: EPA, 2020.
For some materials, the private sector saves a lot less using recycled commodities. For example, the mixed-color glass cullet that results from MRF-sorted curbside glass recycling often contains a high level of contamination (bottle caps, rocks, and other small “fines”).3 It is expensive for glass processors to make into usable feedstocks for manufacturing. When it is spread over landfills as alternative daily cover, it only avoids the use of some other low-cost material, such as soil, or even another form of waste, such as construction debris (NERC, 2023).
However, end uses may have social benefits not captured in these commodity prices. Primary resource extraction and production generates pollution and other environmental degradation. For example, additional recycling of paper can reduce timber harvesting and thus promote forest carbon sequestration (Lorang et al., 2023). Thus, policymakers also need to consider non-monetized effects of substitution for primary materials.
Recyclable material types differ radically in their value when analyses include both the private values reflected by their prices and the avoided environmental damages. For example, recycling aluminum saves valuable energy, and material resources and thus has social benefits that greatly exceed the benefits of avoiding the use of landfill space. However, given current market opportunities and technologies, recycling glass provides much more limited benefits. Thus, focusing on the weight-based average recycling rates as a policy goal is insufficient and does not reflect the heterogeneity in benefits of recycling for different materials.
In addition, “closed-loop” recycling, or returning a material to its original use, is not always the best target. When recycled materials are used to create another product, or “open-loop” recycling, the result
___________________
3Because the value of glass is low, it is rarely worthwhile for MRFs to invest in glass-sorting technology. Secondary-glass processing facilities have optical sorters to separate the colors of glass, but the cost of extracting the rocks and bottle caps is very high, especially considering the low end-market value of glass.
is sometimes called “down-cycling.” However, neither open-loop nor down-cycling are always inferior to closed-loop recycling in terms of either the avoided use of primary material or the environmental consequences. Geyer and colleagues (2016) demonstrate that closed-loop recycling may increase rather than decrease materials use when the virgin and recycled materials are not good substitutes for each other. Virgin and recycled fiber may instead be complements in paper production, increasing the recyclability of the resulting product (Mondi, 2024).
Allaway (2024) provided examples of how closed-loop recycling can raise resources costs relative to open-loop processes in the context of glass and plastic recycling. First, grinding recycled glass bottles into a fine powder and using it as pozzolan (open-loop recycling), has far less environmental impact than using the glass in new bottles (closed-loop recycling). In the closed-loop process, the recycled glass displaces virgin silica, which reduces energy needs and does have some environmental benefit relative to use of virgin material. However, in the open-loop process, the recycled material (pozzolan) substitutes for cement and thus reduces the substantial greenhouse gas emissions from cement production, thereby providing a greater environmental benefit. In addition, no heating is required to melt the recycled glass cullet when it is used in pozzolan, making the open-loop process more energy efficient than the closed-loop process. A second example concerns plastics recycling. Recycling HDPE packaging into packaging (closed-loop) or pipes (open-loop) both offset the need for virgin HDPE (Allaway, 2024). But preparing scrap for reuse in packaging requires more processing to meet safety standards and thus has higher market and environmental costs.
Additionally, closed-loop recycling does not always offset an equivalent amount of virgin resin. For engineering reasons, some products require more plastic if they are made from postconsumer plastic than from virgin plastic. In those cases, the increased material use diminishes the environmental benefits of using recycled resin. For more on closed- and open-loop recycling, see Box 5-4.
5.2.2 New Technologies
Technological change in end uses may present new opportunities and change future priorities. Figure 5-7 reports the counts of patents for recycling of various materials (the count of patents is commonly used as a metric for innovative activity). These patent counts are for all countries in the Organisation for Economic Co-operation and Development (OECD), but data for the United States alone show the same patterns. Plastic recycling has the most innovative activity and has experienced a boom starting in 2018; a similar, and perhaps related, increase appears in patenting for recycling and reuse of packaging beginning in 2017. The increased patenting activity may have been driven in part by market pressures: the decline in exports markets for postconsumer plastics after the Chinese import ban in 2017 may have spurred developed countries to focus their efforts on creating end uses for these materials. However, the timing of the patenting increases also coincides with greater attention to global harms from plastics, including from microplastics, marine debris, and exposure in lower-income countries.
After plastics and packaging, the next most active area for patenting is paper recycling, but it has not experienced a rapid recent increase. Notwithstanding occasional progress (e.g., Andini et al., 2024), textile recycling has received little innovative attention, and the current deficit of opportunities for recycling textiles seems likely to continue. However, the wave of innovation for plastic and packaging recycling visible in the figure may bring expanded end-use opportunities within a few years. The next section discusses advanced methods for plastics recycling, which may account for some of the surge in innovative activity seen in the patent data.
5.2.3 Mechanical and Chemical Recycling Technologies
Recycling technologies are generally categorized by mechanical or chemical processes. Mechanical recycling processes are used in virtually all types of materials collected for recycling, whereas chemical recycling is associated only with plastics. It is a particular focus as a potential solution for flexible film
plastics and post-use plastic food packaging, which are difficult to recycle into closed-loop products (e.g., food packaging).
BOX 5-4
Closed- and Open-Loop Recycling
Closed-loop recycling is a manufacturing process that leverages the recycling and reuse of postconsumer products to supply the material used to create a new version of the same product.
In a closed-loop recycling system, products are designed in a way that benefits the overall supply chain, emphasizing universal collection and recovery, ease of remanufacturing, and economic feasibility.
Prime examples of closed-loop recycling products include glass used for bottles and jars, aluminum and steel used for cans and other metal products, and a very limited number of plastics. Glassa and aluminumb are near infinitely recyclable with no degradation of quality, making them valuable to the loop (Deer, 2021; Roadrunner, n.d.). In fact, about 75 percentc of all aluminum ever produced is still in use today. Unfortunately, only 2%d of global plastic production is reused for the same or similar products (TOMRA, n.d.).
Closed-loop differs from the far more widespread and achievable concept of open-loop recycling, which does not depend on the output of the process. In this system, the end of the product life cycle can take multiple routes: recycled as raw material for new, yet inferior, products or rejected as waste. For an example of policymakers prioritizing closed loop systems, see National League of Cities (2021).
In a sense, an open-loop system can be semi-circulare or nearly linear depending on how much is recycled (Bell, 2020). When products are recycled in an open-loop system, the new items produced are of a lesser value than the original product—a process known as down-cycling.
Cardboard and paper (which can be recycled five to seven times before unrecoverable loss in quality), many plastics, and in some cases, food waste lack the structural advantages of aluminum and cardboard, making them better suited for open-loop recycling. Examples are countless: polyethylene terephthalate (PET) plastics become fleeces and carpets, and cardboard returns as cereal boxes and paper towels.
a See https://www.roadrunnerwm.com/blog/why-is-glass-recycling-going-away.
b See https://www.roadrunnerwm.com/commingled-recycling.
c See https://www.aluminum.org/Recycling.
d See https://www.tomra.com.
Differences Between Mechanical and Chemical Recycling
The primary way chemical recycling differs from mechanical recycling is that mechanical recycling preserves the original polymer structure, while chemical recycling breaks polymers down into their molecular constituents (however, these processes can be resin specific). Chemical recycling is more expensive than mechanical recycling processes, operates at higher temperatures, is less energy efficient, and is available at a smaller scale today. Because mechanical recycling is better established and requires fewer steps, it tends to be cheaper and more energy efficient. Thus, most recyclables will be processed using mechanical recyclers where possible, with the more expensive chemical recycling use for those types of feedstocks that cannot be recycled via mechanical technologies (e.g., flexible film plastic).
Chemical recycling technologies can create building blocks for new resins that will have the quality of virgin resin. While studies have shown chemical recycling to have a lower carbon footprint than virgin processes, they are more energy intensive and have a higher carbon footprint than mechanical processes.
Conversion processes often require the use of mass balance accounting because not all output is reprocessed into polymers. Some outputs may be used in other applications, such as fuels or base chemicals. Under certain certification programs and policy frameworks, these processes may still qualify as recycling when properly documented and linked to plastic waste feedstocks.
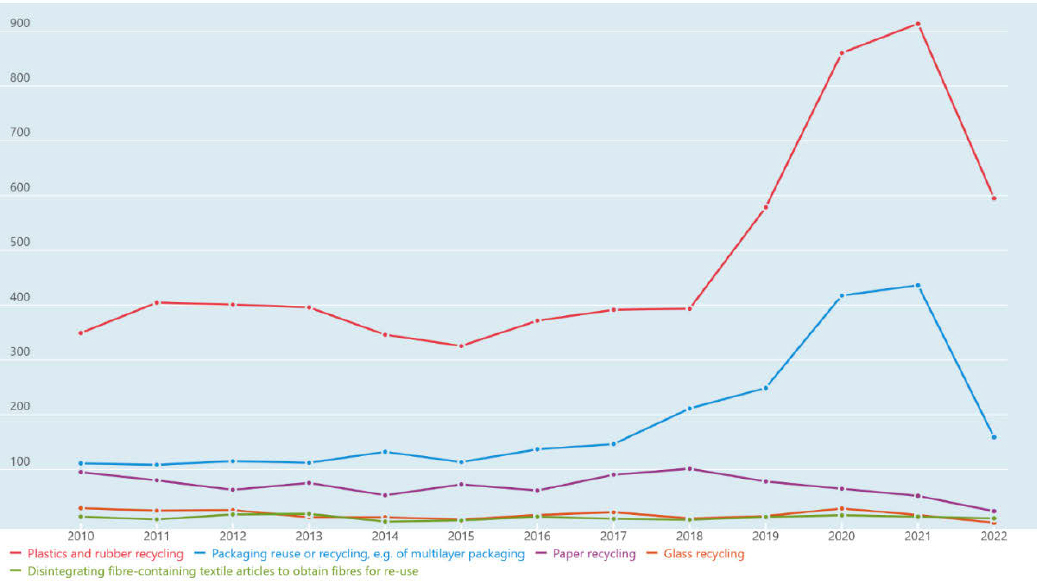
SOURCE: Data from OECD, 2025, patent statistics on environment-related technologies. See https://data-explorer.oecd.org.
TABLE 5-5 Key Definitions of Recycling Technologies
| Recycling Technology | Definition | Key Examples |
|---|---|---|
| Mechanical Recycling | Physically reprocessing materials without altering their chemical structure, enabling repeated recycling within a closed-loop system. | Paper mills that use water and heat to make new paper products; aluminum smelters and steel plants that use shredders and high heat to recycle metals; glass manufacturing plants that crush and melt glass into liquid form for new bottles; plastics facilities that melt recyclable feedstock for manufacture into new products. |
| Chemical Recycling | Breaking down plastic polymers into their original monomers, which can then be repolymerized into new plastic products. A common way of grouping chemical recycling technologies is purification, depolymerization, and conversion. | Purification: molding recycled polypropylene into food containers and automotive parts. Depolymerization: converting polyethylene terephthalate (PET) into monomers used to create new PET bottles and textiles, matching the quality of virgin materials. Conversion: transforming mixed plastic into synthetic fuels and naphtha, which serve as chemical feedstocks for new plastic production or fuel alternatives. |
Policies Around Chemical Recycling
Chemical recycling legislation reclassifies advanced recycling facilities as manufacturing plants, rather than as facilities that handle solid waste (see Figure 5-8). Many state laws, such as those in West Virginia and Mississippi, permit the products of advanced recycling to be “returned to economic utility,” but they often lack specificity regarding what qualifies as recycled material. Conversely, states such as Arkansas and Kentucky do not recognize fuel production from plastics as recycling, necessitating a nuanced approach to mass balance accounting. Given the potential of chemical recycling to address complex plastic waste streams, states may foreclose desirable uses from recycling with outright bans on these technologies. Instead, states would benefit from regulatory frameworks that ensure transparency, environmental integrity, and economic viability of novel recycling methods. This approach can enable chemical recycling to complement mechanical recycling in achieving broader sustainability goals.
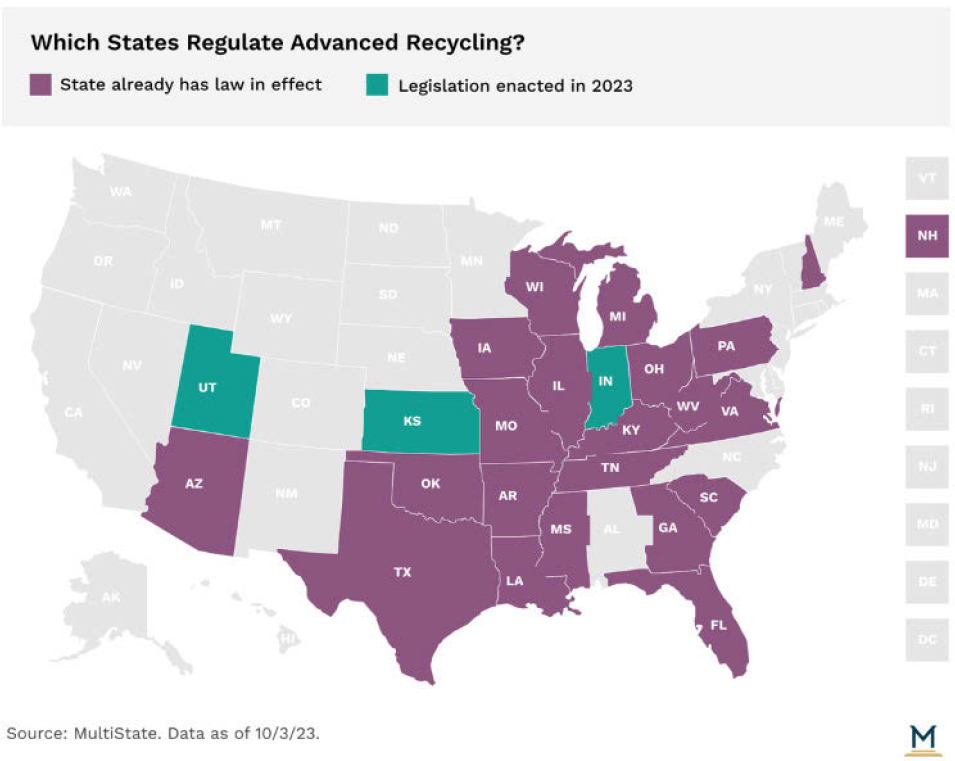
SOURCE: Crawley, 2023, see https://www.multistate.us/insider/2023/11/1/state-legislators-work-to-addressplastics-via-advanced-recycling.
5.3 GLOBAL, REGIONAL AND LOCAL RECYCLING MARKETS
Recyclables are commodities that flow to markets with the highest value. U.S. trade laws generally allow shipment of commodities across the globe to these markets based on the economics associated with these transactions.
5.3.1 Global Markets for Recyclables
While the United States does not limit the export and import of nonhazardous waste, trade is subject to the applicable laws and regulations in the country or counties that control the receipt of waste and recyclables, as well as applicable international agreements. In 2021, most plastic scrap was added to the Basel Convention, which regulates international movement of hazardous wastes (EPA, 2021).
Packaging is needed where products are produced. From the 1980s through the early 2010s, China’s economy grew and became a primary source of products in the global economy. As its finished-product exports grew, China imported more recyclable materials to use in the production of their products and packages.
China’s appetite for feedstock to make new products and packages grew during a time when the United States was collecting more material for recycling. As China’s production of low-cost goods increased, U.S. production shifted to a reliance on products made in China and other developing countries. This development reduced demand for packaging, and the increasing costs of environmental controls and labor resulted in increased costs for U.S. domestic manufacturing companies and a corresponding increase in exports of recyclables to China.
In the 1990s and early 2000s, China purchased increasing volumes of recycled paper and plastic from across the globe to feed its growing economy. Its low-cost labor and mill production (with few environmental controls) led to a massive shift in the production of goods and packaging worldwide. In China, imported recycled plastics were turned into flakes or pellets to be repurposed by plastic manufacturers. This practice was made profitable by favorable shipping rates—in cargo vessels that carried Chinese consumer goods abroad and would otherwise return to China empty—coupled with the country’s low labor costs and high demand for recycled materials.
Operation Green Fence
The reliance on China and its insatiable appetite for recycled feedstock began to change in 2010 with China’s preparation for the 2012 Olympics and with the growth of internet communication about the harms of China’s pollution. Photos and videos were commonly shared showing plastic-filled rivers and ditches, and neighborhoods filled with smoke from plastic and paper mills. China’s air and water pollution became global news at a time when it hoped to attract positive global attention.
As domestic press and global visibility into China’s “pollution problem” grew, Chinese authorities began their first of several constrictions on imports—called “Operation Green Fence”—starting with plastics in 2013. These restrictions banned many types of plastics from being imported into the country. Operation Green Fence was a wake-up call for the U.S. recycling industry. As demand for recycled materials continued to increase in the United States, demand for recycled plastics previously shipped to China came to a halt. Some plastic in the United States was warehoused until end markets could be found, but anecdotal evidence indicates that most low-quality plastic (resin codes 3–7) was ultimately landfilled.
The change in Chinese policy was a precursor to subsequent restrictions and may have begun a shift to more investments in domestic U.S. solutions for materials previously exported across the globe. Research suggests that the policy’s effect on overall waste trade was limited at first, causing a temporary decline in exports to China but not otherwise altering patterns on international trade in waste (Balkevicius et al., 2020).
National Sword Policy
In July 2017, China informed the World Trade Organization of its intent to ban imports of all recycled plastic and mixed paper, effective January 2018. The policy, part of a broader crackdown on imports called the “National Sword,” was an effort to halt a deluge of soiled and contaminated materials that was overwhelming Chinese processing facilities and leaving the country with yet another environmental problem (Katz, 2019).
Because China was handling nearly half of the world’s recyclables at this point (primarily paper and plastic), the Chinese ban had a dramatic effect on global markets. Before the ban, 75 percent of U.S. recycled plastics was exported, with 40 percent going to China (Sigman and Strow, 2024). Europe exported 46 percent of its recycled plastic, even as the phase-in of the Chinese ban began in 2017 (Bishop, 2020). U.S. exports to China in the waste categories covered by the ban fell from 2.9 million metric tons in 2016 to only 135,000 metric tons in 2018. Some exports diverted to other international buyers, such as Vietnam and India, but these countries also began to implement their own restrictions on imports through their ports (Resource Recycling, 2022).
The loss of the Chinese markets had profound effects on U.S. waste management and on the environmental effects of trade in recyclables. Landfilled waste rose in the states most affected by the ban; the ban also seemed to undermine local recycling systems and led to reductions in employment in MRFs (Sigman and Strow, 2024). Taylor and colleagues (2024) found that other countries experiencing the largest increases in recycled plastic imports following the Chinese ban also experienced increases in plastic bottle litter.
Basel Convention and International Trade in Recyclable Scrap and Waste
The Basel Convention on the Control of Transboundary Movements of Hazardous Wastes and their Disposal (Basel Convention) was adopted in 1989 and came into force in 1992. It is the most significant multilateral treaty governing the movement of hazardous waste, solid waste, and scrap for recovery and disposal internationally (UNEP, 2011). Currently, 187 countries are ratified members of the Basel Convention. The United States was an original signatory to the Basel Convention in 1989 but never ratified the agreement and is not a current member of the Convention.
The Basel Convention establishes rules and regulations for international shipments of all hazardous waste and solid waste for reuse, recovery, and disposal. It thus has important impacts on international markets for recyclable materials members and nonmembers alike. A notable feature of the Basel Convention is that member nations are prohibited from trading scrap and waste with nonmember nations if it is classified as having hazardous characteristics (UNEP, 2011). This rule has the potential to severely limit the markets available for the United States to export recyclable materials that are classified in categories deemed to have hazardous characteristics.
A significant example involves trade in plastic waste. Beginning in January 2021, provisions in the Basel Convention reclassified plastic scrap and waste from a single category that was previously freely traded to two new categories that are now subject to Basel Convention trade restrictions (even plastics that are not hazardous). The first new category covers mixed-plastic scrap and waste, plastic waste mixed with other forms of scrap, and plastic waste that is contaminated (e.g., with food or other nonhazardous substances). The second new category covers plastic scrap and waste that the Basel Convention classifies as hazardous waste. Both categories now require prior notice and consent, which means an importing country must accept in writing any shipment before it leaves the port of the exporting country. The Basel Convention plastics amendments significantly reduced international trade in plastics. For example, Ishimura and colleagues (2024) found that the Convention reduced plastic waste trade volume from developed to developing countries by 64 percent.
Importantly, the Basel Convention contains a provision that its members are not permitted to trade Basel-controlled plastic scrap and waste with nonmember countries except under the terms of an agreement or arrangement provided for by Article 11 of the Convention (Department of State, 2025). Thus, for the 187 Basel member countries, plastic scrap and waste that was uncontrolled prior to January 2021 cannot be traded with the United States unless a separate agreement is negotiated. The United States has negotiated separate agreements for importing and exporting hazardous waste with five countries: Canada, Mexico, Costa Rica, Malaysia, and the Philippines.
The United States and Canada first established a bilateral agreement in 1986 to address the movement of hazardous and municipal waste for recycling and disposal between the two countries. In 2020, they developed an additional agreement regarding the transboundary shipments of nonhazardous scrap and waste products, including nonhazardous plastic scrap and waste. These shipments are not subject to prior notice- and-consent rules as long as the movement of the material is only between the two countries and is being sent to locations following environmentally sound practices (EPA, 2018). The U.S. agreement with Mexico was also established in 1986 and allows for the movement of hazardous waste from Mexico to the United States for the purposes of recycling or disposal, but it only allows for hazardous wastes to be shipped from the United States to Mexico for the purposes of recycling. The United States also has bilateral agreements with Costa Rica, the Philippines, and Malaysia stipulating that wastes may be exported from those countries to the United States for recycling or disposal, but the United States may not export waste to any of them.
In addition to those five bilateral agreements, the United States is a member of OECD and is thus subject to the Council on the Control of Transboundary Movements of Wastes Destined for Recovery Operations, as well as OECD’s plastic waste amendments effective January 2021. These amendments grant OECD member countries the right to govern nonhazardous plastic waste trade according to their own national and international laws. Given that most OECD member countries are also members of the Basel Convention, most have adopted the new Basel Convention restrictions on plastic waste.4
U.S. Trade in Recyclable Waste and Scrap Material
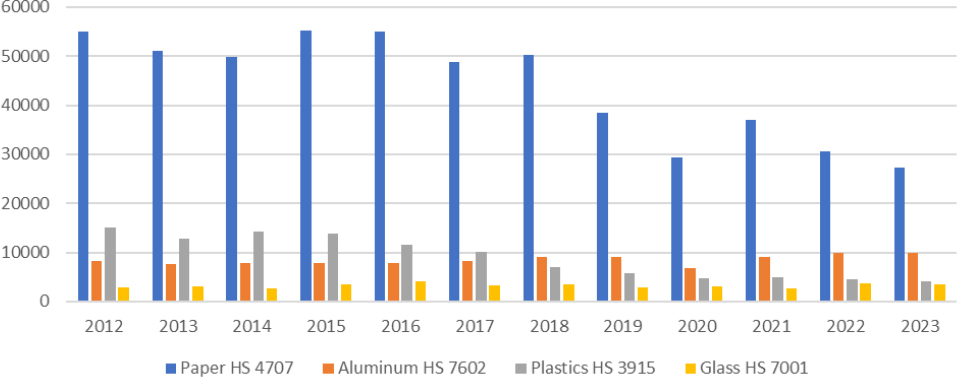
Recyclable scrap and waste materials operate in interconnected global commodity markets. From 2012 to 2023, the world traded more than 776 million metric tons of scrap and waste glass, paper, plastic, and aluminum across international borders.5 Of the four commodities traded internationally in Figure 5-9, scrap and waste from paper and paperboard products are the largest by weight. Prior to 2018, plastic scrap and waste was the second-largest recyclable commodity of the four (UN Comtrade, n.d.). But after China’s National Sword policy was implemented in 2018 and plastics were reclassified under the Basel Convention in 2021, plastic scrap and waste trade has fallen off dramatically, from 15 million metric tons in 2012 to 4 million metric tons in 2023 (UN Comtrade, n.d.). This trend could continue with more countries restricting imports of plastic scrap and waste. In January of 2025, Thailand will completely ban the imports of plastic scrap and waste (Igini, 2023).
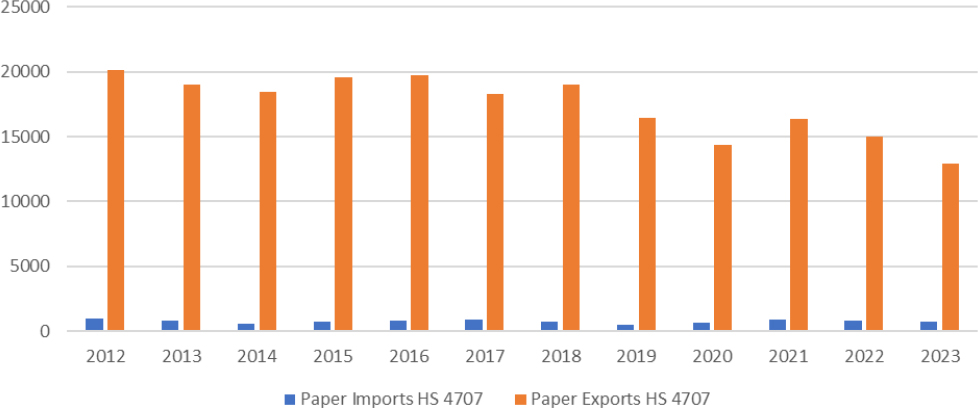
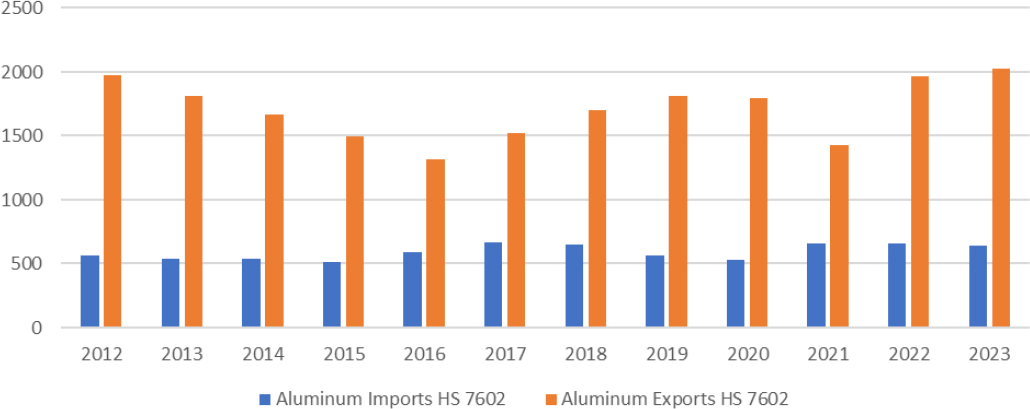
Trade in scrap and waste glass and aluminum has remained fairly steady over this period, with minor increases from 2012 to 2023 (UN Comtrade, n.d.). The United States has been, and remains, a large player in all four scrap and waste commodity markets internationally. Of total world trade in 2023, the United States was either an importer or exporter of 4 percent of glass traded, 50 percent of paper and paperboard traded, 27 percent of aluminum traded, and 22 percent of plastics traded (UN Comtrade, n.d.). However, as demonstrated in Figures 5-10 through 5-12, the United States has been a net exporter of scrap paper and aluminum for the past decade but a net importer of glass from 2012 to 2023.
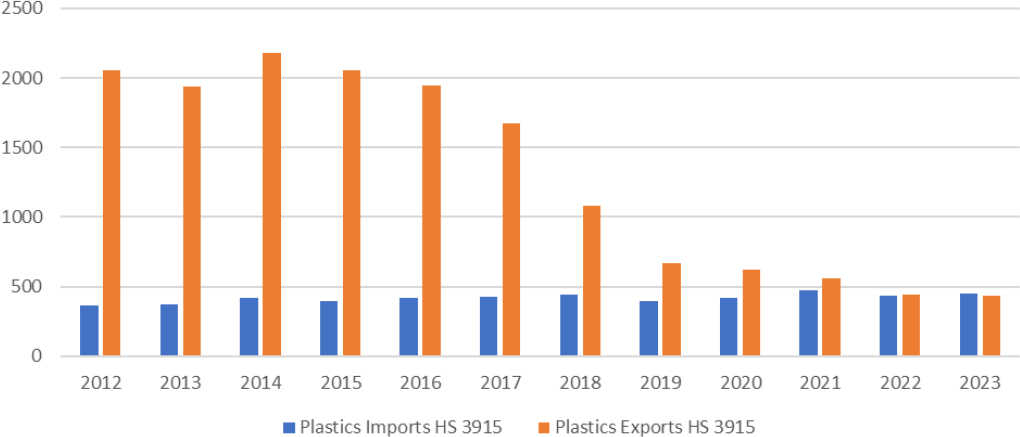
The biggest changes have been observed in plastic scrap and waste trade. Figure 5-12 shows that, from 2012 to 2023, the United States has gone from being a net exporter (1.69 million metric tons per year) to being a net importer (15,000 metric tons per year) of plastic scrap and waste (UN Comtrade, n.d.). This dramatic decline follows the general worldwide trend for scrap and waste plastics, shown in Figure 5-12.
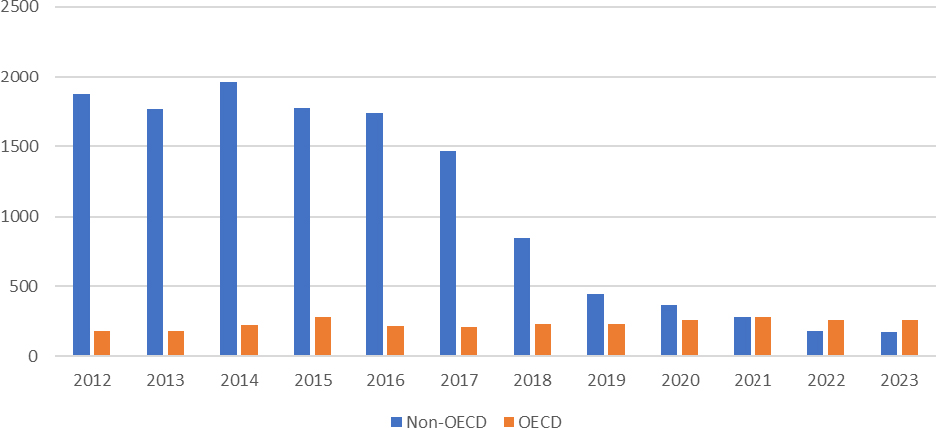
Importantly, much of the reversal in the U.S. trade surplus in plastic scrap has been driven by changes in trade with non-OECD nations. Figure 5-13 shows that U.S. exports of plastic scrap to OECD countries remained relatively stable, but exports to non-OECD countries, such as China, Thailand, and
___________________
4For specific rules for each OECD member country, see https://www.oecd.org/en/data/tools/transboundary-movements-of-waste.html.
5Data are from the United Nations Comtrade database at https://comtradeplus.un.org. These data are for the 4-digit harmonized system (HS) classifications of waste, pairings, and scrap for plastics (HS 3915); scrap and waste of paper and paperboard (HS 4707); glass cullet and other scrap and waste of glass (HS 7001); and aluminum scrap and waste (HS 7602).
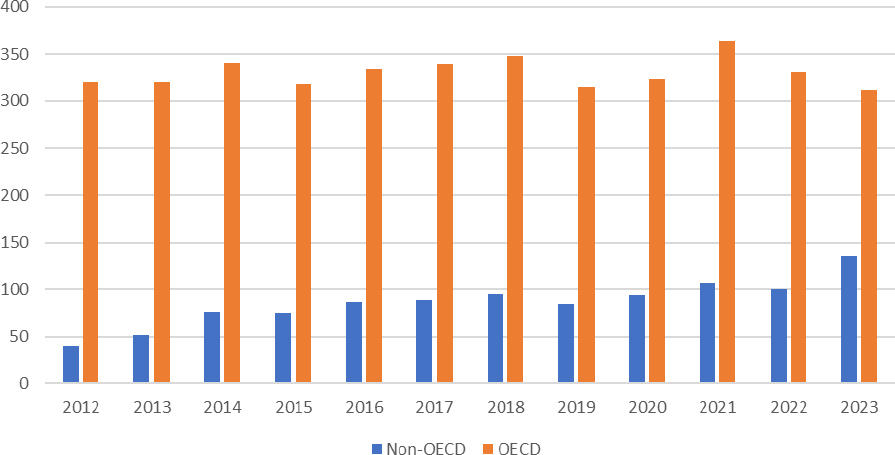
Malaysia, began to decline rapidly around 2017 (UN Comtrade, n.d.). During the same time, imports of plastic scrap from non-OECD countries (Figure 5-14) has been increasing, even though imports from OECD nations have remained fairly stable. U.S. imports of plastic scrap and waste from non-OECD countries increased 235 percent over 2012–2023, from 40.5 thousand metric tons in 2012 to 1.35 million metric tons in 2023 (UN Comtrade, n.d.).
NOTE: HS = harmonized system.
SOURCE: Data from UN Comtrade database at https://comtradeplus.un.org.
NOTE: HS = harmonized system.
SOURCE: Data from UN Comtrade database at https://comtradeplus.un.org.
Shifting Trade in a World after China Sword and Basel Convention
As a result of both the Basel Convention and China’s National Sword policy, the United States and other countries have increased their focus on developing domestic markets for plastics collected for recycling. Ultimately, China’s policy spurred increases in recycled paper capacity in North America, with over
25 new recycled paper mill projects completed since the National Sword policy was implemented (NERC, 2024). After decades of shuttering paper mills as production moved overseas to developing countries, starting in 2018, the United States saw commitments for new domestic paper mill capacity and plastic recycling infrastructure. In 2024, significant new capacity for paper mills producing cardboard from recycled feedstock has come online, and domestic markets for plastics have sufficiently replaced capacity to handle the quantity previously exported. These changes have contributed to a rebound in the price for postconsumer paper, which decreased in the immediate wake of the 2018 restrictions but has now surpassed pre-2018 prices.
NOTE: HS = harmonized system.
SOURCE: Data from UN Comtrade database at https://comtradeplus.un.org.
NOTE: HS = harmonized system.
Data from UN Comtrade database at https://comtradeplus.un.org.
NOTE: OECD = Organisation for Economic Co-operation and Development.
SOURCE: Data from UN Comtrade database at https://comtradeplus.un.org.
NOTE: OECD = Organisation for Economic Co-operation and Development.
SOURCE: Data from UN Comtrade database at https://comtradeplus.un.org.
The Role of the Global Marketplace
Although the amount of paper and plastic recycled domestically has grown since the 2010 peak in exports of recyclables, the global marketplace plays an important role in creating balance between supply and demand. When demand (and prices) are low because of seasonality or changing economics, the export market tends to help keep material moving. Even when domestic demand is high, the availability of international trade partners helps keep markets competitive, ensuring that domestic purchasers such as mills do not develop too much power over prices. These relationships can help stabilize prices for metals, paper, and
some plastics and ensure that those materials obtain higher-valued uses than a domestic market alone might provide.
However, international trade in recyclable materials may raise environmental concerns that stem from the possibility of a “waste haven” effect, in which waste management and possibly recycling tend to occur in jurisdictions that provide fewer environmental protections (Kellenberg, 2012). Taylor and colleagues (2024) found that increases in a country’s plastic imports increase plastic bottle litter, with the increase concentrated in countries that mismanage their plastic waste.
Virgin Plastic Imports
The production of virgin resin has surged globally in recent years, resulting in an oversupply that drives down the cost of virgin plastic on the market (Plastics Europe, 2021). This oversupply has led to substantial imports of low-cost virgin resin into the United States, creating significant challenges for recycled plastic markets. With virgin resin prices frequently undercutting the cost of producing postconsumer resin, the financial sustainability of recycling is at risk as those operations struggle to compete against inexpensive, newly manufactured plastic (Chowdhury et al., 2022).
This influx of low-priced virgin plastics not only affects the competitiveness of recycling operations but also has broad implications for sustainability goals. Manufacturers’ preference for cheaper, imported virgin resin reduces demand for recycled materials, complicating efforts to close the recycling loop and establish a circular economy (Ellen MacArthur Foundation, 2020; UNEP, 2021). This trend underscores the need for supportive policies and industry incentives that prioritize recycled content (European Commission, 2020).
5.3.2 Regional and Local Markets
The desire to develop local and regional markets for recyclables dates back to early recycling programs in the United States. These programs arose from a growing recognition that effective management of sustainable recycling systems requires robust, consistent demand for recyclable materials within close proximity to collection centers. Developing regional markets can help minimize transportation costs, stimulate local economies, and provide greater resilience in managing material streams that can be vulnerable to fluctuations in international markets.
Early Market Development Efforts in the 1990s
In the 1990s, as local recycling programs grew in number, several states took it upon themselves to support efforts to develop local or regional markets for recyclables. Specific recycling market development programs were created in New York, New Jersey, North Carolina, and Washington State. North Carolina’s Department of Environmental Quality (n.d.) issued grants through its Recycling Business Development Grant Program to support the state’s recycling businesses and promote material recovery and end-use development. Washington established the Clean Washington Center, housed in its Department of Commerce.
EPA (1995) followed in states’ footsteps, publishing Recycling Means Business, which outlined a market development strategy. The program included funding for state recycling and reuse business centers, economic development advocates, and the establishment of recyclable commodities trading systems.
Renewed Market Development Efforts in 2018
Efforts to maintain investments in domestic end markets continued but slowed during the 2000s because of financial constraints, political factors, and other limitations. However, in response to China’s National Sword policy, state policy initiatives related to recycling market development regained momentum. As a result, several states (including Minnesota, South Carolina, Pennsylvania, and Michigan) that had
previously established recycling market development programs saw those programs revitalized with a renewed sense of urgency, bolstered by increased financial and personnel resources. See Boxes 5-5 and 5-6 for examples of recent state policies and initiatives.
BOX 5-5
Case Studies: State Recycling Market Development Programs
Several states have initiated efforts to establish new recycling market development centers or programs since 2018:
- Colorado (SB20-055, 2020)a directed the state’s Department of Public Health and Environment to create a plan for a new recycling market development center. Colorado (HB 1159, 2022)b also created a circular economy development center to grow existing markets; create new markets; and provide the necessary infrastructure, systems, and logistics to create a sustainable circular economy for recycled commodities in the state. One of the center’s primary roles is connecting end markets with existing state grants and other incentives.
- Maryland (HB0164, 2021)c required the state’s Office of Recycling to “promote the development of markets for recycled materials and recycled products” through efforts such as helping connect recycled materials, especially hard-to-recycle ones, with suitable end markets.
- New Jersey (S-3939, 2018)d called for the creation of a Recycling Market Development Council that would report on best practices to reduce the contamination of recyclables and recommend ways to stimulate demand for the materials.
- Texas (SB 649, 2019)e mandated the Texas Commission on Environmental Quality (2021) to produce a market development plan for using recyclable materials as feedstock in processing and manufacturing.
a See https://leg.colorado.gov/bills/sb20-055.
b See https://leg.colorado.gov/bills/hb22-1159.
c See https://mgaleg.maryland.gov/mgawebsite/Legislation/Details/HB0164?ys=2021RS.
Regional and Local Market Development Focus by Material Type
Efforts to develop regional and local markets for recyclable materials have long centered on addressing the challenges presented by the heterogeneity of material types and variations in market demand, transportation costs, and end-use applications. Although each material has unique obstacles, sustained efforts have aimed at fostering viable domestic recycling solutions and reducing dependency on global export markets. The following sections summarize current challenges and initiatives for glass and plastics.
Glass Recycling and Market Development
Glass has consistently posed a challenge for regional recycling efforts because of its high weight, low market value, and high transportation costs that often exceed the material’s economic value and thus limit its accessibility to end markets. The widespread use of imported-glass packaging in consumer products—such as wine, beer, and food items—has created an oversupply in many areas. Additionally, the quality of glass collected through curbside programs tends to be low, further complicating the ability to market this material effectively. As a result, glass has become a persistently difficult commodity to manage within recycling systems, particularly in areas with limited local end markets.
Various initiatives have tried address the need for new end markets for recycled glass. Programs such as those led by the Northeastern Recycling Council (NERC) and the Clean Washington Center have
explored solutions to increase the value and usability of recycled glass. While large-scale solutions have remained elusive, niche markets for recycled glass have developed, including applications in abrasives, art, drinkware, and specialty products. Despite these efforts, comprehensive regional markets for glass recycling remain limited, so glass recycling continues to pose challenges for many local systems.
BOX 5-6
Case Study: Washington’s NextCycle Program
Washington State (SB5545, 2019)a authorized the creation of a recycling development center to encourage new companies to process recyclable materials and develop more local end markets, guided by an advisory board that includes recycling industry representatives (Department of Ecology, n.d.).b The center, now called NextCycle (n.d.),c has evolved to include the City of Seattle and King County. NextCycle seeks to advance a circular economy by fostering public–private partnerships that support innovative recycling and material recovery solutions (Department of Ecology, 2023).
A core component of NextCycle is the Circular Accelerator, which uses a competitive model for identifying and supporting projects with high potential impact. In its first round, 14 teams proposed scalable end-market solutions targeting materials prevalent in the regional waste stream, such as glass, textiles, food waste, demolition debris, and used bedding (King County Solid Waste Division, 2023). These teams competed for $26,000 in funding to further develop initiatives aimed at enhancing local recycling infrastructure and reducing material sent to landfills.
The NextCycle Washington program highlights the importance of developing resilient end markets for recyclables, particularly as global recycling markets fluctuate. By facilitating regional market development and supporting viable recovery pathways for traditionally discarded materials, this initiative aligns with evidence-based goals for sustainable materials management (Washington State Recycling Association, 2022). In doing so, NextCycle Washington addresses both environmental and economic objectives, providing a replicable model for improving material recovery systems through integrated, locally focused approaches.
a See https://app.leg.wa.gov/billsummary?BillNumber=5545&Initiative=false&Year=2019.
b See https://ecology.wa.gov/Waste-Toxics/Reducing-recycling-waste/Strategic-policy-and-planning/Recycling-Development-Center.
Development of Domestic Markets for Plastic
Growing restrictions on the export of plastics—intensified by the Basel Convention’s regulations—have been accompanied by an increased focus on developing domestic end-market solutions for various plastic types. Notably, significant progress has been made in recycling PET and HDPE plastics to meet stringent standards for bottle-to-bottle recycling, thereby supporting sustainable domestic markets.
Historically, less than 25 percent of recycled PET bottles was reprocessed into new bottles, with the majority instead repurposed in the textile industry. However, in 2023, for the first time, the volume of PET recycled into bottles surpassed that used in textiles, reflecting advancements in processing technology and market demand for high-quality, recycled PET suitable for food-grade applications (NAPCOR, 2023).
And traditionally, HDPE recycling has focused on applications like piping. Recently, however, an increasing percentage of natural-colored HDPE bottles are being recycled to Food and Drug Administration standards, allowing these materials to be used to produce new milk jugs and other food-grade containers.
5.4 PUBLIC POLICIES FOR END MARKETS
Public policy interventions may improve and support end markets for collected materials by (1) increasing materials supply by encouraging households to recycle and (2) increasing demand for the secondary material. The latter can be achieved through postconsumer recycling (PCR) content standards and government procurement policies.
5.4.1 Postconsumer Recycling Content Policies
PCR content laws (PCR policies), also called minimum content legislation, can play a vital role in promoting recycling by requiring manufacturers to reach a minimum percentage of inputs that are recycled material. These policies apply to postconsumer content, as opposed to postindustrial content (a byproduct of manufacturing) or preconsumer content (a product that never reaches the consumer). Postconsumer content is sometimes less pure and harder to use compared with these other types, so legislation has focused on these materials.
PCR policies can increase regional and national demand for recycled materials, thereby supporting prices (Palmer and Walls, 1997). They may also help stabilize prices by providing a reliable source of demand, because manufactures cannot easily substitute from the recycled commodity when primary materials prices drop. Thus, these laws reduce the economic risk for investments in capital-intensive recycling infrastructure. By supporting the recycling industry, they help provide many of the benefits of recycling discussed above, such as reducing reliance on virgin materials and the adverse climate and environmental impacts associated with raw material extraction and production.
Experience with PCR Policies
Although no federal PCR policies have been passed to date, states have used them for more than 30 years as part of a demand-side market development strategy. The first wave began in the 1980s and focused on newsprint. By 1990, eight states enacted recycled content mandates: Arizona, California, Connecticut, Illinois, Maryland, Missouri, Oregon, and Wisconsin (National Solid Wastes Management Association, 1991). In the 1990s, California enacted PCR policies for fiberglass, glass containers, plastic containers, and plastic trash bags. In 1995, Oregon set a 25 percent PCR content standard for plastic beverage containers.
Although these early PCR policies played an important role in supporting the expansion of recycling, they were not adopted by other states. Most of the focus of recycling programs between 1995 and 2017 focused on collecting more material and processing it to grow supply for end markets. Few policies were designed for growth demand of recycled materials.
As discussed above, cheap virgin resin has undercut demand for postconsumer plastic. In response to pressure from recyclers, states have passed a new wave of minimum PCR content standards. These new initiatives primarily target packaging materials, beverage containers, and plastic bags. For example, California’s AB 793 mandates that plastic beverage containers must meet specific recycled content thresholds, which are set to increase over time. New Jersey has phased in PCR content mandates across various packaging types, including rigid plastic and glass containers, plastic bags, and trash bags, with rates that will rise incrementally through 2027. Similarly, Washington State’s SB 5022 sets minimum PCR content for plastic beverage bottles and other containers, aiming to drive the use of recycled materials across common consumer products (Retail Compliance Center, 2023).
Problems with PCR Policies
Although PCR content standards can have benefits, they also have drawbacks. First, these standards often require that materials are reused in consumer products, which may not always be the least resource-intensive use of recycled materials (as some indicated by some of the examples in the discussion of closed loop recycling above). The standards may thus raise the overall social costs of the recycling system. The Oregon Department of Environmental Quality’s 2020 report, “Evaluating the Effects of PCR Content on Environmental Impacts” stated:
The second finding is that recycled content by itself is not a good predictor of lower environmental outcomes when comparing functionally equivalent (substitutable) packaging made from different
materials. Just because a package contains higher levels of recycled content (on a mass or percentage basis) does not indicate that it has lower negative impacts because materials have substantially different production burdens. For example, a glass bottle may contain a higher percentage of recycled content than a lightweight flexible pouch or plastic bottle. Based on recycled content one may be inclined to prefer the glass container, but because of its higher overall weight glass may use more virgin material overall, and because of how it is made, may result in higher impacts such as emissions and resource depletion.6
Another drawback of PCR policies is that they may raise the prices or reduce the quality of products, such as packaging, that must have a minimum recycled content. To be effective, the policies must force manufacturers to use more recycled material inputs than they would choose without the policy; the necessary adjustments will either reduce the quality of the products made with these inputs or raise costs (and thus price). The resulting price increases may create desirable incentives for source reduction (Sigman, 1995). States have chosen to focus PCR content mandates on packaging, which may reflect a desire to discourage its consumption at the same time as increasing demand for recycled materials. However, restrictive content rules may raise final product costs more than necessary and discourage consumption of the products that have the best potential for closed-loop recycling.
Flexibility in the design of PCR content standards can reduce these adverse impacts. A form of flexibility used in practice is to allow averaging of recycled content across all covered products made by a company. These “portfolio standards” allow firms to choose the product lines in which recycled materials can most easily be integrated; they may also decide to concentrate their recycled materials in product lines that they sell at a discount or as a “green choice” that the market might not otherwise sustain. An even more flexible system would allow averaging across an industry with trading: producers who can more easily substitute recyclables will exceed the standards and receive payments from other producers who do not meet the standards.7 Such flexibility might have been useful in the early days of recycled newsprint content standards. For example, Canadian producers relied mostly on virgin pulp from their extensive forests, and they were forced to import U.S. recycled pulp. Thus, they complained that these policies put them at a competitive disadvantage (McCarthy, 1994).
The effectiveness and costs of PCR policies are likely reduced by the fact that they have been implemented at the state level rather than the national level. Requirements that vary across states create complexity for producers and logistical issues that raise costs. And a single state can increase demand for only a small share of the overall product market. The resulting prices increases may be muted because recycled commodity prices are determined regionally or nationally. However, state policies may have spillover effects to other states, as producers find it easier to comply with the strictest state policy across their entire sales region, rather than tailor the manufacture of their products state by state. This phenomenon is known as the “California effect”; it may allow large states to assume an outsized role in national production patterns.
Finally, the most significant concern about PCR legislation is that, as demand-side policy, it does not ensure adequate supply of recycled materials. Although it will likely increase the prices of recycled materials and thus help MRFs support increased collection and processing of these materials, the extent of this indirect supply response is unclear. Any supply response might require local governments to adjust their policies, which they might not do in response to small changes in prices. If the supply does not react adequately, the policy may create excessive price increases. To ensure adequate supply to meet the demand that these PCR policies create, they need to be combined with public policy interventions to support supply—such as EPR or mandatory recycling policies.
___________________
6See https://www.oregon.gov/deq/FilterDocs/pcr.pdf.
7Standards that allow trading have not been used in practice for recycling but have been used successfully for other environmental objectives, in for example, state renewable energy portfolio standards and in the U.S. phase-out of lead in gasoline.
5.4.2 Government Procurement
Government procurement may be an important public policy in supporting recycling end-use market. The U.S. federal government is among the largest consumers of goods in the world and thus has considerable influence on many product markets. The 1976 Resource Conservation and Recovery Act required EPA to set requirements for recycled content in government purchases, resulting in the Comprehensive Procurement Guideline Program (EPA, 2024b). EPA set requirements for 62 products in eight categories that range from paper to construction materials and vehicular parts. Although difficult to assess empirically, the program’s benefits may come not just from its direct effect on demand but also from the information it provides to other purchasers about which products contain or could contain recycled materials. States and local governments also have recycled content requirements for their purchases, but their reach is narrower than that of the federal program.
5.4.3 Taxes and Fees on Virgin Material
Another mechanism that governments use to stimulate end markets for recycled material is to impose taxes or fees on virgin (i.e., nonrecycled) material. This kind of policy places an economic disincentive on the use of virgin material while creating an economic incentive to use recycled material. A recent example of this kind of tax is from the United Kingdom (Box 5-7), which has a policy that focuses on plastic use in packaging.
The United States also imposes taxes on virgin plastic resin through the Superfund program. These fees, discussed in Box 5-8, are not designed for their effects on recycling but nonetheless slightly discourage virgin plastic use.
5.5 KEY POLICY OPTIONS
Policies that influence material use and recycling can help balance economic and environmental considerations while shaping market dynamics and consumer behavior. Effective approaches aim to address cost differences between virgin and recycled materials, encourage the use of recycled content, and support waste reduction efforts. Well-designed policies can also enhance market stability, promote innovation in recycling technologies, and improve the overall efficiency of material management systems.
BOX 5-7
Case Study: UK Plastic Packaging Tax
In April 2022, the United Kingdom implemented a tax on plastic packaging that does not contain at least 30 percent recycled material. The initial tax of £200 per metric ton of plastic packaging material rose to £217.85 per metric ton in April 2024. It applies to plastic packaging used in the supply chain and in single-use consumer packaging. Two parties are responsible for paying the tax: UK-based manufacturers of plastic packaging and importers of plastic packaging material. This tax was implemented to increase domestic demand for recycled plastic packaging and to reduce the amount of plastic waste ending up in landfills or in the environment, or being incinerated.a
a See https://www.gov.uk/government/publications/plastic-packaging-tax-rate-change-from-1-april-2023/rate-change-from-1-april-2023-for-plastic-packaging-tax.
5.5.1 Revenue-Neutral Fee-and-Reward Program
For two major reasons, the societal costs of virgin materials extraction exceeds the direct dollar costs to companies and their customers. First, for many years, various direct and indirect government subsidies have promoted oil and gas industries that provide petrochemicals used to make virgin plastic resins
(Metcalf, 2018). Second, as highlighted in this report, those industries do not pay all the substantial indirect environmental, social, and economic costs of extraction. For both reasons, the use of virgin materials exceeds the socially optimal amount, and its subsidized supply on the market outcompetes the demand for recycled materials.
BOX 5-8
Superfund Excise Tax on Hazardous Substances
The reinstatement of the Superfund excise tax through the Inflation Reduction Act of 2022 (Pub. L. 117-169) will affect incentives for use of virgin versus recycled materials. Effective mid-2022, the tax imposes levies on crude oil and petrochemical feedstocks products, which will be adjusted annually for inflation (IRS, 2023). The levy applies to several feedstocks for virgin plastics, including ethylene and propylene, at an initial rate of $9.74 per ton. By increasing the financial burden of using virgin petroleum-based materials, the tax may indirectly encourage substitution toward recycled plastic inputs, as well as away from plastics toward other materials. It may modestly increase the cost of manufacturing plastic from petrochemicals but is not designed to reduce reliance on single-use plastics (Mann, 2024). Revenues generated from this tax are directed to the Superfund Trust Fund, managed by the U.S. Environmental Protection Agency, which pays for cleanup of hazardous sites—especially when settlements have not been reached for private clean-up (GAO, 2023).
Meanwhile, many policies have successfully encouraged the supply of recycled materials from households and businesses. Without sufficient demand for those materials, recycled materials markets—particularly plastics markets—experience significant imbalance. As such, a simple fee by weight of virgin resin could address part of this imbalance, with various possibilities for the use of the revenues generated by that fee.
The costs of MSW recycling programs and curbside collection include the need to collect, sort, clean, crush, and bale the different materials for transport, and to process the material into recycled resin that can be used as a feedstock. These costs mean that the market price of recycled materials may exceed the often-subsidized price of virgin feedstock. For example, Figure 5-4 shows persistently higher prices for the recycled material than for the virgin material for PET that is used to make plastic packaging. As such, recycled materials may face challenges in competing against clean, homogenous virgin material. This economic challenge is particularly acute for plastic resins and for glass collected in curbside recycling programs, as explained earlier in this report. While glass markets are mature, large-scale virgin plastic resin production is increasing the amount of low-cost virgin plastic on the market. A subsidy per weight of recycled material would reduce its price as an input to manufacturing and address another part of that market imbalance. However, such a subsidy or reward for using recycled materials would require a source of funds.
For these reasons, an effective policy would combine both approaches: a revenue-neutral policy that applies a fee per ton of virgin resin used in domestic manufacturing of plastic packaging and single-use products, with all revenue used to fund a reward per ton of recycled resin used in those same processes. In parallel, a border adjustment fee on fully manufactured imported plastic packaging and single-use products would be needed to sufficiently discourage the relocation of manufacturing processes. Because it applies to national and international markets, it would need to be enacted at the federal level. Other policies encourage the supply of PCR content; firms would earn the reward when they buy postconsumer, not postindustrial or preconsumer recycled content.
This policy would help achieve several recycling objectives: (1) it makes the cost of recycled materials more competitive with virgin materials used as feedstock in manufacturing; (2) it increases demand for recycled materials, which raises the effectiveness of efforts to increase household participation and recycling supply; (3) it helps reduce environmental and social damages from landfills and from litter or dumping; and (4) it helps build end markets for recycled materials (the importance of which is discussed earlier in this chapter; see also Bradshaw et al., 2025).
The policy reduces environmental and social damages from disposal by incorporating some of the external costs of these materials into the prices that manufacturers and consumers pay for these materials.8 By enhancing demand for recycled plastic resin and reducing demand for virgin material, this policy would reduce environmental costs from virgin materials extraction and landfilling of plastics. It would increase the effectiveness of MSW recycling programs and may have additional effects of decreasing plastic litter. Lastly, an additional strength of this policy approach is that it avoids mandated rules about company behavior and allowable materials, instead leveraging price incentives in market choices.
Trade-offs need to be acknowledged for this policy approach, however. The committee acknowledges the challenges in enacting and administering large-scale tax policy. Furthermore, while companies that can readily adjust to the new incentives for using more recycled inputs receive a cost advantage, this policy may place some cost disadvantages on companies less capable of readily adjusting their processes to these changes in relative material prices. Finally, while suppliers of recycling material would likely see increased profits on account of increased market demand for their product, producers of virgin plastic resins would likely see declines in their profits on account of increased market competition and decreased demand for their products.
In general, this policy would require a multiyear process to establish the appropriate fee and reward levels, as well as the eventual tax procedures including reward eligibility and fee liability, and all reporting requirements. As reasonably assessed by the committee, 5 years is a likely minimum scenario from introduction to implementation.
After implementation, various metrics can be used to evaluate effectiveness of the policy. Evaluation could benefit from measures of virgin resin sold at various fee-and-reward rates, compared with recycled material sold. After the policy has been in place for a few years, actual effects of specific fees and rewards on prices and quantities of virgin materials and on prices and quantities of recycled materials need to be compared with projected effects, along with actual and projected effects on environmental damages from extraction, landfills, and plastic litter.
As referenced in its statement of task, the committee did not have sufficient data available to recommend specific monetary values of such fees and rewards, so this policy requires further study. Nevertheless, sufficient information is available to outline this policy structure and approach (see Figure 5-15). The committee provides this summarizing conclusion and policy option:
Conclusion 5-1: A revenue-neutral policy that applies a fee for using virgin plastic resins and a reward for using recycled plastic resins would increase the cost-competitiveness of recycled materials relative to virgin inputs and would enhance end markets for recyclable materials.
Key Policy Option 5-1: The U.S. Congress could enact a new revenue-neutral fee-and-reward policy to increase the competitiveness of recycled materials relative to virgin inputs. It would encourage the use of recycled plastic resins in the manufacturing of plastic packaging and single-use products. This policy could comprise two levers:
- First, the Department of the Treasury, in partnership with the U.S. Environmental Protection Agency (EPA), could implement a new fee on the use of virgin plastic resins used in product packaging and in the manufacturing of consumer products, and a corresponding reward for the use of postconsumer recycled plastic resins in those same manufacturing processes. If implemented, this new fee and reward should be paid and received by domestic manufacturers that use plastic resins in their manufacturing processes, should be weight-based, and should be of sufficient value to encourage the use of recycled plastic resins. Market parity can facilitate economic competition between recycled plastic resin and virgin resin.
___________________
8Superfund excise taxes on virgin plastic feedstocks may also help raise these prices (see Box 5-9), but Superfund does not direct those revenues toward rewarding recycled plastic use.
- Second, the Department of the Treasury, in partnership with EPA and U.S. Customs and Border Protection could impose a new border adjustment fee on fully manufactured imported plastic packaging and single-use products, to be paid by the importer of those products.
If pursued, this policy should be revenue neutral for the federal government, such that the total annual sum of fees collected equals the total annual sum of rewards distributed. Furthermore, the Department of the Treasury, in partnership with EPA and other relevant parties, would need to study and identify the appropriate levels of fees and rewards to fully encourage the use of recycled plastic resins while minimizing motivations for changing manufacturing locations.
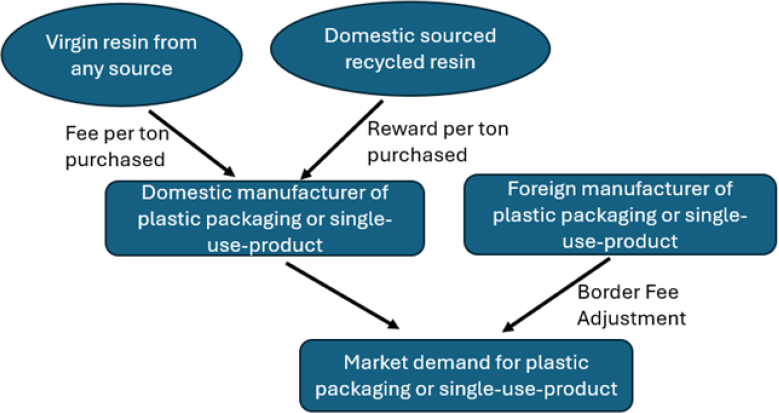
5.5.2 Federal Funding for MSW Recycling and Research
Research could help improve product recyclability and develop new uses for recycled materials, contributing to higher and more stable prices. It could also make existing markets more robust and environmentally beneficial. Some innovations might open markets for materials that are currently difficult or impossible to recycle such as certain types of plastic or make recycling feasible in areas of the country where end markets are currently too thin. Federal research funding could drive advancements in sorting and processing technologies, improve the environmental impact of recyclables, and potentially develop new uses for currently underutilized materials, such as certain plastics. Ideally, such innovation would make the recycling system more sustainable without modifying its current incentives. A model for this goal is in the electricity sector, where innovative activity has made renewable energy production desirable based on market prices alone, without a need to account for environmental benefits.
Research funding would address two fundamental problems. First, only some recovered materials can be sold for high values in end markets. If lower recovery values make the net cost of recyclables processing higher for local governments and businesses, they may face difficulty paying for recycling. Local governments may scale back the availability of curbside recyclables collection or limit access to recycling in rural areas, where it may be too costly to transport materials. Limited end-market options also contribute to volatility in recyclable prices, which makes local governments unwilling to bear the financial risk. In some worst-case conditions, households, firms, and governments spend time and money to separate recyclables, only to have the material landfilled or incinerated anyway; these episodes are not only wasteful but also undercut faith in recycling and willingness to contribute. Second, private incentives for research and
development (R&D) in recycling are insufficient and not well targeted toward improving environmental outcomes. All facets of the economy suffer from insufficient investments in R&D because the knowledge it creates is a public good (see Chapter 3). In addition to this fundamental market failure, private R&D does not tend to focus on finding end uses for materials that reduce environmental costs. This difficulty is illustrated by the recent tensions between desirable market properties of “advanced” or “chemical” recycling of plastics and concerns about their environmental implications (Gracida-Alvarez et al., 2023). Publicly funded research could help steer innovative activity toward end uses with more desirable environmental properties.
The recommended research program could easily fit within existing federal research infrastructure. Private–public partnerships (e.g., Department of Energy’s REMADE) might be possible for some research areas, such as improved design for recycling. Given the national or even global goals that such a program would address, the federal government would be the best level for establishing the program. This policy could be implemented soon through existing funding mechanisms, although the timeline for its effects on the recycling system will be longer. Intermediate metrics for success of this effort might be research articles in journals and new patent activity. A long-term metric would be sustained prices that generate profit for recyclable materials in applications that also generate environmental improvements relative to landfilling or incinerating of these materials. The federal government could also partner with nonprofits, such as the Environmental Research and Education Foundation, that fund research in MSW management.
Conclusion 5-2: Advancing research and development in technology areas relevant to recycling and adopting new technologies in the MSW recycling system can help achieve multiple policy objectives for recycling:
- enhancing end markets for recyclable materials,
- increasing the cost-competitiveness of recycled materials relative to virgin inputs,
- improving the cost-effectiveness of recycling collection and processing,
- decreasing contamination of post-consumer recycling streams, and
- enhancing social and environmental benefits associated with recycling.
Conclusion 5-3: Increased recycling collection may have little benefit without end uses for the collected materials that are environmentally sound and economically valuable. Thus, increased collection needs to be combined with support for end markets, with attention to the environmental implications of end uses.
Key Policy Option 5-2: Federal agencies that fund research related to recycling, including the U.S. Environmental Protection Agency, the Department of Energy, and the National Science Foundation, could enhance investments in research related to recycling systems and recyclable materials. When pursued, this research should prioritize environmentally sound and economically valuable end uses for recycled commodities and other approaches to increase end-use values nationally and internationally. Examples include recyclable design for consumer products, and technologies to reduce contamination of the recycling material stream. Funding from Congress to support this endeavor could include public–private partnerships in manufacturing innovation to increase opportunities for recyclable materials end uses.
5.5.3 The Basel Convention
The Basel Convention on the Control of Transboundary Movements of Hazardous Wastes and Their Disposal is an international agreement aimed at controlling hazardous wastes and their effects on human health and the environment. The United States was an original signatory to the Basel Convention in 1990 and the U.S. Senate provided bipartisan advice and consent approval for the agreement in 1992. However, for a range of legal and political reasons outlined by Yang and Fulton (2017), Congress has never taken the final step to ratify the agreement. Yang and Fulton (2017) make a compelling legal case for why
the United States should ratify the Basel Convention. Beyond the legal argument, ratification has benefits for recyclable materials.
First, the scope of the Basel Convention covers a wide range of trade in wastes beyond just those deemed as hazardous, including those that are covered by this committee’s statement of task. Annex II of the Convention covers household garbage and “other wastes” that are not deemed to be hazardous but are often recyclable or must be disposed of in environmentally safe ways. International trade in these materials is not specifically covered under EPA’s Resource Conservation and Recovery Act or other U.S. domestic law. Ratification of the Basel Convention could help fill loopholes with respect to coverage of trade in nonhazardous recyclable materials.
Second, plastic waste and scrap amendments to the Basel Convention were adopted in 2019 and began to be enforced by parties as of January 1, 2021. Currently, 190 countries and the European Commission are ratified members. Under the new amendment, many plastics now fall under the Convention’s prior notice and consent rules. Not being a party to the convention may inhibit the United States’s ability to trade waste and scrap plastics with most countries. Furthermore, the Convention’s rule that member countries may not engage in trade of waste and scrap with nonmember countries (such as the United States) could limit markets for importing and exporting waste and scrap of recyclable materials beyond plastics, if member countries increasingly enforce the rule. Ratifying of the Basel Convention would ensure that the United States is at the table and can advocate for its interests in future amendments to the Convention; ratifying would also ensure access to trade in recyclable materials markets with 190 member nations.
An important note and potential disadvantage regarding ratification is that in 2019, the Convention adopted the “Basel Ban Amendment,” which prohibits OECD countries from exporting hazardous wastes as defined by the Convention to non-OECD countries for final disposal or for reuse, recycling, or recovery operations. However, recent international policy changes, including China’s National Sword policy and other countries’ subsequent bans on imports of plastics, have limited the impact this amendment would have on U.S. trade should the United States ratify the Basel Convention.
Conclusion 5-4: Full participation in international agreements can help facilitate open markets for trade of recyclable material and grow end markets for recyclable materials collected in recycling programs, as well as enhance social and environmental benefits associated with recycling. In particular, full U.S. ratification of the Basel Convention on the Control of Transboundary Movements of Hazardous Wastes and Their Disposal would better align the United States with international law regarding the transport of wastes covered under the Convention, and ratification would help to facilitate open markets for trade of these recoverable and recyclable materials.
Key Policy Option 5-3: The United States could ratify the Basel Convention because of its assistance in closing loopholes regarding trade in nonhazardous recyclable materials. If pursued, the U.S. Congress should provide necessary domestic authorities and relevant agencies to regulate the full scope of the Basel Convention’s provisions.
REFERENCES
AF&PA (American Forest & Paper Association). 2025. Paper & Cardboard Recycling. https://www.afandpa.org/priorities/recycling.
ASTM. 2022. Standard Practice for Coding Plastic Manufactured Articles for Resin Identification. Standard D7611/D7611M-21. https://www.astm.org/d7611_d7611m-21.html.
Allaway, D. 2024. Presentation to the Committee on Costs and Approaches for Municipal Solid Waste Recycling Programs on April 16, 2024. National Academies of Sciences, Engineering, and Medicine.
Amini, H.R., and D.R. Reinhart. 2011. Regional prediction of long-term landfill gas to energy potential. Waste Management 31(9–10):2020–2026. https://doi.org/10.1016/j.wasman.2011.05.010.
Andini, E., P. Bhalode, E. Gantert, S. Sadula, and D.G. Vlachos. 2024. Chemical recycling of mixed textile waste. Science Advances 10(27):eado6827. https://doi.org/10.1126/sciadv.ado6827.
Arbex, M., and Z. Mahone. 2024. Materials, Technology and Growth: Quantifying the Costs of Circularity. Department of Economics Working Papers. McMaster University. https://sites.google.com/site/zacharymahone/research.
Avery, E., E. Nduagu, E. Vozzola, T.W. Roux and R. Auras. 2025. Polyethylene packaging and alternative materials in the United States: A life cycle assessment. Science of The Total Environment 961:178359.
Badgett, A., and A. Milbrandt. 2021. Food waste disposal and utilization in the United States: A spatial cost benefit analysis. Journal of Cleaner Production 314:128057.
Baldé, C., R. Kuehr, T. Yamamoto, R. McDonald, E. D’Angelo, S. Althaf, G. Bel, O. Deubzer, E. FernandezCubillo, V. Forti, V. Gray, S. Herat, S. Honda, G. Iattoni, D.S. Khetriwal, V.L di Cortemiglia, Y. Lobuntsova, I. Nnorom, N. Pralat, and M. Wagner. 2024. International Telecommunication Union (ITU) and United Nations Institute for Training and Research (UNITAR).
Balkevicius A., M. Sanctuary, and S. Zvirblyte, S. 2020. Fending off waste from the west: The impact of China’s Operation Green Fence on the international waste trade. World Economy 43(10):2742–2761. https://doi.org/10.1111/twec.12949.
Basushi, R., K. Bhuwalka, E. Moore, and R. Kirchain. 2023. Overview of Recycled Plastic Supply and Demand: Identifying the Critical Market Bottlenecks for Closing the Loop. Appendix E in Recycled Plastics in Infrastructure National Academies.
Bening, C.R., J.T. Pruess, and N.U. Blum. 2021. Towards a circular plastics economy: Interacting barriers and contested solutions for flexible packaging recycling. Journal of Cleaner Production 302:126966.
Bishop, G., D. Styles, and P.N.L. Lens. 2020. Recycling of European plastic is a pathway for plastic debris in the ocean. Environment International 142:105893. https://doi.org/10.1016/j.envint.2020.105893.
Bradshaw, S.L., H.A. Aguirre-Villegas, S.E. Boxman, and C.H. Benson. 2025. Material recovery facilities (MRFs) in the United States: Operations, revenue, and the impact of scale. Waste Management 193:317–327.
Brewer, B. 2025. Recycling envy: Ten American cities with excellent practices. https://www.bustedcubicle.com/outside/top-american-cities-recycling.
Butler, J., and P. Hooper. 2005. Dilemmas in optimising the environmental benefit from recycling: A case study of glass container waste management in the UK. Resources, Conservation and Recycling 45(4):331–355.
Chowdhury, H., R. Naim, N. Islam, and F. Alam. 2022. Challenges and prospects of plastic recycling: A review. Journal of Polymers and the Environment 30(3):816–831. https://doi.org/10.1007/s10924-021-02154-7.
Dai, L., R. Ruan, S. You, and H. Lei. 2022. Paths to sustainable plastic waste recycling, Science 377(6609).
Department of State. 2025. Basel Convention on Hazardous Wastes. Office of Environmental Quality. https://www.state.gov/key-topics-office-of-environmental-quality-and-transboundary-issues/basel-convention-on-hazardous-wastes.
EIA (Energy Information Agency). 2024. How much oil is used to make plastic? https://www.eia.gov/tools/faqs/faq.php?id=34&t=6.
Ellen MacArthur Foundation. 2020. The Global Commitment 2020 Progress Report. https://www.ellenmacarthurfoundation.org/global-commitment/overview.
EPA (U.S. Environmental Protection Agency). 2018. Frequent questions about the Hazardous Waste Export-Import Revisions Final Rule. https://www.epa.gov/hwgenerators/frequent-questions-about-hazardous-waste-export-import-revisions-final-rule.
EPA. 2020. Historical Recycled Commodity Values. https://www.epa.gov/sites/default/files/2020-07/documents/historical_commodity_values_07-07-20_fnl_508.pdf.
EPA. 2024a. Facts and Figures About Materials, Waste and Recycling. https://www.epa.gov/facts-and-figures-about-materials-waste-and-recycling Current National Picture, accessed March 3, 2024).
EPA. 2024b. Comprehensive Procurement Guideline (CPG) Program. https://www.epa.gov/smm/comprehensive-procurement-guideline-cpg-program.
European Commission. 2020. A New Circular Economy Action Plan for a Cleaner and More Competitive Europe. https://ec.europa.eu/environment/strategy/circular-economy-action-plan_en.
Eurostat. 2018. Economy-wide material flow accounts – Handbook. Luxembourg: Publications Office of the European Union.
GAO (Government Accountability Office). 2023. Superfund: Status of the Trust Fund and Site Remediation Efforts. https://www.gao.gov/assets/a239185.html.
Geyer, R., B. Kuczenski, T. Zink, and A. Henderson. 2016. Common misconceptions about recycling. Journal of Industrial Ecology 20(5):1010–1017. https://doi.org/10.1111/jiec.12355.
Glass Packaging Institute. 2025. https://www.gpi.org/facts-about-glass.
Glass Recycling Coalition. 2024. Survey Findings: Consumer Expectations for Glass Recycling Remains High. https://www.glassrecycles.org/news/2023-glass-recycling-survey-findings-released.
Goodwin, L. 2023. The Global Benefits of Reducing Food Loss and Waste, and How to Do It. https://www.wri.org/insights/reducing-food-loss-and-food-waste.
Gracida-Alvarez, U.R., P.T. Benavides, L. Uisung, and M. Wang. 2023. Life-cycle analysis of recycling of post-use plastic to plastic via pyrolysis. https://doi.org/10.1016/j.jclepro.2023.138867.
Igini, M. 2023. Thailand Announces Ban on Plastic Waste Imports by 2025. https://earth.org/thailand-ban-plastic-imports.
IRS (Internal Revenue Service). 2023. Superfund chemical excise taxes. https://www.irs.gov/businesses/small-businesses-self-employed/superfund-chemical-excise-taxes.
Ishimura, Y., D. Ichinose, and K. Nomura. 2024. Plastic waste trade and international agreements. https://ssrn.com/abstract=4845055.
Katz, C. 2019. Piling up: How China’s ban on importing waste has stalled global recycling. Yale Environment 360. https://e360.yale.edu/features/piling-up-how-chinas-ban-on-importing-waste-has-stalled-global-recycling.
Kellenberg, D. 2012. Trading wastes. Journal of Environmental Economics and Management 64(1):68–87. https://doi.org/10.1016/j.jeem.2012.02.003.
Kim, Y., J. Kang, and H. Chun. 2022. Is online shopping packaging waste a threat to the environment? Economics Letters 214:110398.
King County Solid Waste Division. 2023. NextCycle Washington: Circular Accelerator Program Overview. https://kingcounty.gov.
Kiran, E.U., A.P. Trzcinski, W.J. Ng, and Y. Liu. 2014. Bioconversion of food waste to energy: A review. Fuel 134:389–399. https://doi.org/10.1016/j.fuel.2014.05.074.
Kumar, V. 2017. Recycling of waste and used papers: A useful contribution in conservation of environment: A case study. Asian Journal of Water, Environment and Pollution 14(4):31–36.
Le Pera, A., M. Sellaro, G. Grande, E. Bencivenni, and M. Migliori. 2023. Effect of quality of separately collected glass, paper plus cardboard and lightweight packaging waste on environmental, energetic and economic sustainability of the material recovery facility operations. Journal of Cleaner Production 425:1238973.
Lorang, E., A. Lobianco, and P. Delacote. 2023. Increasing paper and cardboard recycling: Impacts on the forest sector and carbon emissions. Environmental Modeling & Assessment 28:189–200. https://doi.org/10.1007/s10666-022-09850-5.
Mann, R. 2024. Environmental justice, plastic, and tax. Human Rights Magazine 50(1/2). https://www.americanbar.org/groups/crsj/publications/human_rights_magazine_home/environmental-energy-climate-justice/environmental-justice-plastic-and-tax.
McCarthy, J. 1994. The trade implications of recycled content in newsprint: The US view. In Life-Cycle Management and Trade. Paris: Organisation for Economic Co-operation and Development.
Metcalf, G.E. 2018. The impact of removing tax preferences for US oil and natural gas production: Measuring tax subsidies by an equivalent price impact approach. Journal of the Association of Environmental and Resource Economists 5(1):1–37.
Milbrandt, A., K. Coney, A. Badgett, and G.T. Beckham. 2022. Quantification and evaluation of plastic waste in the United States. Resources, Conservation and Recycling 83. https://doi.org/10.1016/j.resconrec.2022.106363.
Milbrandt, A., J. Zuboy, K. Coney, and A. Badgett. 2024. Paper and cardboard waste in the United States: Geographic, market, and energy assessment. Waste Management Bulletin 2.1:21–28.
Miller, C. 2024. Presentation to the Committee on Costs and Approaches for Municipal Solid Waste Recycling Programs. National Academies of Sciences, Engineering, and Medicine.
Moore, J., D. Folkinshteyn, and J.P. Howell. 2022. The potential for exchange-traded futures on recycled materials to improve recycling efficiency. Investment Management and Financial Innovations 19(3):93–104. https://doi.org/10.21511/imfi.19(3).2022.09.
NAPCOR (National Association for PET Container Resources). 2023. 2023 US PET Bottle Recycling Rate Reaches Highest Level in Decades; Recycled Pet Content in US Bottles Reaches Highest Level Ever. https://napcor.com/news/2023-pet-bottle-recycling-reach-new-heights.
NASEM (National Academies of Sciences, Engineering, and Medicine). 2023. Recycled plastics in infrastructure: Current practices, understanding, and opportunities. Washington, DC: The National Academies Press. https://doi.org/10.17226/27172.
National Solid Wastes Management Association. 1991. Recycling in the States: 1990 Review. https://p2infohouse.org/ref/30/29711.pdf.
NERC (Northeast Recycling Council). 2021. Domestic Recycled Paper Capacity Increases. https://nerc.org/documents/Summary%20of%20Announced%20Increased%20Capacity%20to%20use%20Recycled%20Paper%20May%202021.pdf.
NERC. 2023. Recycled glass used as alternative daily cover in the Northeast US and Quebec. https://nerc.org/documents/Glass/ADC%20Report%20Final.pdf.
NERC. 2024. Northeast Materials Recovery Facilities (MRFs) Commodity Values Report. https://www.nerc.org/quarterly-mrf-reports.
ODEQ (Oregon Department of Environmental Quality). 2024. 2022 Oregon Material Recovery and Waste Generation Rates Report. https://www.oregon.gov/deq/recycling/Documents/2022MRWGRatesReport.pdf.
OECD (Organisation for Economic Co-operation and Development). 2022. Plastic pollution is growing relentlessly as waste management and recycling fall short, says OECD. https://www.oecd.org/en/about/news/press-releases/2022/02/plastic-pollution-is-growing-relentlessly-as-waste-management-and-recycling-fallshort.html.
OECD. 2024. Data Explorer: Environment and Climate Change Technology and Innovation. https://data-explorer.oecd.org.
Olawade, D.B., O.Z. Wada, O.T. Ore, A. Clement David-Olawade, D.T. Esan, B.I. Egbewole, and J. Ling. 2024. Trends of solid waste generation during COVID-19 Pandemic: A review. Waste Management Bulletin 1(4):93–103. https://doi.org/10.1016/j.wmb.2023.10.002.
Palmer, K., and M. Walls. 1997. Optimal policies for solid waste disposal: Taxes, subsidies, and standards. Journal of Public Economics 65(2):193–205. https://doi.org/10.1016/S0047-2727(97)00028-5.
Plastics Europe. 2021. Plastics – the Facts 2021: An Analysis of European Plastics Production, Demand and Waste Data. Pub. L. 117-169.
RCC (Retail Compliance Center). 2023. Mandatory Recycled Content Laws for Packaging. https://www.rila.org/getmedia/f4b51c8f-80c7-46c0-932b-6a40f8fe079c/Mandatory-Recycled-Content-Laws-for-Packaging-11-23.pdf?ext=.pdf.
Reinhart, D., J. Chen, and M. Golgoz. 2023. Life-Cycle Assessments of Residential Curbside Collection Programs for Recycling Quality Improvement. Final report to the Hinkley Center for Solid and Hazardous Waste Management.
Resource Recycling. 2022. From Green Fence to Red Alert: A China Timeline. https://resource-recycling.com/recycling/2018/02/13/green-fence-red-alert-china-timeline.
Runsewe, T., O. Bafail, and N. Celik. 2020. Performance Analysis of Waste Collection Programs in Material Recovery Facilities. IIE Annual Conference Proceedings 1–6. https://www.proquest.com/scholarly-journals/performance-analysis-waste-collection-programs/docview/2522430103/se-2.
Sigman, H. 1995. A comparison of public policies for lead recycling. Rand Journal of Economics 26:452–478.
Sigman, H., and R. Strow. 2024. China’s waste import ban and US solid waste management: Effects of the loss of a waste haven. Journal of the Association of Environmental and Resource Economists 11(6):1527–1557. https://doi.org/10.1086/729899.
SP Global Insights. 2024. Mexico joins plastic sustainability battleground in US West Coast. https://www.spglobal.com/commodity-insights/en/news-research/blog/chemicals/072624-mexico-joins-plastic-sustainability-battleground-in-us-west-coast.
Staub, C. 2024. RPET imports driving ‘perfect storm’ for reclaimers. Resource Recycling, March 26, https://resource-recycling.com/plastics/2024/03/26/rpet-imports-driving-perfect-storm-for-reclaimers.
Taylor, R., H. Williams, and S. Zhang. 2025. Plastic Waste Trade & Coastal Litter: Evidence from Citizen Science Data. https://ssrn.com/abstract=4918045.
The Aluminum Association. 2024. Circular Economy Solution. https://www.aluminum.org/Recycling.
Timpane. 2024. Presentation to the Committee on Costs and Approaches for Municipal Solid Waste Recycling Programs on April 16, 2024. National Academies of Sciences, Engineering, and Medicine.
UNEP (United Nations Environment Programme). 2021. Turning Off the Tap: How the World Can End Plastic Pollution and Create a Circular Economy. United Nations Environment Programme.
Wayman, E. 2023. Recycling rare-earth elements is hard—but worth it. https://www.snexplores.org/article/recycling-rare-earth-elements-hard-reuse-greener-technology.
Yang, T., and C.S. Fulton. 2016. The Case for U.S. Ratification of the Basel Convention on Hazardous Waste (February 28, 2016). Santa Clara Univ. Legal Studies Research Paper No. 1-15. http://dx.doi.org/10.2139/ssrn.2688173.
Washington State Department of Ecology. 2023. NextCycle Washington – Supporting a Circular Economy. https://ecology.wa.gov.
Washington State Recycling Association. 2022. Statewide Initiatives in Recycling Market Development: Washington’s Approach. https://wsra.net.


