Municipal Solid Waste Recycling in the United States: Analysis of Current and Alternative Approaches (2025)
Chapter: 4 Direct Costs and Financing of Recycling Programs
4
Direct Costs and Financing of Recycling Programs
Summary of Key Messages
- Costs of recycling: Although local governments and private parties pay for most costs of recycling, they experience only a small fraction of its global and regional benefits; thus, incentives are weak for these parties to maintain or increase recycling.
- Volatility and market disruptions: Volatility in end markets for recyclables can undermine the economic sustainability of recycling programs.
- Traditional financing approaches: Financing for residential recycling in the United States relies largely on local governments, with little contribution from state or federal sources. When businesses recycle, they typically pay for recycling services that are provided by private waste management companies.
- Extended producer responsibility (EPR): As an emerging financing model, EPR alleviates financial burden on local governments by shifting residential recycling costs to producers and, indirectly, to households that purchase their products. If properly designed through “eco-modulation,” these systems may provide incentives to producers to reduce packaging volumes and increase recyclability of packaging and products. Existing EPR laws vary greatly by state.
- Deposit-return systems (DRSs): DRSs encourage direct recycling by consumers and can lead to reduced litter and high recycling rates of the products covered by the policy (e.g., beverage containers). However, their effectiveness is limited to covered products. The adoption of new DRS policies may decrease revenues of existing curbside programs and materials recovery facilities (MRFs), which could undermine the economic viability of those programs and therefore the recycling of materials not covered by the DRS. This tradeoff could be managed with alternative financing approaches for existing curbside recycling programs (e.g., via EPR).
- Investments in MRFs: Investing in MRF technology is important for cost-effective recycling, as advanced sorting and processing equipment reduces per-ton processing costs and increases the quality of recyclable materials.
Local governments and private entities bear the primary financial burden of recycling in the United States, yet they receive only a fraction of the broader environmental and economic benefits. Spending on curbside and other recycling systems involves costs of collection, such as trucks, labor, and fuel, and costs of processing, sometimes at capital-intensive materials recovery facilities (MRFs). This spending often exceeds the revenue earned from selling recyclable commodities, straining municipal budgets and discouraging program expansion. Emerging financing approaches, such as extended producer responsibility (EPR), show promise in redistributing costs and stabilizing material quality. This chapter examines the costs and financing sources for recycling programs nationwide, with particular emphasis on curbside recycling as the dominant mode of collection (see Figure 2-1 in Chapter 2).
4.1 CURBSIDE RECYCLING PROGRAMS
Many different waste and recycling systems operate throughout the United States, which entail multiple collection and processing stages. The most common recycling system for households is curbside recycling. An estimated 53 percent of the U.S. population—about 176 million persons living in approximately 69.8 million households—has curbside recycling services provided to their homes automatically as
a part of the residential solid waste management systems in their communities (The Recycling Partnership, 2020a). Furthermore, most of these residents receive single-stream recyclables collection service, meaning that they do not separate recyclable materials from each other but place them in a commingled fashion in a single recycling collection container, which is wheeled or carried to the curb by the resident on the collection day. In contrast, recycling systems for commercial establishments may be single stream or have different collection for specific types of materials. In many rural communities, households do not have curbside collection but may have access to recycling drop-off locations. The discussion of local government costs in this chapter focuses on curbside recycling because it is the dominant collection method and because limited cost data are available for other forms of collection.
Curbside recycling involves the provision of two services: (1) collection by municipal governments or private companies and (2) processing of the collected recyclables by municipal governments, solid waste authorities, and/or private companies. This chapter first distinguishes between these collection and processing costs and then considers the revenues from recycled commodities that may help offset the processing costs. Finally, these categories are combined to compare curbside recycling costs with costs of disposing of these materials in other ways.
4.1.1 Curbside Recycling Collection Costs
Curbside collection costs include expenses for bins provided to households and the costs of owning, operating, and maintaining trucks for collection. These costs (e.g., labor, fuel prices, equipment purchases) vary by state and within states across the country. Rates are calculated based on the number of households served per crew per day and/or tons collected per day by each crew. Communities with high participation rates may achieve lower average costs per ton because of efficient truck and labor use. Labor costs are lower in the South than in many urban areas of the Northeast and the West Coast, which are often unionized. Capital costs associated with trucks and equipment yards make up a significant portion of the cost of collecting waste and recyclables from households and businesses in the United States. While most regions of the country have some cities with extensive recycling programs, recycling services in rural areas may not be integrated into broader solid waste programs.
A full picture of these costs across the country is not available, but a few studies provide details on these costs at specific locations. In North Carolina, a long-term survey provides detailed data on recycling and refuse collection expenditures for a set of municipalities (UNC School of Government, 2024). Most of the communities studied provide single-stream recycling collection services to single-family residents on a biweekly basis. In 2022–2023, the total cost associated with these services—including the capital costs of the collection vehicles and containers—averaged $45 per household per year. The North Carolina data also provide the opportunity to calculate costs per ton of recyclables collected (and not just per household). These data show an average collection cost of $275 per ton in 2022–2023 (UNC School of Government, 2024). Reflecting economies of scale, communities with higher recycling set-out rates had lower average costs per ton. For Florida, Anshassi and Townsend (2024) provide similar figures. Across the six counties they studied in 2021, collection costs for curbside recycled averaged $49 per household, similar to the North Carolina values. The Florida costs ranged from $23 per household to $81 per household (Anshassi and Townsend, 2024).
Additionally, Anshassi and Townsend (2023) used Florida data to estimate the average costs for a typical U.S. residential household cost for separate recyclables collection. They found an average cost of $45 per household per year. Among the factors they considered are the number of households at one stop, participation rate, collection frequency, number of working days per week, and working hours per day per vehicle. The collection costs change as a function of mass and composition (for both garbage and recyclables stream) as well as the frequency of the collection service (which is typically weekly or biweekly). The primary factors that vary by region include the waste compaction density, recycling participation rate, total masses collected and recycled, and number of households participating (Anshassi and Townsend, 2023).
4.1.2 Curbside Recycling Processing Costs
Recyclables collected at the curb from single-family residences are typically processed at MRFs. Figure 4-1 shows recent trends of processing costs per ton on waste from MRFs in the Northeast region (10 states).
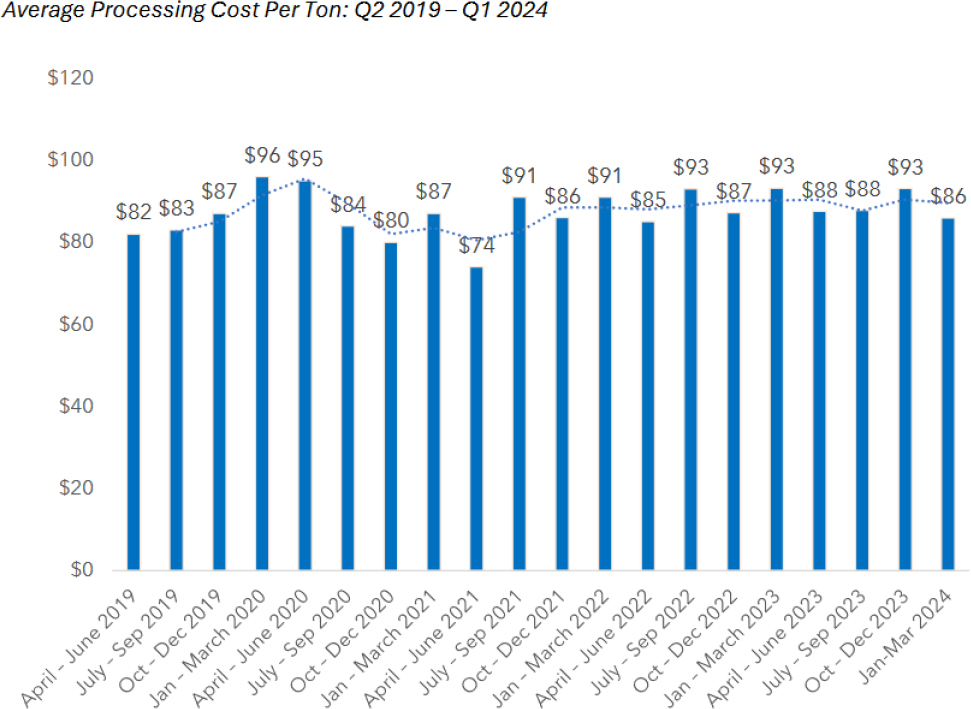
NOTE: Data are as reported by facilities and underlying methodologies may vary.
SOURCE: NERC, 2024.
A review of commingled recycling costs completed for the Oregon Department of Environmental Quality audited a small number of MRFs in Oregon using their actual 2022 fixed and operating costs (Crowe LLP, 2024). These MRFs ranged from small, labor-intensive facilities to larger MRFs with investments in some newer technologies, although none are as advanced as the newest MRFs being built in the United States (see Box 2-5 in Chapter 2). The average cost of processing commingled recyclables through the single-stream MRFs in Oregon in 2022 was $129/ton (Crowe LLP, 2024).
Processing prices can also vary in response to international policy changes. China and other countries have increasingly imposed restrictions on the levels of contamination allowable in imported recyclables (Resource Recycling, 2022). The private company WM estimated that these restrictions have increased processing costs by about 15 percent—or about $13 per ton—across its 43 single-stream MRFs. These increased costs cover labor needs and investments in sorting equipment to meet the new contamination standards.
Investments in new technology have large initial costs that enable MRFs to process each additional ton of recycling less expensively and more efficiently (see Chapter 3 for more on economies of scale). Over
time, advancements in recycling technologies may increase sales of materials by raising the quality of the sorted recyclables.
4.1.3 Curbside Recycling Revenues
The net costs of the curbside recycling programs depend not only on the direct costs of collection and processing but also on the revenues received from the recyclable commodities at the end of processing. These values fluctuate with the macroeconomic conditions, product demand, material quality, transportation costs, and price of competing resources. Demand for recycled commodities reflects their value to manufacturers who use them, so prices indicate some of the current value of the recycled material. Other values, such as environmental improvements, are outside of the market and may not be captured by prices. Chapter 5 presents more information on individual recycled commodity prices.
Figure 4-2 shows estimated revenues that MRFs in the Northeast received from selling processed materials.1 Comparing the revenues in Figure 4-2 with the processing costs in Figure 4-1 demonstrates that revenue sometimes covers processing costs (e.g., in 2021 and 2022), but other times it does not. Periods when end-market revenues did not cover costs include 2019, shortly after China’s National Sword Policy was instituted (see Chapter 5), and much of 2023, which did not feature these trade disruptions. MRFs may still make profits in years when the materials revenue is lower than their processing costs. because of the processing fees paid to them by local governments and third-party collectors (Anshassi and Townsend, 2024).
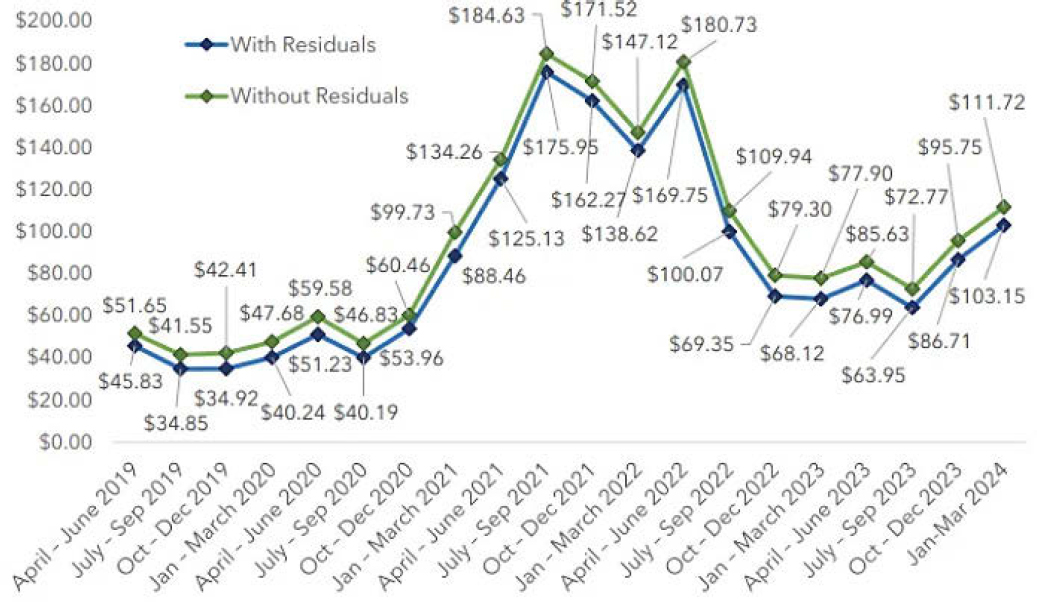
NOTE: Data are as reported by facilities and underlying methodologies may vary.
SOURCE: NERC, 2024.
___________________
1Although these values are specific to this region and time period, they appear to be representative. Using the average prices of recyclables reported by the U.S. Environmental Protection Agency for 2009–2018 (see Figure 5-6 in Chapter 5) and typical material shares reported by The Recycling Partnership (2004) yields a revenue estimate of $167 per ton (not inflation-adjusted), within the range shown for the Northeast in Figure 4-2.
4.1.4 Overall System Costs for Curbside Recycling
Ignoring external costs for now, the direct costs above include collection plus processing costs minus revenue received from recycling. Putting these direct costs together provides an overall picture of the net financial costs of curbside recycling. A review of rates in several states highlights the variability of these overall costs across the country.
National Estimates
Anshassi and Townsend (2024) estimated government expenditures (net of commodity revenues) on waste and recycling systems in regions across the United States (see Figure 4-3). They found that these expenditures vary based on MRF processing fees, revenue-sharing structures with MRFs (described in the figure by different contract letter types), and market conditions for recyclables. The lowest annual household waste management expenditures were in 2011, during peak recycling markets, while the highest expenditures occurred in 2020, during a market low. Expenditures ranged from $124 to $241 per household per year in 2011, $166 to $267 in 2020, and $154 to $243 in 2021 (Anshassi and Townsend, 2024). Across all years and regions, the lowest expenditures were associated with Contract A, which featured a high revenue share of nearly 97 percent and a processing fee of $85 per ton (see Figure 4-3). The Northwest and Northeast regions had the lowest expenditures, while the Southeast region had the highest. In these estimates, garbage and recyclables collection costs accounted for 53–78 percent of total household waste management costs (excluding recyclables revenue), while landfill and waste-to-energy disposal made up 19–34 percent, and MRF processing (once commodity revenue in subtracted) ranged from less than 1 percent to 23 percent (Anshassi and Townsend, 2024).
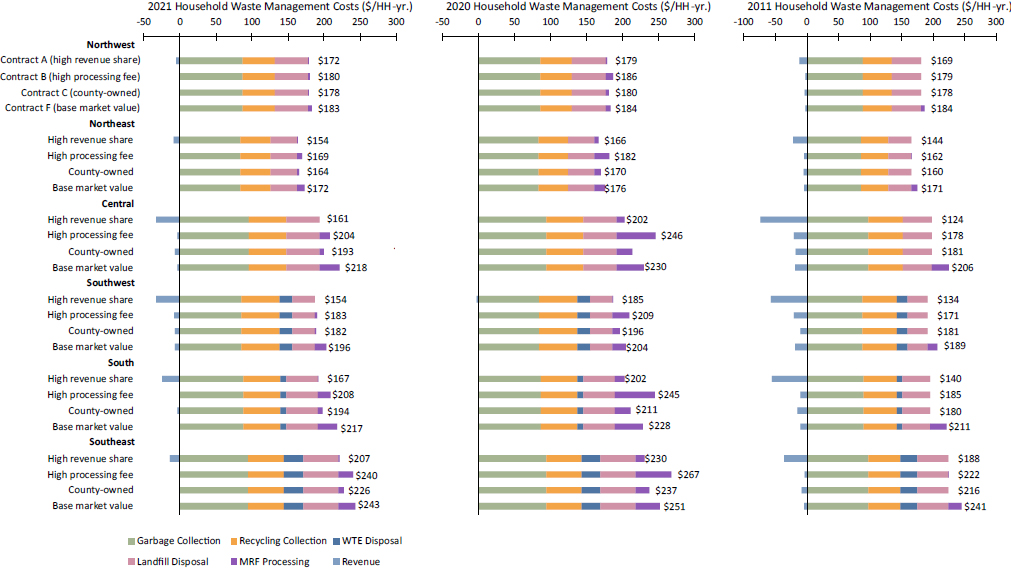
NOTES: Costs for each region based on four types of contracts with MRFs: Contract A (referred to as high revenue share), Contract B (high processing fee), Contract C (county-owned), and Contract F (base market value). HH = household; MRF = materials recovery facility; WTE = waste-to-energy.
SOURCE: Anshassi and Townsend, 2024.
California. The state of California recycles 20 percent of the volume of recyclables collected in the entire United States. Regulations require separate diversion of waste, recycling, and organics, which means that multiple trucks service each house each week. Recycling requirements and fees on waste disposal increase the overall cost to the customers. With few exceptions, all costs are bundled into a monthly garbage charge that includes recycling at no additional visible cost to customers.
The cost of waste and recycling in California is higher than in other areas of the country because of this regulatory environment. These costs appear in fees for consumers. For example, in San Jose, households are charged $53 per month, or $641 per year, for residential solid waste management and recycling.2 In San Mateo, this service costs $42 per month.3
Washington. Washington is one of only two states that regulate waste and recycling rates (West Virginia is the other). While incorporated cities can contract with private companies for services or provide municipal services, customer rates in unincorporated areas of the state are set by Washington’s Utilities and Transportation Commission. The annual cost for all waste and recycling services in Washington State ranges from $406 to $500/year across various urban and suburban areas of the state. The recycling portion of these rates is highly scrutinized, and regulated rates range from $103 to $128 per year per household.
Although, existing literature does not provide a systematic comparison of the costs of recycling and disposal. Table 4-1 shows the per ton costs for disposal and for recycling in North Carolina (not per household monthly costs as above). As reported in the table, collection accounted for most of the cost of both recycling (73 percent) and disposal (80 percent) (EREF, 2024; NERC, 2024). In North Carolina in 2023, average costs per ton recycled exceed the cost of disposing of a ton, even when revenues from end markets were high for the year. These cost differences do not indicate the savings from shifting materials from recycling to disposal (or the costs of shifting them from disposal to recycling), because they do not capture possible increasing or decreasing returns to scale for either activity. As with the per-household costs, they only capture average costs of current levels of recycling and disposal.
These cost estimates are context and time dependent and do not apply to all curbside recycling programs. In some areas of the United States, such as the Northeast, where landfill costs are high, curbside recycling may have lower average costs than landfilling. In addition, as Figure 4-2 shows, recycled commodity revenue is sometimes much higher than in 2023, which would make the net per-ton cost of recycling more favorable. However, even when average costs (net of commodity revenues) are lower per ton for recycling than for disposal, curbside recycling may not save towns money because of the duplication involved in sending both a garbage and a recycling truck to households every week or every other week.
TABLE 4-1 Costs of Curbside Recycling and Residential Refuse Collection in North Carolina, 2023
| Curbside Recycling | Average Cost ($/ton) |
|---|---|
| Collection Costs | $270 |
| Processing Costs | $100 |
| Revenue from Sale | –$70 to –$110 |
| Net Recycling Costs | $260–$300 |
| Refuse | |
| Collection Costs | $160 |
| Disposal Costs | $40 |
| All Refuse Costs Total | $200 |
SOURCES: Data from North Carolina Benchmark Project 2.0 for collection and processing costs; NERC (2024) for 2023 revenues; EREF (2024) for disposal costs in North Carolina.
___________________
2See https://www.sanjoseca.gov/your-government/departments-offices/environmental-services/recycling-garbage/residents/garbage-recycling-rates-billing.
3See https://www.cityofsanmateo.org/DocumentCenter/View/89316/2022-Solid-Waste-Notice-of-Public-Hearing.
The cost discussion thus far considers only the “on-budget” costs of recycling. Even single-stream recycling requires input of household time and effort not included here, although it is a real resource cost to consider in assessing these programs. Table 6-1 in Chapter 6 presents estimates that suggest household time costs may be either on par with or several times higher than the local government’s collection costs for recycling. Although households may also have time costs for setting out waste, those costs are likely much lower. In addition, none of these costs are full social costs of recycling or waste management because they recognize market costs from energy and materials use and do not account for other external environmental impacts (see Chapter 7). Box 4-1 describes an effort to calculate this broader definition of costs by the State of Oregon.
BOX 4-1
Case Study: Incorporating Social and Environmental Costs in Oregon
As the result of a long stakeholder process, Oregon adopted a 2050 Vision for Materials Management in 2012 (ODEQ, 2012), taking a unique approach to prioritizing material management in the state. As part of the State’s extended producer responsibility program (EPR) implementation, the Oregon Department of Environmental Quality (ODEQ) evaluated a range of materials, considering their commodity value and end markets, as well as the cost of handling each material. Recyclables included on Oregon’s new Uniform Recycling List (required for curbside recycling) were all subject to a review of direct (e.g., infrastructure, labor, fuel) and indirect costs. These indirect costs include impacts from climate change; loss of ecosystem services; and illness, disability, and death (and associated health care costs). Reducing the need for extraction and production, recycling—if done well—creates “savings” of negative indirect costs, in the same way the commodity revenues create savings with negative direct costs (ODEQ, 2023a).
Direct costs of disposal other than recycling ranged from $983 to $1030 per ton as indicated by the modeling, while indirect social and environmental costs were $495–$595 per ton (ODEQ, 2023b). Recycling can perform better than disposal criteria for the material to be added to the Uniform Recycling List and included in Oregon’s new producer-funded recycling programs.
Once implemented, the state’s EPR program will pass along many of the financial costs of recycling to the producers. In Oregon, the cost of processing and marketing, rural drop-off collection, contamination management, education and outreach, and other one-time infrastructure costs are part of the EPR program covered by producers.
The discussion of recycling costs above concerns curbside programs, which are not universally available to households. When households have access only to drop-off programs, the on-budget costs of the programs are probably much lower, although estimates are not available. However, households’ time and effort costs are much higher for drop-off programs than for curbside recycling, so the overall costs of collection under these programs may be higher and participation lower.
Recycling costs fluctuate over time and vary over space for many reasons, including the cost of infrastructure, labor, and fuel, and variations in housing density and transportation distances. In addition, different municipalities offer different services and impose varying participation requirements, that also generate heterogeneity in costs. The regulatory environment may also be an important source of variation in costs, because some cities keep recycling costs low while burdening disposal with fees. Expanding household participation in recycling can help reduce the costs per ton of material recycled and thus help make recycling more competitive with landfilling.
While the data presented in this chapter thus far display recent, contemporary, and potential near-term costs of recycling programs, it is important to note potential future changes (such as developments in renewable energy seen in Box 4-2) that could have implications for direct costs of recycling and overall waste management systems.
BOX 4-2
Waste and Recycling Streams from Renewable Energy Technologies
Some installments of renewable energy technology have already reached the end of their useful life, which comes with attendant waste that largely ends up in landfills. The projected scale of waste from solar and wind energy entering landfills will be on the order of 10 million tons in the United States by 2050 (Cooperman et al., 2021; Duran et al., 2021). This waste may have ancillary economic impacts on future municipal solid waste management as it may affect the capacity and operating costs of landfills.
Solar panels contain materials (e.g., silver) that can be valuable but are present in relatively low concentrations. Some of these components can be toxic and problematic in landfills but may also be problematic for recycling. Life cycle assessments that can evaluate the environmental benefits of recycling versus landfilling and accounting for several different factors and scenarios (Smith et al., 2024).
While some materials in wind turbines can be recovered relatively easily, the blades are made of composite materials that are not currently easily recycled. They can be used as filler in concrete but are otherwise burned or landfilled. In landfills, the turbine blades can cause other complications, as their size and rigidity make them difficult to pack efficiently.
To increase the recovery of materials from renewable energy technology waste streams, more infrastructure is needed for recycling; incentives or bans are needed to prevent landfilling; and, more broadly, proactive planning is needed for end of life when developing a renewable energy installation (Duran et al., 2021).
4.2 TRADITIONAL FINANCING APPROACHES
Financing of the recycling system in the United States comes from both private and public sources. Typically, local governments, households, and commercial establishments pay for recycling collection and processing. MRFs and other recycling processors receive revenue from end markets for recycled materials and from gate tipping fees (fee per ton paid for processing by governments and collectors). This section discusses traditional financing approaches to cover the costs of recycling collection and processing that exceed the money earned from end markets, which covers only a small share of the total costs of recycling and processing.
4.2.1 Public Financing
Almost all government financing of residential recycling in the United States comes from local governments (cities, towns, and counties), with at most small contributions from higher levels of government. Some local governments use a “general fund” approach, where recycling does not have a dedicated revenue source and is funded along with other categories of expenditure. Other municipalities rely on an “enterprise fund” approach, whereby the municipality collects fees for recycling and garbage collection, perhaps as an item on property tax bills or utility bills or as an explicit charge for businesses. For residential recycling, the general fund approach is more common than the enterprise fund approach (Sheahan, 2024). Governments may use general funds for residential collection but collect fees from commercial establishments.
Local governments pay for recycling at all stages of the process. For recycling collection, they may use their own employees or contract with a recycling collector. They pay gate tip fees for processing the recyclables they collect and implicitly or explicitly pay these fees as part of their contract with a recycling collector. In addition, when recycling drop-off programs are available, either in place of or as supplement to curbside collection, they are likely to be funded by local governments. Recent data are lacking, but in 1995, governments funded the programs in 77 percent of communities with drop-off services (Walls et al., 2003). Finally, about 20 percent of MRFs were publicly owned in 2020, often by county governments (Anshassi and Townsend, 2024). These public MRFs often collect processing fees from private collectors and other governments that use their services. However, the governments that own them may use general funds to cover some costs.
In the United States, state and the federal government provide little financial support for recycling. For all solid waste management, average state spending in 2021, was $4 per capita compared with $86 per capita for local government spending (U.S. Census Bureau, 2024). Figures for recycling specifically are not available but are likely to have a similar breakdown. Recent years have seen some of the first significant federal expenditures on recycling (see Box 4-3).
4.2.2 Private Financing
Commercial establishments and households may also pay privately to have their waste collected and processed. This private funding for recycling collection falls into two categories: (1) With a “franchise” provision, the municipality requires households or establishments to subscribe directly with private firms that provide recycling services at rates and service characteristics that follow a contract with the government. Household participation in these services may be mandatory or voluntary (subscription), depending on city policy. (2) In other communities, some households may subscribe to private recycling services independently, without a publicly negotiated contract. In 2015–2016, 19 percent of residences with curbside collection had subscription-based services, which could include franchise or individually contracted services (Sustainable Package Coalition, 2016).4 Walls and colleagues (2005) found that residential private collection arrangements become much less common as population density rises.
BOX 4-3
U.S. Environmental Protection Agency Grant Programs
In 2020, Congress appropriated to the U.S. Environmental Protection Agency (EPA) $350 million for fiscal years 2022–2026 to improve waste management infrastructure and recycling (in the authorized Save Our Seas 2.0 Act of 2020 [Pub. L. 116-224] and the Infrastructure Investment and Jobs Act [i.e., Bipartisan Infrastructure Law, Pub. L. 117-58]). These funds were administered in two grant programs and one program to improve safe handling of used batteries (EPA, 2022):
- Solid Waste Infrastructure for Recycling (SWIFR) Grant Program ($275 million)
- Recycling Education and Outreach (REO) Grant Program ($75 million)
- Battery Collection Best Practices and Voluntary Battery Labeling Guidelines ($25 million)
The SWIFR grant program entails separate funding opportunities for states and territories; communities; and tribes and intertribal consortia. These grants are intended to support implementation of the National Recycling Strategy “to improve post-consumer materials management and infrastructure; support improvements to local post-consumer materials management and recycling programs; and assist local waste management authorities in making improvements to local waste management systems” (EPA, 2025b, para. 4). Awards to tribes and intertribal consortia can improve municipal solid waste management, including recycling management, and have mostly been used for materials recovery facility infrastructure (EPA, 2025a). Examples of infrastructure projects funded through SWIFR include $4 million awarded to Baltimore, Maryland, for a solar-powered compost facility and $3.3 million to Durham Country, North Carolina, for redesign of a drop-off station. States and territories receive funding to develop or improve on data collection or plan management rather than for specific investments or operational expenses.
The two other programs address social and behavioral considerations. The REO program focuses on reduction of food waste; expansion of the market for compost; and education and outreach to households. The program addressing collection of batteries primarily entails working sessions to develop best practices and guidelines (EPA, 2024).
Private collection arrangements are much more common for commercial establishments than for residences. In 1995, 47 percent of communities relied on private recycling arrangements for commercial establishments and another 6 percent had franchise arrangements (Walls et al., 2003). Commercial waste
___________________
473 percent of residences had curbside collection and 14 percent overall had subscription services.
makes up an estimated 55 percent of generated municipal solid waste (MSW) (EPA, 2013). Thus, private payment for recycling as a service probably contributes well over one-third of revenue for collection and processing of MSW recycling in the United States.
4.3 EVALUATING TRADITIONAL FINANCING FOR RECYCLING
The mix of financing for collection and processing of recycling (local government and private expenditures by households and firms) emerged as an extension of traditional garbage collection rather than as an active policy choice. Policymakers who seek improvements to the recycling system need to consider the strengths and weaknesses of this financial approach. This section discusses four considerations: incentives for recycling, cost control, risk management, and the distribution of financial burdens.
4.3.1 Incentives for Recycling
The current system for financing recycling both aligns and misaligns incentives with the social and environmental values of recycling. Incentives are aligned in that many of the benefits and costs of recycling vary by geographic location (see Chapter 3). Thus, if a local government receives greater benefits from recycling, it may be willing to bear higher financial costs. In contrast, financing recycling at a more centralized level, such as through the alternative financing approaches discussed later in this chapter, can reduce local control over this decision and reduce variability by community.
For example, a major benefit of recycling is avoiding the cost of disposal by landfill and incineration. Communities across the country face vastly different costs for disposal. The Northeast region had the highest waste disposal costs, with average tipping fees of $84 per ton in 2023, whereas the regional average in the Southeast was only $42 per ton (EREF, 2024). Thus, a government in the Northeast might be willing to spend twice as much on recycling (to avoid disposal costs) as would a government in the Southeast. In addition, communities vary in the value they attach to recycling (see Chapter 6); with locally organized and financed recycling, local governments can respond to the strength of local demand for recycling service.
On the other hand, many other benefits of recycling fall outside the horizon of a local government. These benefits include any gains from avoiding external costs, such as virgin material mining and production and global and regional pollution (e.g., methane from landfilling and air emissions of dioxins from incineration) (see Chapter 3). Local governments have limited direct interest in avoiding external costs because their populations are a small share of those affected. Thus, reducing external costs may not motivate local governments to offer recycling or to make it easy or extensive.
The concerns about alignment of incentives are even stronger for private financing of recycling. A commercial establishment that is paying privately for waste collection has only the incentive to sign up for recycling to reduce its own costs. Some public policy would be needed to give both local governments and private parties incentives to consider broader environmental benefits of recycling. Alternative financing approaches such as deposit-return systems, as discussed later in this chapter, can help fill in some of these missing incentives.
4.3.2 Cost Control
The current financing system provides opportunities for control of recycling costs. Almost half of local governments provide recycling collection services themselves, but 52 percent of local governments in 2017 contracted with private firms to provide recycling collection (ICMA, 2019). Because they pay for the recycling services either way, local governments have strong incentives to choose the lowest-cost options available for their circumstances. To meet local needs, they can make trade-offs regarding other features of the contract on which the local government is well informed (e.g., reliability, frequency of collection, materials collected). Private payers, such as households and commercial establishments, also apply pressure to keep costs down.
4.3.3 Management of Risk
The volatility of market prices for recyclables presents challenges for all approaches to funding recycling. MRF and other recycling processing facilities sell sorted recyclables for prices that vary dramatically over time. As discussed above, sometimes the recovered material revenue may cover MRF processing costs; at other times, it falls short.
Sometimes MRFs share this risk with municipalities. Contracts between municipalities and MRFs include provisions for sharing of revenues from the sorted materials (The Recycling Partnership, 2020b). A revenue-sharing component is typically combined with base processing fees or may enter the contract through a processing fee with a sliding scale that depends on prices (Anshassi and Townsend, 2024). Local governments typically enter into contracts of 3, 5, 7, or even 10 years with MRF owners to process and market recyclables. These contracts vary in scope and requirements but generally specify contamination rate limits, cost allocation for rejected loads, processing fees paid by the government, and share of revenue from recyclables paid to local governments after processing fees are paid. In Florida, for example, the current trend is toward higher processing fees paid by local governments and lower revenue shares to local governments (Anshassi and Townsend, 2024). Historically, MRFs charged about $50–$60 per ton to local governments, although sometimes no fee was assessed. Now, fees can reach up to $210 per ton, with an average of $107 per ton for Florida communities (Anshassi and Townsend, 2024).
Key parameters in these contracts include contamination levels and market values of materials (Anshassi and Townsend, 2024). Some contracts include minimum values for per-ton market revenue; if revenue from end markets falls below the minimum, the local government may make supplemental payments to the MRF. Lower fees are typically found when the materials are processed by a municipally owned MRF instead of a privately owned facility. In Florida, for example, MRF contracts rarely use a fixed processing fee; instead, fees (and sometimes revenue shares) are adjusted based on the fluctuating value of materials (Anshassi and Townsend, 2024). Outside of Florida, new MRF contracts sometimes have a flat tipping fee (that includes profit and annual escalators) that ensures that MRFs cover their cost and/or turn a profit. Then, in a separate agreement, the MRF might share with the municipality a portion of the end-market revenue from sale of materials (“revenue-sharing”).
When a municipality agrees to greater revenue-sharing, it accepts more of the price risk and thus may reduce average overall costs (fees less revenues). Large municipalities may be able to manage these risks by dipping into contingency funds or by reordering immediate spending. They may also have good access to credit because of favorable tax treatment of municipal bonds, which eases the difficulty of covering short-term shortfalls. When states allow municipalities to engage in short-term borrowing, residents are less likely to have to pay privately for recycling (Walls et al., 2005). However, even large governments may sacrifice other priorities when recycling markets are unfavorable, and smaller municipalities have even more trouble managing this variability without cuts to services. Thus, imposing these risks on cities and towns may be a substantial disadvantage of the U.S. traditional system for funding recycling.
These risks probably raise the prices paid by customers for private recycling services and may reduce reliability. Residential subscription services pricing does not depend on commodity revenue, so private parties that collect and process the recyclables must bear the risk of commodity price movement. They likely charge higher prices on average to compensate for the risks, raising costs for households relative to a situation in which the government accepts some of the risk. Private companies offering subscription services may also be vulnerable to closure when markets are unfavorable and may be difficult to restart once closed.
4.3.4 Distribution of Financial Burdens
Funding approaches share the costs of recycling in different ways. In particular, public financing can reduce costs for vulnerable households. When a government uses general funds for recycling, it can take advantage of revenue sources such as property taxes that impose more burden on higher-income households. Alternatively, with subscription services or an enterprise fund, every household typically pays the
same amount for the service, so low-income households pay a larger share of their income for recycling than higher-income households. Public payment for services may thus be more equitable than private funding.
However, reliance on local government financing limits the ability of the system to distribute costs across regions, because local governments can only seek revenue within their boundaries. Recycling programs may be especially expensive in rural areas, because of transportation costs and lack of access to end markets. Local governments in rural areas may also have few high-income households or large firms to tax. This combination of high costs and limited revenue opportunities may make financial burdens of recycling much higher in these areas. Relying more on state or national funding or on alternative models (e.g., extended producer responsibility, deposit-return systems) might help alleviate some of these disparities.
4.4 ALTERNATIVE FINANCING: RECYCLING PROGRAMS
In the early 1990s, European policymakers actively explored strategies for promoting environmentally responsible product design. These initiatives sought to reduce packaging, simplify recycling, and minimize waste directed to landfills. A central concept emerging from this period was extended producer responsibility (EPR), introduced by Thomas Lindhqvist (1990) in reports to the Swedish government. EPR asserts that producers should be accountable for the entire life cycle of their products and packaging. The approach aims to incorporate environmental costs into product pricing and shift the responsibility for end-of-life product management from municipalities to producers and consumers. EPR principle underpins Germany’s “Green Dot” program, launched in 1991, as well as the European Union’s 1994 Packaging Directive. The principle gained further recognition in a 2001 report by the Organization for Economic Cooperation and Development 2001), which described it as a policy framework that assigns end-of-life responsibility to producers. This approach is intended to encourage manufacturers to consider environmental impacts during the design phase (p. 9).
The concept of EPR is most directly embodied in individual—or “take-back”—policies, where manufacturers are required to reclaim product packaging, and eventually the product itself, once it has reached the end of its useful life. By imposing responsibility for disposal on the producer, these policies incentivize firms to design products and packaging with recycling and disposal costs in mind. Fullerton and Wu’s (1998) economic model captures these incentives by demonstrating how market equilibrium—achieved when firms’ production choices align with consumers’ purchasing and disposal decisions—can drive optimal product design, output, and packaging choices, accounting for external disposal costs.
The model suggests three policies that can achieve socially optimal outcomes:
- The traditional economic solution places a tax per unit of consumer disposal at a rate equal to the marginal external damage (MED). If consumers have to pay both the private marginal cost (PMC) of disposal and the MED, they will choose to buy products with the optimal designs (less packaging and easier recycling).
- A general deposit-return system applies to bottles and lead-acid batteries, which are the most commonly collected materials in these systems. Instead it would collect a tax or deposit upon sale of every product, at a rate equal to the social marginal cost (SMC) of landfill disposal, and it would provide a refund upon proper recycling. To avoid paying a higher deposit, consumers would want goods with less packaging; to receive more refund, they would want to buy products that can be recycled more easily.
- An EPR policy requires the individual firm to take back the packaging and product and pay the full social marginal cost of disposal (equal to the PMC plus MED). This policy leaves the consumer with no direct disposal costs, but they must pay a higher equilibrium break-even price for the product, because firms must cover all production costs and disposal costs.
The outcomes are equivalent: either the consumers must pay social costs of disposal, and so they demand products with less packaging and with product designs that minimize disposal costs (see Chapter 6), or the firms must pay social costs of disposal and thus design products to require less packaging and easier recycling. Thus, a “perfect” individual EPR policy would achieve the socially optimal decisions about product designs, packaging, and consumer recycling decisions.
From the very beginning of EPR rules in the 1990s, however, European countries quickly realized that the perfect individual EPR policy would not be practical. It would require each firm to collect its own packaging and keep track of each product for years until the final consumer is done with it. Having many individual firms collect their waste in disparate locations is unnecessarily expensive relative to having one hauler collect waste at every house along each street. To address these collective EPR policies take advantage of these economies of scale in collection by having a “producer responsibility organization” (PRO) can collect all packaging and used products for disposal and then charge each firm for the weight of its waste collected.
A collective EPR policy, however, is very different from the ideal individual EPR. The collective EPR forces each producer to raise their sales price to cover the cost of disposal, so it effectively becomes a different policy called an “advance disposal fee,” a charge for the purchase of a product that will ultimately require recycling or disposal. But it does not encourage the firm to increase recyclability, nor the consumer to recycle. The fee collects significant revenue, which replaces local government financing of recycling collection.
Thus, a collective EPR suffers from two significant problems not found in the “perfect” individual EPR policy. First, private firms pay the PRO’s marginal costs of collection but not the external damages from waste disposal. Thus, incentives do not necessarily align the full costs of recycling with its benefits. For example, the extent of recycling is not sensitive to whether full direct and indirect (external) local disposal costs are high (i.e., where recycling is beneficial). Second, private firms pay the cost of collecting their own total waste (i.e., average cost per ton), but this payment is based only on weight and not on recyclability. The firm therefore has some incentive to reduce the total weight but not to design for recyclability. In only rare cases does the PRO’s fee vary based on the recyclability of the materials it collects (i.e., “eco-modulation).
The economic impact of EPR varies depending on the scope of the law. For example, Canada’s first packaging EPR policy was implemented in the province of Ontario and was established as a “shared responsibility” law, where producers and municipalities share the cost of recycling programs. However, the law resulted in financing disputes and lawsuits, with the system ultimately transitioning to a packaging EPR policy in 2019 with full responsibility on producers (with full implementation by 2025).
EPR policies may have both advantages and disadvantages in the way they redistribute the burden of paying for recycling. On the one hand, the need to pay producer responsibility organization fees will likely raise certain product prices, although prices may not rise by the full amount of PRO fees. These price increase pass along the costs of recycling to consumers and perhaps discourage consumption of these goods (source reduction of MSW that might be desirable). On the other hand, low-income households spend a larger share of their income on goods and thus may end up shouldering more of the burdens of recycling than they would if recycling were financed by local property tax, which can be designed to fall more on higher income households. Thus, the fact that an EPR follows a “polluter pays” principle does not necessarily make it fairer, because lower-income households may end up more burdened than they did under local government finance.
4.4.1 EPR Policies Outside the United States
Since the 1991 German “Green Dot” program, use of EPR policies has extended throughout the globe. EPR as a policy lever has grown, from voluntary programs and lightly enforced laws in Southeast Asian countries, to shared responsibility programs in the Canadian provinces of Manitoba and Saskatchewan, and to far-reaching producer responsibility programs in British Columbia and Quebec.
Empirical research supports the concern that collective EPR policies do not create the desired effect on product design. Joltreau (2022) studied the effects of European EPR policies, using data on the annual cost to comply with EPR from the organization PRO Europe (Packaging Recovery Organisation Europe) for 25 European countries and four packaging materials over 18 years (1998–2015). EPR rules vary in their stringency about the percentage of each firm’s total cost that must be paid and what materials can be recycled. Joltreau (2022) argues that compliance cost is an effective overall measure of stringency and scope and observes the causal effects of EPR stringency on the amount of packaging and on substitution between packaging materials. Joltreau (2022) found that European EPR rules have a statistically significant but very small effect on the weight of packaging and no effect on substitution toward a type of material that could more easily be recycled.
What can be done to reestablish the original goal of using EPR policies to create incentives for recyclability? A recent innovation of EPR legislation in the European Union and North America is the development of “eco-modulation” of fees on producers. Eco-modulated fees vary by product characteristics, and they reward firms that design products to be more recyclable or to be more environmentally friendly. Lifset and colleagues (2023) discuss ideas for restoring the incentives for eco-design by using eco-modulation within EPR systems; they considered choices around products to be included in the fee structure, objectives to be pursued, criteria to be employed, differentiation within the structure of fees, and the amount of each fee to be charged. These choices all depend on the goal of the EPR system, such as (1) to achieve selected policy targets for eco-design, for recycling, or for all product-life management, including product durability and the ability to repair or to reuse it; (2) to account for the presence and toxicity of hazardous substances; (3) to charge for external costs of disposal and thus achieve socially optimal disposal; or, more comprehensively, (4) to cover external costs of production (Lifset et al., 2023).
Ultimately, Lifset and colleagues (2023) propose a fee structure based on each product’s impact on the environment as measured through a life cycle assessment. They also recommended requiring better data from PROs about product characteristics and better use of those data for ex post policy evaluation. However, even eco-modulated charges do not vary with all the dimensions of heterogeneity in cost of recycling by location and over time, so they fall short of the ideal of imposing a tax that reflects the external costs of disposal for specific material types—a tax that would provide incentives for consumers to demand products with optimal durability, eco-design for reusability, and recyclability.
4.4.2 EPR for Packaging in the United States
For over 2 decades, many states have used EPR policies to fund and manage “hard to handle” materials. According to the Product Stewardship Institute (2025), 33 states and the District of Columbia have enacted 141 laws across 20 product categories. These policies have mostly addressed electronics, mercury thermostats, batteries, pharmaceuticals, paint, fluorescent lighting, and mattresses. What is more, the U.S. Environmental Protection Agency (2024) has published guidance on EPR policies for preventing plastic pollution (see Box 4-4).
Responsibility for waste and recycling management is decentralized in the United States, with authority delegated to individual states. This structure complicates efforts to implement federal recycling legislation, resulting in a patchwork of state and local recycling policies. Maine led the United States in passing a packaging EPR policy in 2021, followed by Oregon in 2021, Colorado and California in 2022, and Minnesota in 2024. Each has different financing and regulatory requirements (see Box 4-5). These states have used the policy as an opportunity to address other related packaging and recycling goals, as the new laws included regulatory requirements that are not part of the EPR policies themselves. In each of these five states, the enacted EPR legislation for packaging reflects the varying recycling gaps and perceived needs for that state. California and Oregon’s bills were born of frustration about the growing use of plastic packaging and its low recycling rates, while Colorado’s legislation (see Box 4-6) was driven by the high cost of recycling and low recycling rate. The need for economic support is also clear in the structure of Maine’s law, while Minnesota is looking for future increases in its recycling program investments.
BOX 4-4
EPA National Strategy to Prevent Plastic Pollution: EPR Framework
In November 2024, the U.S. Environmental Protection Agency (EPA) (2024) finalized its National Strategy to Prevent Plastic Pollution, a comprehensive plan aimed at eliminating plastic waste from the environment by 2040. A cornerstone of the strategy is the proposed development of a national extended producer responsibility (EPR) framework, which would assign greater accountability for managing plastic waste to producers and manufacturers rather than municipalities. This policy aligns with international practices that require producers to take responsibility for the end-of-life management of their products, fostering a more circular economy. The strategy is organized around six objectives: reducing pollution from plastic production, encouraging innovation in sustainable material design, minimizing waste generation, enhancing waste management systems, improving plastic capture and removal, and reducing impacts on waterways and oceans (EPA, 2024).
The EPR framework is currently in its conceptual stage, with significant stakeholder engagement and policy development needed to translate it into a functional national program. Existing EPR programs in states such as Oregon, Maine, and California provide valuable insights and precedents, but aligning these diverse approaches into a cohesive federal framework remains a challenge. A national EPR system could standardize recycling and reuse targets, streamline efforts, and reduce inefficiencies. However, concerns have been raised regarding the potential economic impacts of implementing such a framework. These include increased operational costs for producers and the possibility of manufacturing activities relocating overseas. Successfully addressing these challenges may require collaboration among producers, policymakers, and environmental organizations to design a system that balances economic viability with the overarching goals of reducing plastic waste, improving resource efficiency, and advancing sustainability.
SOURCE: EPA, 2024.
BOX 4-5
Case Studies: State-Level Packaging and Postconsumer Recycled Content Legislation
Several states address packaging waste using extended producer responsibility (EPR) and postconsumer recycled content policies. These policies can improve recycling systems, reduce environmental impacts, and advance sustainable materials management through regulatory and market-driven mechanisms.
Maine (LD 1541)
In 2021, Maine became the first state to enact an extended producer responsibility (EPR) law for packaging. The legislation requires producers to fund recycling programs through producer responsibility organizations (PROs), which oversee the collection and recycling of packaging materials. This law primarily focuses on financing recycling systems, transferring cost burdens from municipalities to producers.
Oregon (Senate Bill 582)
Oregon’s EPR law establishes a comprehensive framework for managing single-stream recyclables. It includes eco-modulated producer fees, life cycle assessment requirements, and recycling capture rate targets. The state’s Department of Environmental Quality plays an integral regulatory role, particularly in addressing greenhouse gas impacts of recycling. Implementation is scheduled for 2025, excluding curbside collection costs already covered in urban and suburban areas.
Colorado (HB 1355)
Colorado’s EPR law, passed in 2022, is one of the most comprehensive in the United States, requiring producers to cover all recycling system costs, including collection, processing, and market risk. The legislation mandates postconsumer content standards and provides funding for both traditional and compostable packaging management. The program will be operational by 2029, with a PRO responsible for implementation and performance monitoring.
California (SB 54)
California’s SB 54 requires substantial packaging reductions and recycling improvements, including a 25 percent reduction in single-use plastics and a 65 percent recycling rate by 2032. Noncompliant packaging will be prohibited from sale in the state. The law also includes robust enforcement mechanisms, annual payments to environmental programs, and detailed reporting requirements for producers.
Minnesota (HF 3911)
Minnesota’s EPR law incorporates a shared responsibility model, where producers reimburse municipalities for recycling costs, gradually increasing their financial contributions to 90 percent by 2031. Municipalities retaining operational control will receive funding to offset program expenses, while a PRO oversees operations in areas without municipal programs.
U.S. producers have lobbied for shared responsibility programs in several states. The result is a partial funding system in Oregon5 and a phased-in fee approach in Minnesota.6 Colorado’s program7 is a full producer responsibility program, where producers cover 100 percent of the costs and have broad program oversight. Full funding requirements come with the expectation of control by the producers, which is contentious in the United States because of existing public and privately funded systems.
EPR policies often have a basic fee structure, with specific discounts or penalties for products with specific characteristics. Eco-modulated fees have been built into programs in France and Canada, as well as some state programs in the United States. For example, California requires that producer responsibility organizations differentiate fees to reflect the presence of recycled content (CalRecycle, 2021). The State of Oregon has one of the more advanced eco-modulation systems, as described in Box 4-7.
With the exception of Maine’s law, which serves primarily as a funding mechanism for recycling, the legislation includes specific requirements for producers to use postconsumer content in packaging, to achieve recyclability requirements, and to reduce waste. These requirements are all in addition to the producers’ financial obligations to fund varying aspects of the state’s recycling programs. Since producers must achieve the specified regulatory goals in order to sell their products in each state, the linkage between the financing requirements and the additional regulatory requirements creates an enhanced element of pressure on producers.
The Circular Action Alliance (CAA) is a 501(c)(3) nonprofit entity governed by a board of directors initially comprised of leaders from 20 corporations. The organization has established a national “umbrella” organization to respond to state EPR laws in the U.S. CAA works with producers that pay fees based on the specific requirements of each state’s EPR program. CAA then establishes state-specific nonprofit organizations to manage the individual state EPR programs.
In the European Union, recycling packaging requirements are separate laws as part of the EU Waste Directive and are not built into the EPR funding laws. Conversely, U.S. state packaging requirements are built into the EPR policies, so they raise the stakes for packaging performance tied directly to providing the service in each state. In the United States, PROs manage compliance with state-specific EPR laws, coordinating services such as the collection, processing, and recycling of packaging materials, often in collaboration with municipalities or private service providers. EPR is being layered onto existing waste management and recycling programs in the United States (rather than creating new programs as in other countries). Thus, some companies within the U.S. recycling industry view EPR as a significant risk to their business invest-
___________________
5Oregon State Legislature. Senate Bill 582: Plastic Pollution and Recycling Modernization Act. 2021 Regular Session. https://olis.oregonlegislature.gov/liz/2021R1/Measures/Overview/SB582.
6Minnesota Statutes §§ 115A.144–115A.1463 (2024).
7Colorado General Assembly. House Bill 22-1355: Producer Responsibility Program for Recycling. 2022. https://leg.colorado.gov/bills/hb22-1355.
ments. To mitigate this concern, legislative negotiations in states with EPR policies have included requirements to prioritize the use of existing recycling facilities and to allow cities to continue to provide their own service or to contract with private service providers. Additionally, needs assessments can help states create effective EPR policies (Box 4-8).
BOX 4-6
Case Study: Colorado’s Extended Producer Responsibility Policy
The State of Colorado is in the process of implementing an extended producer responsibility law requiring the producers to cover all of the costs of the State’s residential recycling programs, as well as recycling programs for small and hospitality commercial business, and government entities.
As part of that process, the producer responsibility organization for the state, Circular Action Alliance, conducted a needs assessment of services available—and gaps that remain to evaluate the revenue it will need to charge to producers to achieve the requirements of the statute (see Table 4-2).
TABLE 4-2 Colorado Needs Assessment – Estimated Recycling Outcomes per Scenario
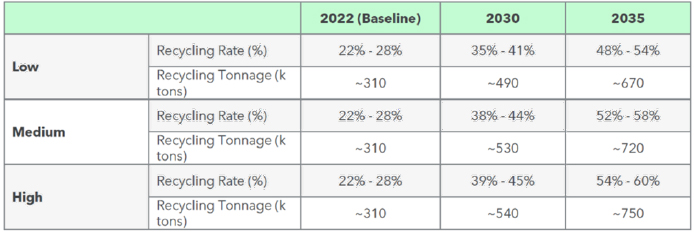
SOURCE: Adapted from tables provided by CAA, 2024.
The state approved the medium scenario, requiring significant investments in infrastructure throughout the state, resulting in the estimated costs shown in Table 4-3, ranging from the baseline costs (2022) to the cost of the program when it is fully implemented in 2035.
TABLE 4-3 Colorado Needs Assessment – Estimated Costs er Scenario
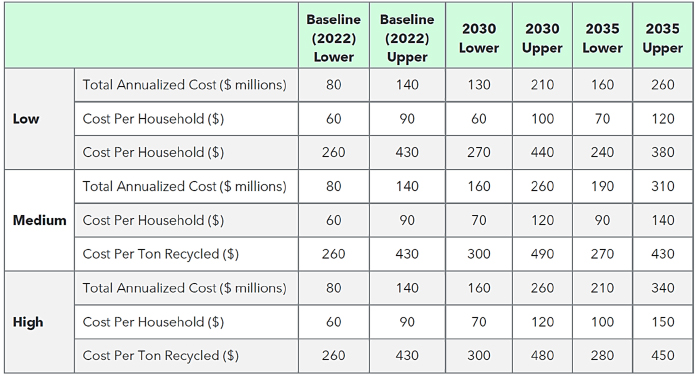
SOURCE: Adapted from tables provided by CAA, 2024.
The medium cost is estimated to be $90/household/per year in 2022, growing to $140/household/year in 2035 when the program is fully implemented and all residents in the state will be able to recycle a long list of materials. The projected future costs in Colorado track more closely to the costs in Washington and California, since they reflect higher levels of service and greater participation (more trucks on the street and more material to manage as recyclable).
SOURCE: CAA, 2024.
BOX 4-7
Case Study: Oregon’s EPR Policy
The State of Oregon’s extended producer responsibility (EPR) policy mandates that producer responsibility organizations (PROs) adjust fees to provide incentives for actions that reduce the environmental and human health impacts of covered products (e.g., changes in the design, production, and distribution of products (ORS 459A.884[4]). The PRO must propose criteria for adjusting fees and for the magnitude of the adjustments. The Oregon Department of Environmental Quality (ODEQ) plays an important role in developing the fees by providing formulas for the PRO to use in evaluating fee-setting for eco-modulation.
Impacts of concern related to packaging include climate change, toxicity, and microplastic pollution. These factors contribute to two of six “planetary boundaries” for climate and novel entities (i.e., toxic and long-lived substances released to the environment).
In 2024, ODEQ (n.d.) recommended that PROs develop eco-modulation formulas that:
- Incorporate ODEQ’s rules for life cycle evaluation. The approach should verifiably deliver environmental benefits based on the normalized and weighted results calculated following ODEQ’s rules of life cycle evaluation.
- Grant at least as many malus fees (penalties) as bonus fees, rather than emphasizing bonuses over maluses, to communicate adequate urgency for system change.
- Increase the magnitude of fee adjustments over time to maximize their effect.
While some producers view EPR as a regulatory burden, others see it as an opportunity to gain greater control over packaging standards and materials, aligning compliance efforts with their sustainability goals. To achieve high recycling rates, producers need households to recycle more, resulting in more recyclable feedstock.
4.4.3 Deposit-Return Systems
In a deposit-return (or deposit-refund) systems (DRSs), consumers pay a small amount when buying a product—often beverages in single-use cans and bottles. This amount is reimbursed to them when they bring the empty beverage container to a collection point with a vending machine or manual handheld scanning readers.
BOX 4-8
Case Studies: State-Specific Needs Assessment Laws
Several states have enacted laws to evaluate existing recycling systems and identify gaps in infrastructure, capacity, and costs. These needs assessment laws are foundational steps toward the development of comprehensive recycling and EPR programs, offering insights to guide future legislative and programmatic actions.
Illinois (Public Act 103-0383): This law directs the state to conduct a comprehensive statewide recycling needs assessment to identify service gaps, evaluate current infrastructure capacity, and analyze costs associated with packaging and paper recycling.
Maryland (SB 222): Maryland’s legislation requires an assessment of both traditional recycling and organics processing capacity. The findings will inform the establishment of a producer responsibility program for packaging materials, with recommendations developed by a designated advisory council.
A DRS replaces the local government as the party responsible for funding and managing the recycling of the items it covers. The collection or redemption center manages their collection and is usually funded from the DRS. This system can encourage consumers to recycle containers rather than dispose of
them in the regular waste stream, and it penalizes the person who buys the container if they do not recycle it. As discussed in Box 3-3 in Chapter 3, an idealized version of a DRS could fully internalize the external costs of waste disposal without creating incentives for illegal disposal (Fullerton and Kinnaman, 1995). Moreover, a DRS can be generalized to apply not just to containers or batteries, but to help reduce pollution from any kind of material (Fullerton and Wolverton, 2000).
In the United States, ten states have deposit-return policies requiring fees on the sale of beverage containers. The process typically involves a network of collection points where consumers can return their containers; these may be located in supermarkets, recycling centers, or stand-alone automated machines. Once the containers are returned, they are sorted, cleaned, and prepared for recycling. This system is also commonly used for hazardous household wastes, because it can promote recycling and remove these materials from the ordinary solid waste stream. For example, DRSs in U.S. states and several other countries include collections for lead-acid batteries, motor oil, and tires (Sigman 2020).
NCSL (2020) also summarized DRS legislation in these ten states (see Table 4-4).8 Notably, not much meaningful policy variation has occurred in the last 15 years. Exceptions include Oregon, which added products to the program as recently as 2018, and California, which expanded its DRS in 2024. See Box 4-9 for a case study on California’s DRS.
TABLE 4-4 Deposit-Return Programs in the United States
| State | Statute | Year | Summary Deposit Amount | Summary Beverages Covered |
|---|---|---|---|---|
| California | Cal. Public Resources Code §§14501–14599 | 1986 | 5¢ (<24 oz.) 10¢ (≥24 oz.) | Beer, malt, wine, and distilled spirit coolers; all non-alcoholic beverages, except milk |
| Connecticut | Conn. Gen. Stat. §§22a-243–22a-246 | 1978 | 5¢ | Beer, malt, carbonated soft drinks (including mineral and soda water and any type of other flavored water), bottled water (bottled water covered starting in 2009) |
| Hawaii | Hawaii Rev. Stat. §§342G-101–342G-122 | 2002 | 5¢ | Beer, malt, mixed spirits and wine; all non-alcoholic drinks |
| Iowa | Iowa Code §455C.1–455C.17 | 1978 | 5¢ | Beer, wine coolers, wine, liquor, carbonated soft drinks, mineral water |
| Maine | Me. Rev. Stat. Ann. tit. 38, §§3101–3118 | 1976 | 15¢ (wine/liquor) 5¢ (all others) | All beverages |
| Massachusetts | Mass. Gen. Laws Ann. ch. 94, §§321–327 | 1981 | 5¢ | Beer, malt, carbonated soft drinks, mineral water |
| Michigan | Mich. Comp. Laws §§445.571–445.576 | 1976 | 10¢ | Beer, wine coolers, canned cocktails, soft drinks, carbonated and mineral water |
| New York | N.Y. Environmental Conservation Law §§27-1001–27-1019 (Amended 2013 SB 2608) | 1982 | 5¢ | Beer, malt, wine coolers, carbonated soft drinks, soda water, and water not containing sugar |
| Oregon | Or. Rev. Stat. §§459A.700–459A.740 | 1971 | 10¢ 2¢ (standard refillable) | Beer, malt, carbonated soft drinks, bottled water (will cover all beverages except wine, distilled liquor, milk, milk substitutes and infant formula by 2018) |
| Vermont | Vt. Stat. Ann. tit. 10, §§1521–1529 | 1972 | 15¢ (liquor) 5¢ (all others) | Beer, malt, mixed wine, liquor, carbonated soft drinks |
| Guam | Guam Code tit. 10, §§44101–44119 | 2010 | 5¢ | Beer, ale, malt, mixed spirits, mixed wine, and all non-alcoholic beverages |
SOURCE: NCSL, 2020.
___________________
8See https://www.ncsl.org/environment-and-natural-resources/state-beverage-container-deposit-laws.
BOX 4-9
California’s DRS Programs: A Redemption Value Case Study
California established a deposit-refund system (DRS) in the AB2020 Act, which requires consumers to pay a redemption value for each eligible beverage container. The retailer charges consumers the California Redemption Value (CRV) at the point of purchase. When the container is empty, the consumer can take it to a certified drop-off recycling center and receive a refund of the same CRV amount.
Heterogeneous Responses to the Refund Program
Berck and colleagues (2021) focused on the demand side of the recycling system and summarized some of the evidence around the efficacy of the California Department of Recycling (CalRecycle) deposit-refund recycling program in conjunction with other recycling alternatives, such as curbside recycling pick-up—in providing convenient recycling options to consumers.
Using a representative sample of 1,000 Californian adults, Berck and colleagues (2021) found that 23 percent of respondents used drop-off recycling centers. Respondents seem to find recycling generally convenient and worth their time. About 32 percent of respondents reported using curbside recycling, and 5 percent reported recycling at a business or place of worship outside their home. Notably, those who reported using the latter two options were wealthier and more educated than those who report using drop-off recycling centers. Less affluent households had lower opportunity costs of time and hence were more likely to find it worth their time and energy to redeem their CRV at the drop-off recycling centers instead of using curbside recycling.
Black and Hispanic respondents were less likely to use curbside programs than others, and more likely to return material through drop-off recycling centers (Berck et al., 2021). Berck and colleagues (2021) asked survey respondents whether a change in the CRV would encourage them to return containers to drop-off recycling centers. The number of people who said they would redeem their containers at a drop-off recycling center increased with the CRV. Of the people who said that they were currently throwing their beverage containers in the trash, it took an increase in the CRV from 5 cents to 15 cents before more than half said they would start taking containers to a drop-off recycling center. Among those currently using trash for disposal, only 11 percent said they would redeem at a drop-off center if the rate were increased to 7 cents. The survey respondents who use curbside were much more responsive to a potential increase in CRV than those who threw out their containers. The same increase of CRV to 7 cents would lead to a 34 percent reallocation of recycling from curbside to drop-off recycling centers (Berck et al., 2021).
Counterfactual Policy Effects
In a follow-up study, Berck and colleagues (2024) simulated whether an increase in the CRV amount would (1) increase the overall recycling rate, (2) simply induce a switch in recycling methods, or (3) have no effect at all. The answer was not clear ex-ante; the authors found that those who currently recycled but did not redeem their CRV (e.g., through curbside recycling) and those who use trash disposal may or may not be sensitive to small changes in the CRV amount.
Berck and colleagues (2024) found that doubling the CRV amount would induce only a modest increase in overall recycling (and the benefits of this policy would mostly accrue to wealthier individuals). Hence, an increase in the CRV amount may not be the optimal policy to increase recycling. Berck and colleagues (2024) consider the effect of reducing or eliminating the state’s subsidy for handling fee centers. A 2008 policy change that reduced handling fee payments for some centers caused many of these centers to close. In addition, many drop-off recycling centers throughout California have closed in response to China’s 2017 decision to restrict imports of recyclable materials (i.e., the National Sword Policy), further limiting drop-off recycling center options for consumers. This development affected all drop-off recycling centers, not just handling fee centers, but it has further reduced the ability of handling fee centers to operate without a state subsidy. Berck and colleagues (2024) use the model estimates to predict recycling options under counterfactual hypothetical closures of nearby convenient handling fee centers. They find that handling fee center users would generally just switch to using processing fee centers. Hence, the fear of consumers not having convenient recycling options without handling fee centers is likely unfounded.
4.4.4 Benefits of Deposit-Return Systems
A unique feature of DRSs is that they provide incentives directly to consumer and commercial establishments to return their containers for recycling. Not surprisingly, recycling rates of these containers are much higher with a DRS than without one. For example, states that implemented a DRS for polyethylene terephthalate (PET) bottles saw a 56 percent recycling rate, compared with 18 percent in states with no such system (Container Recycling Institute, 2024). Globally, recycling rates exhibit a strong positive association with the deposit fee and refund amounts, (see Figure 4-4).
To determine the causal effect of DRSs and to address place-based selection bias, Viscusi and colleagues (2012) conducted a difference-in-difference analysis, comparing the change over time in two states that extended their DRS to include plastic bottles with changes in states that did not. After the extension, the number of households that recycled increased by a statistically significant 8.5 percent. Likewise, Ashenmiller (2009) assessed the material brought in for rebates to California recycling centers and concluded that 36–51 percent of the material would not otherwise have been collected. In 2017, Oregon increased its deposit from 5 cents to10 cents, because of a provision that increases the deposit when the recycling rate falls below a certain threshold, and saw an immediate increase in the recycling rate of the bottles covered in its program from 64 percent to 81 percent. Their recycling rate for covered bottles is estimated at 90.5 percent for 2023, according to the Oregon Beverage Recycling Cooperative (2023).
DRSs may have other benefits as well. First, given the high degree of sorting involved in returning beverage containers to recycling systems, a DRS can provide a cleaner recycling supply stream with less contamination relative to material collected at the curbside. This source-separated waste has higher value for end uses and is less likely to be diverted to landfill.
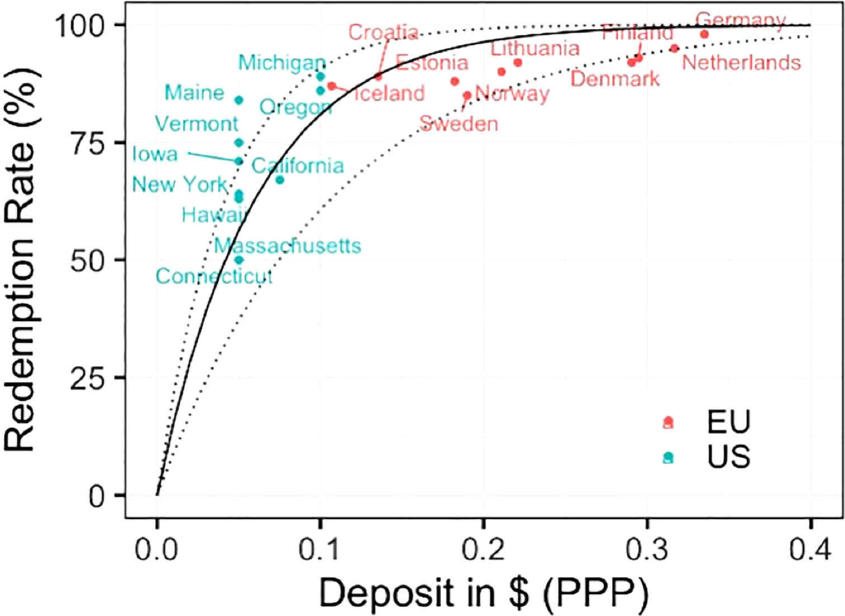
NOTE: PPP = purchasing power parity.
SOURCE: Basuhi et al., 2024. CC-BY-NC-ND.
Second, the initial justification for using these systems for beverage containers included litter reduction; empirical research finds that they have been successful in this area. Levitt and Leventhal (1986) observed that New York’s bottle bill reduced litter near highway exits and railways by a statistically significant 44 percent. And, using data from the United States and Australia, Schlyer and colleagues (2018) found that containers constitute a 40 percent lower share of coastal debris surveys in states with container DRSs. Similarly, Critchell and colleagues (2023) found that adopting a DRS significantly reduced plastic marine debris in Australia.
Third, these policies may have broader social benefits. Ashenmiller (2009) found that the beverage container DRS provide a significant source of income for a group of very-low-income “professional” recyclers. Extending this logic, she found that adopting beverage container DRS reduces petty crime by 11 percent (Ashenmiller, 2010).
4.4.5 Disadvantages of Deposit-Return Systems
Despite their many demonstrated advantages, deposit-return systems may have important disadvantages as well. First, while these programs increase the recycling of beverage containers through monetary incentives, they also remove high-value materials such as aluminum and PET bottles from the curbside stream. Studies have shown that aluminum and PET bottles are a small percentage of the recycling stream by weight but contribute disproportionately to MRF revenue because of their higher market value (Container Recycling Institute, 2022). Diverting these materials from the curbside stream reduces revenue for MRFs and could negatively impact the financial sustainability of curbside programs (unless MRFs were to receive some of the net revenue from the DRS). In fact, curbside recycling programs sometimes need to enforce against theft of containers from curbside bins (Lange, 2012).
Removing these materials from the curbside stream under a national DRS could reduce sales revenue to MRFs by more than the cost-saving from handling less curbside material. In addition, states with a DRS have struggled to invest in sophisticated MRF technology without the revenue associated with aluminum cans and PET bottles (Basuhi et al., 2024). Basuhi and colleagues (2024) estimate that implementing a national DRS would require increases in MRF processing fees net of commodity revenues by 13 percent and that $373 million more would be needed to offset these losses. Using unclaimed deposits to help fund MRFs, as California does, might help preserve this system. To date, DRSs have not confronted these issues because most were in place before curbside recycling programs were implemented.
A second potential drawback of DRSs is their high cost to redemption centers and consumers. Redemption centers, often in retail stores, must allocate space for collection and storage for the materials. Manual return systems rely on workers, and even automatic systems such as “reverse vending machines” require labor to maintain and manage, in addition to the capital costs of the machines. Estimates of handling costs vary. In Connecticut in 2018, handling costs were estimated at $0.0284 per container, which is within the range of handling fees paid by states that offer explicit reimbursement to redemption centers (Reloop, 2021). Handling fees offered by states range from 1 cent in Iowa to 3.5 cents for commingled containers in New York, Maine, and Vermont. An earlier estimate pegged the costs of California’s system at 0.2 cents per container (Ackerman et al., 1995), which is an inflation-adjusted 0.41 cents per container today. About 50 percent of redemption centers in California, where the handling fee was 0.86, closed in the last decade, implying that centers may experience higher costs in many locations.
These estimates suggest relatively high costs relative to curbside recycling programs. For a PET bottle that weighs 9.25 grams (Recycling Today, 2015), a range of cost from $0.0041 to $0.0284 per bottle collected for refund implies a cost range from $400 to $2800 per ton of PET bottles collected, which may typically be higher than average costs for curbside collection and MRF processing. Adding a DRS to an area with curbside collection for non-deposit materials such as paper probably does not lower the costs for curbside collection dramatically. Thus, the combined costs of the two systems may be high.
Third, these redemption center costs exclude the substantial time and energy that households spend to sort, transport, and return materials for redemption. Household costs are likely lower for curbside recycling. Thus, the social costs of having a DRS may exceed curbside recycling costs substantially, suggesting that they are suited to collecting materials for which legal and illegal disposal is most harmful.
Finally, as with an EPR program, collecting materials through a DRS does not ensure socially valuable uses for the collected materials. The problem may be particularly acute for plastics. Virgin plastic resin is very inexpensive; manufacturers have little incentive to pay for U.S. Food and Drug Association–approved postconsumer resin without a policy that provides either a strong incentive or a requirement to do so. As a result, recycled plastic is more commonly used in nonfood applications (PET to textiles, high-density polyethylene [HDPE] to piping, low-density polyethylene [LDPE] to decking, polypropylene to paint cans). Even in these nonfood applications, however, demand may be low. A DRS may need to be coupled with policies to drive demand for the materials collected (e.g., a recycled content standard).9
4.4.6 Role of Unredeemed Deposits
Imperfect return rates in DRSs can generate net revenue via unredeemed deposits (i.e., when a customer forfeits deposit value by not returning the PET bottle). Handling of unredeemed deposits varies widely in the United States:
- Connecticut, Massachusetts, and Maine use it for general funds.
- New York gives producers a fraction to cover system costs.
- Iowa allows producers to keep it and operate the DRS.
- Michigan uses it to support retailers that handle deposits.
- California and Vermont earmark it for specific purposes such as a beverage container recycling fund and clean water programs.
If a 10-cent deposit fee were implemented nationwide, close to $1 billion in unredeemed deposits could be available. Policy design is needed for effective use of this revenue without introducing counterproductive or perverse incentives. For example, although perhaps politically expedient, allowing producers or retailers to keep forfeited deposits may undercut their incentives to encourage recycling (Calcott and Walls, 2005). Policymakers designing a DRS need to carefully consider the degree to which unredeemed funds are allocated back to DRS operations.
4.4.7 Considerations for Policy Implementation
In addition to unredeemed deposits, other considerations for implementing a DRS include the systems’ limited scope and issues of end-market demand.
DRSs invite consumers to recycle, so expanding such a system nationwide could increase the amount of material collected for recycling. But it is important to note that the materials collected in these systems would account for only about 20 percent of the volume of recyclables in the United States. New deposit-return policies could be coupled with EPR policies to address the remaining 80 percent.
Additionally, increasing the supply of plastic and aluminum recyclables may have unintended market consequences, especially because demand for recyclables, particularly plastics, is always uncertain. A demand-side postconsumer recycling policy could balance the additional supply. Policies that address gaps in financing of plastic recycling are particularly important because the cost of virgin plastic is less than the cost of processing postconsumer plastic for recycling (see Chapter 5 for relevant recommendations).
___________________
9Another alternative would be to implement a variant of the system that applied refunds at the secondary producer, not the consumer, level (Palmer et al., 1995). In this policy, the refund would be paid as subsidy for use of the recycled material. This upstream subsidy would still increase material recovery because it raises prices for the secondary material and thus encourages its collection.
4.4.8 Deposit Legislation
Deposit-return legislation is sometimes thought to be a form of EPR, based on the role that producers play in the recycling process. However, EPR policies tend to require “invisible” fees built into the cost of the product, while DRSs require a visible fee to be paid by the purchaser (to be refunded only when that product is redeemed). Ten states in the United States have DRSs—also known as “bottle bills” (Figure 4-5; Container Recycling Institute, n.d.). These states tend to have high recycling rates for materials covered under the DRS; for example, bottle recycling returns are as high as 80 percent in Oregon.
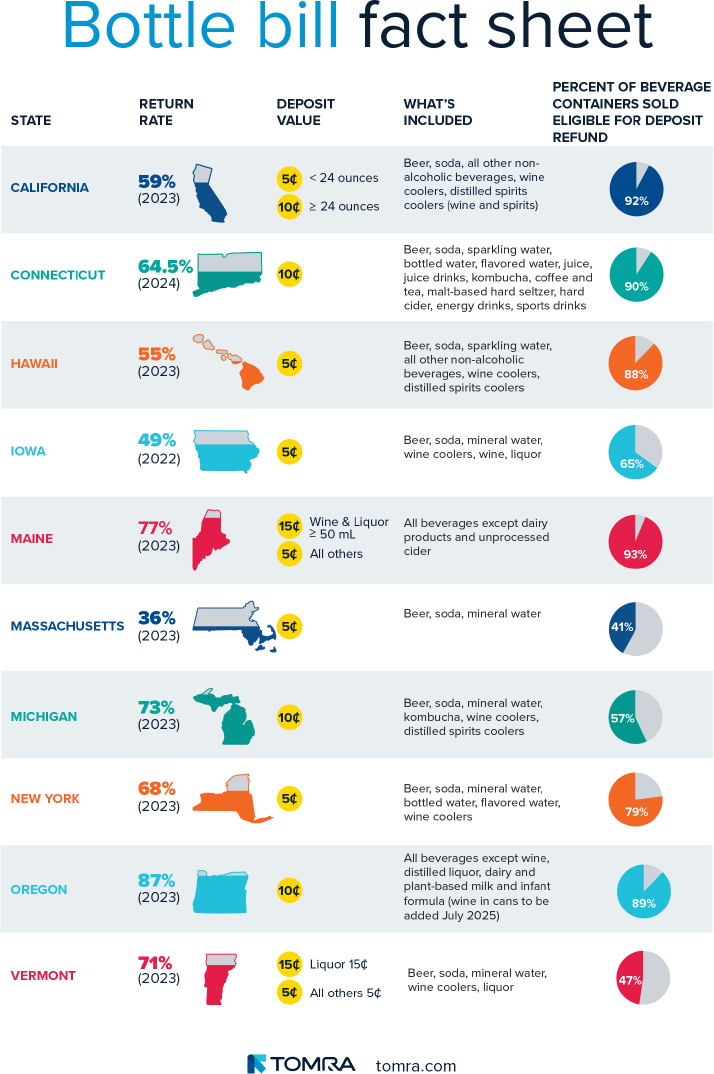
SOURCE: TOMRA, 2023.
Except for Hawaii’s program, all deposit-return programs in the United States were enacted before curbside recycling programs were implemented. Deposit-return policies include aluminum cans and PET bottles that could instead have been collected and sold as part of curbside recycling, reducing revenue for these programs unless the deposit-return policy provides compensation for them. Without compensation, the foregone revenue may make curbside recycling less affordable for local governments.
4.5 KEY POLICY OPTIONS AND RECOMMENDATIONS
The following section outlines key policy options and recommendations for improving recycling systems, focusing on strategies centered around the costs and approaches of recycling systems.
4.5.1 Extended Producer Responsibility
As discussed extensively in this chapter, EPR can be a policy strategy for decreasing the total environmental impact from a product by making the manufacturer of the product responsible for its entire life cycle and especially for the take-back, recycling, and final disposal of the product (Lindhqvist, 2000).
While EPR policies have already been implemented for hard-to-handle materials in the United States (e.g., e-waste, tires, mattresses, paint), EPR policies focused on plastics and other packaging and recyclables are less common but growing in prominence (France Ministry of Economy, 2025). As of 2024, five U.S. states have passed EPR policies for packaging.10 While each state law is quite different, with language that reflects each state’s unique recycling needs, four of the policies (all but Maine’s) incorporate requirements for packaging reduction, recycling, use of postconsumer content, packaging design, and “responsible end-market” requirements.
The general structure of an EPR policy requires producers to cover the cost of the entire life cycle of packaging, including disposal, and to pay fees based on specified criteria. Additions or subtractions from the producer’s disposal fee are intended to encourage changes in covered materials that would increase their recyclability or reduce their environmental harm. The fees are then used to pay for the cost of collection, processing, and recycling of the covered materials. In this way, EPR policies also establish a financing mechanism for waste management systems that is different, and likely more stable and reliable, than traditional financing schemes. This alternative funding scheme can improve recycling access and increase supply of recycled materials.
EPR policies for packaging typically allow for a nonprofit PRO to manage the program efficiently on behalf of the producers whose products are covered in the regulation. The organization collects fees from the producers and uses those funds to support and manage the recycling programs on their behalf to achieve the requirements of the law cost-effectively. By using the revenue generated by those EPR fees to support waste and recycling systems, EPR policies reduce the financial burden on local governments and recyclers, facilitate investment in recycling, and reduce the cost of recycling. Producer responsibility toward recycling programs increases access to recycling, ultimately increasing the supply of recycled materials. In addition, as discussed in this chapter, fee requirements under an eco-modulation scheme in the legislation can provide incentives for packaging design choices to help achieve the EPR policy goals, and disincentives for packaging design choices counter to those goals. Cost implications of EPR policies vary, but initial ranges can be observed in the states that have already enacted EPR for plastics and packaging. For example, Oregon has a designated PRO, the Circular Action Alliance, that has established packaging fees in a proposed program plan, ranging from 1 to 273 cents per pound depending on the packaging type (ODEQ, 2024).
EPR policies have trade-offs as well. First, at least a portion of the EPR fees imposed on manufacturers would be passed along to consumers in the cost of goods (e.g., groceries) and thus could be considered a regressive tax, as these goods make up a larger-than-average percentage of spending by low-income households. Second, EPR policies have not historically been designed to address end-market demand for recyclables. Adding supply of material without addressing demand has the potential to erode market prices,
___________________
10Maine, Oregon, Colorado, California, and Minnesota.
which would likely yield negative impacts on various actors in the waste management system, including collectors, haulers, sorters, and processors. This potential drawback of EPR policy could be addressed by a fee per ton of virgin plastic resin purchased by manufacturers and a reward per ton of recycled plastic resin purchased by those same manufacturers. Both the fee and the reward are intended to increase demand for recycled plastic resin and thus complement EPR policies that increase its supply.
States have passed EPR legislation with variations that reflect their specific recycling needs. While federal legislation could provide more consistent implementation and widespread adoption, state-by-state heterogeneity still needs to be considered. Instead of a nationwide EPR law, developing a federal EPR framework that recommends key elements for states to include in their EPR legislation could help facilitate effective use of this policy at the state level, while promoting consistency to the extent practicable. This federal framework would include recommending that states conduct a needs assessment to identify gaps in current services and programs, materials to be covered in the law (“covered materials”), eco-modulation concepts, and program implementation guidelines. Furthermore, Congress could encourage state adoption of these federal EPR guidelines by offering federal support for state recycling infrastructure that depends on adoption of federal EPR guidelines and standards.
Once passed, EPR policies for plastic packaging and other recyclables require multiple years to implement. Reasonable estimates based on states that have already passed EPR policies range from 3 to 5 years for implementation. After enactment, the results of these policies can be assessed via annual producer reporting to the regulatory agencies (including state or federal agencies). Reporting requirements are typically embedded within EPR policies and include data such as tons collected, tons recycled into new products, tons of packaging reduced, and carbon emission reductions associated with packaging reduced and recycled. Consistent with the committee’s recommendation below regarding data needs, these data need to be collected and analyzed to ensure the EPR policy is working as intended and accomplishing appropriate recycling goals.
In summary, the committee offers the following conclusions, recommendation, and policy options regarding EPR policies.
Conclusion 4-1: EPR policies can achieve multiple policy objectives for recycling, including providing stable financing for recycling programs, decreasing contamination, increasing the efficiency of recycling systems, increasing demand for recycled material, and enhancing environmental and social benefits of recycling.
Recommendation 4-1: The United States should increase reliance on extended producer responsibility (EPR), which should cover packaging and expand to other materials as appropriate. EPR policies should include eco-modulation to create economic incentives for manufacturers to design for recyclability, and funding streams for recycling systems and infrastructures. State government should enact EPR policies to account for regional heterogeneity but should be supported and informed by a national framework with guidelines.
The committee developed key policy options to accomplish this recommendation, targeted at different levels of government.
Key Policy Option 4-1: The U.S. Environmental Protection Agency (EPA), with appropriate funding and authority from Congress, could develop and facilitate a national extended producer responsibility (EPR) framework, as outlined in its 2024 report National Strategy to Prevent Plastic Pollution. If it pursues this framework, EPA should consult with state, local, and tribal governments; nongovernmental organizations; industry; and other relevant partners. This framework should provide guidelines on key elements of state-level EPR policies and recommend minimum state-level standards and best practices. A national framework should provide as much consistency across states as possible and support multistate efforts, while allowing for state-level variation in targets, fees, covered materials, and methods to reflect heterogeneity in costs and benefits across states.
Key Policy Option 4-2: State governments could enact extended producer responsibility (EPR) policies, informed by any minimum standards provided by the U.S. Environmental Protection Agency. State-level needs assessments should identify gaps in current services and programs and serve as a basis for setting EPR fees. Within an EPR framework, state governments could consider policies, such as recycled content standards, to enhance end markets for recyclable materials.
4.6.2 State-Based Landfill Surcharges for Recycling
MSW landfills charge a “tipping fee” for the waste that they accept. This fee is typically charged as dollars per ton of solid waste (or in some cases, dollars per cubic yard). The tipping fee comprises (1) a baseline fee paid to the owners of the facility to cover their capital and operating costs and (2) a surcharge to address the social and environmental impacts associated with landfilling (i.e., external costs relative to other means of MSW management). A landfill tipping fee raises the cost of disposal and reduces its cost advantage over recycling. Furthermore, the funds collected can be used to support statewide or local recycling programs, further shifting MSW management from landfills toward recycling. Along with these incentives, reducing landfill use confers benefits by reducing the social and environmental externalities that they generate (see Chapter 6). Costs are also reduced by lengthening the lifetime of available landfill capacity.
The landfill tipping fee surcharges is an example of a Pigovian tax or fee intended to internalize the social and environmental external costs of a management option (as discussed in Chapter 3). Under ideal competitive market assumptions, a Pigovian tax induces reduction of costly polluting behavior in an economically efficient manner, by setting the tax rate equal to the marginal external cost (Arrow, 1970; Burrows, 1979; Cremer et al., 1998). The process for determining an appropriate externality fee involves two major steps: first, environmental impact studies such as life cycle analyses calculate the social or environmental damage expected from each disposal option (discussed below); second, economic studies are necessary to value this impact. These economic studies can employ behavioral (revealed preference), or attitudinal (stated preference) methods (see Chapter 6; see also Mendelsohn and Olmstead, 2009). Examples of social and environmental costs that have been explored for use in cost-benefit studies include Matthews and Lave (2000), Sovacool and colleagues (2021), and Comineti and colleagues (2024). Applications of externality pricing in cost-benefit analysis for solid waste management are demonstrated by Goddard (1995), Fullerton and Kinnaman (1995, 1996), Nahman (2011), Paes and colleagues (2020), Medina-Mijangos and colleagues (2021), Matheson (2022), and Massarutto (2024).
Landfills are regulated and permitted by state governments; however, their baseline tipping fees are set by the landfill owners based on market conditions (private landfills) or costs (public landfills). These fees can be paid at the landfill or at a transfer station that feeds into a particular landfill. At present, many but not all states have a landfill tipping fee surcharge (essentially, a tax), which is collected by landfill operators and paid by the individual or entity disposing of MSW at that landfill. In urban areas, this entity is often a hauler of MSW, but in rural areas the fee may apply to others transporting their own household waste to a landfill. Regardless of the entity directly paying this surcharge at the landfill, the surcharge would mostly be passed along to the original waste generator, raising the cost of waste disposal relative to other management options (e.g., recycling). State governments can also tailor fee levels to their state’s conditions and can choose the appropriate local governments and programs to receive the funds raised.
Current Surcharge Rates Across the United States
By 2009, 30 states had imposed tipping fee surcharges, with an average fee of about $2 per ton (Jenkins and Maguire, 2012). In response to a survey from the National Conference of State Legislatures (2021), 12 states reported surcharges as of 2021, as shown in Box 4-10. These states have tipping fee surcharge rates that range from $0.25 to $6.00 per ton, with a mean of $2.40 per ton, a median of $2.00 per ton, and a standard deviation of $1.70 per ton.
BOX 4-10
States with Landfill Tipping Surcharges
| State | Landfill Surcharge |
|---|---|
| Arizona | $0.25 |
| Arkansas | $1.50 |
| California | $1.34 |
| Georgia | $0.75 |
| Illinois | $2.00 |
| Iowa | $4.25 |
| Maine | $2.00 |
| Michigan | $6.00 |
| Nebraska | $1.25 |
| Ohio | $2.00 |
| Pennsylvania | $4.00 |
| South Dakota | $3.00 |
NOTE: Rates are listed for the 12 states that provided them for the study.
SOURCE: NCSL, 2021.
The Environmental Research & Education Foundation (2024) reported total tipping fees in 2023 had a mean of $58 per ton, with regional averages ranging from $43 to $83 per ton, the $2 per ton surcharge represents 3.4 percent of the average total tipping fee (and 2.4–4.7 percent of the low and high regional averages). With a proposed additional surcharge of $2 per ton, the decrease in the financial advantage of landfilling relative to recycling is likely to be minor. However, the very presence of a landfill surcharge and its use to support recycling awareness and infrastructure may be enough to motivate public and stakeholder awareness, support, and action to begin and to continue the process of transition from landfill disposal toward recycling. While the most appropriate landfill surcharge rate for a state will be determined by its legislature with input from its citizens, industry, and environmental and economic advisors, the results of our estimates and analysis suggest that a $2 per ton surcharge can serve as a moderate and representative point of departure to initiate and support state-specific recycling legislation.
Appropriate (Moderate) Rates for a Tipping Fee Surcharge?
While states may select tipping fee surcharge rates based on the environmental and social externalities associated with disposal at a landfill, external damages are difficult to calculate in a consistent manner across sites and are subject to high measurement uncertainty. Furthermore, calculated rates may exhibit wide variation across a state, due to both physical and demographic heterogeneity and the use of differing methods and modeling assumptions. Guidance is needed for states to identify a range of tipping fees to be deemed as moderate and appropriate. For a total tipping fee to be considered moderate, it should encourage systems to begin recycling, due either to the modified cost differential or the new funding for recycling efforts generated by the fees. However, if they are too high, they present a threat to an MSW system’s financial viability while it undergoes the transition from landfill dominated MSW service toward more recycling, nor to penalize communities that lack the necessary conditions and resources for this transition. A first test for a state or system is to ask, “How does a proposed surcharge compare with tipping and surcharge rates at other landfills, nationally or in their state or region, especially those with similar waste, economic, and environmental conditions?”
While surcharges affect costs only minimally, it is reasonable to assume they are passed along to the original waste generator, thereby raising the cost of waste disposal relative to other management options, including recycling and composting. This may help address difference in cost between landfill disposal (which are usually lower) versus recycling and composting (which are usually higher). Addressing this difference is especially important when revenues from the sale of recovered recyclables are in a market downswing. Increasing surcharges for landfill disposal could increase economic pressures and incentives for recycling and composting.
Surcharges can further reduce the price differential between landfilling and recycling if the revenues generated are allocated by state governments to support local recycling efforts (or other MSW treatment, including composting or other treatments of organics). These funds could offset the cost of local recycling operations by being allocated to recycling enterprise funds, or could support grants for local recycling infrastructure, fund local social modeling programs (i.e., locally organized programs that promote recycling norms and behaviors [see Section 6.3 in Chapter 6]). The funds could even support research efforts that inform recycling systems and promote their cost efficiency.
The economic pressure and incentive to recycle from landfill tipping fee surcharges would be felt by consumers differentially. For example, businesses and rural households that pay for private waste hauling (and rural households that transport their own waste for disposal) would see the direct effects of this policy and have greater incentives to substitute recycling for disposal, when possible, as well as reducing their overall waste generation. Local governments that pay for MSW collection will likewise have stronger economic incentives to provide curbside and recycling drop-off programs and municipal composting programs. Households served by these government-funded systems may see an increase in taxes or waste management fees, but not a change in costs that would motivate changes in their waste management behavior. Exceptions would include households covered by pay-per-bag or subscription programs that are sensitive to the waste quantities. Thus, a limitation of this policy is that it may not encourage appropriate or desired changes in behavior for these households, which make up most of the population.
Additional disadvantages of this policy may arise but can be managed by keeping landfill tipping fee surcharges at an appropriate level. For waste generators who experience greater direct costs of disposal, surcharges may encourage not only reuse and recycling, but also illegal dumping of waste or greater contamination of recycled materials. The unintended adverse effect of a landfill surcharge on illegal dumping is likely to vary by location and the associated demographic characteristics of that locality. Residents of rural areas may have easy access to unmonitored locations for dumping waste illegally; urban locations could also see illegal dumping in vacant lots or in commercial dumpsters, if those locations are not monitored. Revenues raised from surcharges could be spent on efforts to monitor and/or discourage illegal disposal and “wish-cycling” behavior (i.e., the act of placing non-recyclable items in recycling bins under the mistaken assumption that they can be processed, leading to contamination and inefficiencies in recycling systems).
The distribution of burdens of landfill tipping fee surcharges may also be a concern. As described above, direct costs of waste management will rise for households that transport waste to landfills themselves or pay for private waste hauling. It will also raise costs for local governments who will see an increase in their waste management fees. When local governments use enterprise funding for MSW and impose uniform charges across all households, these increased costs will place a higher relative burden on low-income families than on high-income families. Some of these effects might be mitigated by focusing the redistribution of surcharge revenue to address recycling costs for the households most burdened by the surcharges. Lastly, for local government-owned and -operated landfills, landfill tipping fees are often used to support general funds for other government-provided public goods. If the tipping fee surcharges work as intended and decrease the amount of recyclable material entering a landfill, these landfills may see a decline in revenue that reduces funding for local governments.
Landfill tipping fee surcharges to encourage and support recycling need to be mandated at the state rather than local level. Some local governments own and operate their own landfill and therefore have different incentives for the volume of waste that is landfilled. Furthermore, residents or business could bypass local surcharges could be bypassed by transporting waste to landfills in localities without surcharges. State governments can tailor surcharge levels to their appropriate state-level conditions and can choose the appropriate local governments and program to receive the funds raised.
Especially as compared with other policy options for recycling, the time frame necessary to implement surcharges on landfill tipping fees could be short. If a state legislature adopts or increases a landfill surcharges, changes can likely begin within 1–2 years. Funding for recycling programs arising from these surcharges can thus likely be available within 2–3 years (i.e., 1 fiscal year after the initiation of the surcharge). To measure its effectiveness as a policy, states could monitor both funds raised and MSW diversion
rates. However, states also need to consider evidence of increased illegal disposal or recycling contamination from segments of the MSW system that see direct effects of the surcharges.
Conclusion 4-2: State-based landfill tipping fee surcharges can provide a dedicated revenue source to support recycling programs and can provide incentives for waste diversion from landfills (especially recyclable materials and organics) from landfills. As such, landfill tipping fee surcharges can offset some of the costs of recycling, enhance social and environmental benefits associated with recycling, and provide stable financing for recycling systems.
Key Policy Option 4-3: State governments could implement mandatory surcharges on landfill tipping fees to provide incentives for recycling, support recycling and composting efforts, and divert waste from landfills. Moderate surcharges would minimize harmful responses (e.g., illegal dumping, increased contamination of recycling streams). State governments could collect and redistribute the funds to various recycling activities based on state and local priorities. Local uses of these revenues may vary with needs but could include grants for recycling infrastructure, shoring up enterprise funds for recycling operations, and funding local social modeling programs.
4.6.3 Federal and State Government Funding for Tribal and Rural Recycling Programs
One of the primary objectives of MSW management programs is to make it easy and convenient for residents to participate in them. Achieving this objective is a key reason why curbside collection services are provided on a regular basis to single-family residences.
While this type of service can be provided cost-efficiently to residents in urban and suburban communities, curbside collection is cost-prohibitive for many tribal and rural communities because of their low population density and long distances between households. While 80 percent of the United States is rural land, only about 20 percent of U.S. households are located in these areas. Therefore, the primary method of providing recyclables and organics collection to rural communities is through drop-off recycling and composting centers.
While the economics of recycling in rural parts of the United States are different from suburban or urban settings, recycling can sometimes provide similar benefits. Recycling in these areas can reduce landfilled waste and ensure that landfills last longer. Recycling services can provide similar job availability as in urban settings and achieve positive environmental benefits over alternative means of disposal. However, overall life cycle impacts of materials are different in rural settings from urban settings; this heterogeneity is an important consideration for tribal and local governments in rural settings when determining which materials to accept in their recycling programs. As discussed in Chapter 2, local governments need to conduct assessments based on sustainable materials management and set goals to ensure their programs are both economically and environmentally sound.
Recycling programs in rural areas face other economic challenges besides low population density. In general, these programs have higher transportation costs than urban settings; they tend to have more difficulty in reaching end markets for recycled materials, and in reaching economies of scale. As mentioned in Chapter 3, a hub-and-spoke system may help address these challenges.
Rural recycling programs have other economic differences compared with urban settings. Local drop-off centers and facilities that process fewer amounts and different kinds of materials often have lower capital cost requirements than MRFs in urban settings. Operational costs (e.g., staffing) may also be lower, but access to capital and financing to cover those operational costs may be less reliable than in urban areas. As such, alternative financing models may be needed to design cost-efficient and environmentally sound rural recycling programs. Alternative funding mechanisms for rural recycling areas include dedicated financing generated from statewide federal level grants such as the Solid Waste Infrastructure for Recycling programs, state-level EPR policies that promote recycling programs in rural areas, and landfill tipping fee surcharges.
While tribal and rural recycling often run into similar issues—such as lack of infrastructure; long distances to access waste disposal; recycling, or composting; and lack of funding−−tribal recycling programs face many unique challenges. If a reservation-based tribe is not checkerboarded with non-tribal residents (i.e., if the land is solely tribal land), then they often are responsible for their own solid waste responsibilities as they are not tied to a municipality or county collection system. Funding is seriously lacking to address this problem, since tribal programs are not locally, state or federally funded. These locations may have reduced populations without the ability to collect taxes to cover costs, substantially raising the fees to address open dumping of solid waste. Cultural differences also arise between tribes and rural citizens. Tribal citizens who live on reservations solely inhabited by tribal members believe that the U.S. government will provide for them based upon treaty rights that are in place. Non-tribal citizens who live in rural areas may try to do the right thing but many simply do not want to pay to dispose of their waste and therefore dump it wherever they can—to avoid paying fees.
Unique challenges are also present for each tribe. Of the 574 sovereign tribal nations across the United States and Alaska, 229 are Alaskan Native Villages. Nearly half of those Alaskan Nations must send out their waste by barges or planes that may only be able to operate for 6 months of the year. For example, the Alakanuk Traditional Tribe of Alakanuk, Alaska, does not have good roadways in and out of the Village, so waste is addressed through barges and planes. Conversely, the Chickaloon Village of Palmer and Sutton, Alaska, relies on its roadways to dispose of waste. The Fort Belknap Indian Community, the fourth largest reservation in Montana is only 40 miles south of the Canadian border. This community have challenges with finding resources for waste disposal because of the distance from larger communities. The Mille Lacs Band of Ojibwe, located in East Central Minnesota approximately 2 hours north of Saint Paul, Minnesota, has developed a successful hub and spoke system but funding remains a challenge.
Conclusion 4-3: Relying on local government financing limits access to recycling programs, particularly for residents of rural areas, where recycling costs are high. It also limits access for many small business owners, who often face difficulties participating in municipal recycling programs. Alternative funding mechanisms, such as state or federal grants or EPR programs, would help distribute recycling costs across a broader population.
Key Policy Option 4-4: The U.S. Congress and state legislatures could authorize and appropriate funds for rural and tribal recycling. These funds could help communities overcome transportation distances and achieve economies of scale, through purchase of infrastructure such as trucks, drop-off and transfer facilities, and processing facilities. In parallel, the U.S. Environmental Protection Agency could continue to provide Solid Waste Infrastructure for Recycling grants for rural and tribal communities. State government funding could be derived from revenues generated from extended producer responsibility policies, landfilling tipping fee surcharges, or other state-based revenues.
REFERENCES
Ackerman, F.D., J. Stutz, and B. Zuckerman. 1995. Preliminary analysis: The costs and benefits of bottle bills. 94(229) Tellus Institute.
Anshassi, M., and T.G. Townsend. 2023. The hidden economic and environmental costs of eliminating kerbside recycling. Nature Sustainability 6(8):919–928.
Anshassi, M., and T.G. Townsend. 2024. Residential recycling in Florida: A case study on costs, environmental impacts, and improvement strategies. Resources, Conservation and Recycling 206. https://doi.org/10.1016/j.resconrec.2024.107627.
Arrow, K. 1970. Political and economic evaluation of social effects and externalities. In The analysis of public output (pp. 1–30). National Bureau of Economic Research. http://www.nber.org/chapters/c3349.
Ashenmiller, B. 2010. Externalities from recycling laws: Evidence from crime rates. American Law and Economics Review 12(1):245.
Ashenmiller, B. 2009. Cash recycling, waste disposal costs, and the incomes of the working poor: Evidence from California. Land Economics 85(3):539–551.
Basuhi, R., K. Bhuwalka, R. Roth, and E.A. Olivetti. 2024. Evaluating strategies to increase PET bottle recycling in the United States. Journal of Industrial Ecology 1–12. https://doi.org/10.1111/jiec.13496.
Berck, P., G. Englander, S. Gold, S. He, J. Horsager, S. Kaplan, M. Sears, A. Stevens, C. Trachtman, R. Taylor, and S.B. Villas-Boas. 2021. Recycling policies, behavior and convenience: Survey evidence from the CalRecycle program. Applied Economic Perspectives and Policy 43(2):641–658. https://doi.org/10.1002/aepp.13117.
Berck, P., M. Sears, R.L.C. Taylor, C. Trachtman, and S.B. Villas-Boas. 2024. Reduce, reuse, redeem: Deposit-refund recycling programs in the presence of alternatives. Ecological Economics 217:108080. https://doi.org/10.1016/j.ecolecon.2023.108080.
Burrows, P. 1979. Pigovian taxes, polluter subsidies, regulation, and the size of a polluting industry. The Canadian Journal of Economics/Revue canadienne d’Economique 12(3):494–501.
Calcott, P., and M. Walls. 2005. Waste, recycling, and “Design for Environment”: Roles for markets and policy instruments. Resource and Energy Economics 27(4):287–305.
CalRecycle. 2021. Carpet Stewardship Law. https://www.calrecycle.ca.gov/carpet/law.
Circular Needs Alliance. 2024. Colorado needs assessment. Circular Action Alliance. https://circularactionalliance.org/co-needs-assessment.
Comineti, C.D.S.S., M.M. Schlindwein, and P.H. de Oliveira Hoeckel. 2024. Socio-environmental externalities of sewage waste management. Science of The Total Environment 945:174109.
Container Recycling Institute. 2024. https://www.container-recycling.org/index.php/key-facts.
Cooperman, A., A. Eberle and E. Lantz. 2021. Wind turbine blade material in the United States: Quantities, costs, and end-of-life options. Resources Conservation and Recycling 168:105439. https://doi.org/10.1016/j.resconrec.2021.105439.
Cremer, H., F. Gahvari, and N. Ladoux. 1998. Externalities and optimal taxation. Journal of Public Economics 70:343–364.
Critchell, K., L. Edge, and M.J. Traurig. 2023. Legacy community science data suggest reduced beached litter in response to a container deposit scheme at a local scale. Marine Pollution Bulletin 195(1):115471.
Crowe, LLP. 2024. Study results: Processor commodity risk fee and contamination management fee. https://www.oregon.gov/deq/recycling/Documents/croweCRPFfeesRep.pdf.
Duran, A.S., A. Atasu, and L.N. Van Wassenhove. 2021. Cleaning after solar panels: Applying a circular outlook to clean energy research. International Journal of Production Research 60(1):211–230. https://doi.org/10.1080/00207543.2021.1990434.
EPA (U.S. Environmental Protection Agency). 2013. MSW Residential/Commercial Percentage Allocation–Data Availability. Office of Resource Conservation and Recovery. https://www.epa.gov/sites/default/files/2016-01/documents/rev_10-24-14_msw_residential_commercial_memorandum_7-30-13_508_fnl.pdf.
EPA. 2022. The Bipartisan Infrastructure Law: Transforming U.S. Recycling and Waste Management. U.S. Environmental Protection Agency. https://www.epa.gov/system/files/documents/2022-02/orcr_bil_brochure.pdf.
EPA. 2024. Consumer Recycling Education and Outreach (REO) Grant Program. https://www.epa.gov/system/files/documents/2024-09/24-12.pdf.
EPA. 2025a. Recycling Grant Selectees and Recipients. January. https://www.epa.gov/infrastructure/recycling-grant-selectees-and-recipients.
EPA. 2025b. Solid Waste Infrastructure for Recycling Grant Program. February. https://www.epa.gov/infrastructure/solid-waste-infrastructure-recycling-grant-program#about.
EREF (Environmental Research & Education Foundation). 2024. Analysis of MSW Landfill Tipping Fees—2023. www.erefdn.org.
Fullerton, D., and T.C. Kinnaman. 1995. Garbage, recycling, and illicit burning or dumping. Journal of Environmental Economics and Management 29(1):78–91. https://doi.org/10.1006/jeem.1995.1032.
Fullerton, D., and T.C. Kinnaman. 1996. Household responses to pricing garbage by the bag. American Economic Review (September).
Fullerton, D., and A. Wolverton. 2000. Two generalizations of a deposit-refund systems. American Economic Review 90(2):238–242.
Fullerton, D., and W. Wu. 1998. Policies for green design. Journal of Environmental Economics and Management 36(2):131–148.
Goddard, H.C. 1995. The benefits and costs of alternative solid waste management policies. Resources, Conservation and Recycling 13(3–4):183–213.
ICMA (International City/County Management Association). 2019. 2017 Alternative Service Delivery Survey – Summary of Survey Results. Washington, DC: ICMA. http://icma.org.
Jenkins, R.R. and K.B. Maguire. 2012. An examination of the correlation between race and state hazardous and solid waste taxes. In H.S. Banzhaf (ed.), The political economy of environmental justice (pp. 249–266). Stanford University Press.
Joltreau, E. 2022. Extended producer responsibility, packaging waste reduction and eco-design. Environmental and Resource Economics 83:527–578. https://doi.org/10.1007/s10640-022-00696-9.
Lange, R. 2012. Resource Recycling. https://www.resource-recycling.com/images/e-newsletterimages/Lange0212rr.pdf.
Levitt, L., and G. Leventhal. 1986. Litter reduction: How effective is the New York State Bottle Bill? Environment & Behavior 18(4):467.
Lifset, R., H. Kalimo, A. Jukka, P. Kautto, and M. Miettinen. 2023. Restoring the incentives for eco-design in extended producer responsibility: The challenges for eco-modulation. Waste Management 168:189–201. https://doi.org/10.1016/j.wasman.2023.05.033.
Lindhqvist, T. 2000. Extended producer responsibility in cleaner production. IIIEE dissertation. https://www.iiiee.lu.se/thomas-lindhqvist/publication/e43c538b-edb3-4912-9f7a-0b241e84262f.
Lindhqvist, T., and K. Lidgren. 1992. Towards an extended producer responsibility-analysis of experiences and proposals. Ministry of the Environment and Natural Resources. Stockholm.
Lindhqvist, T., and K. Lidgren. 1990. “Modeller för förlängt producentansvar” (“Models for Extended Producer Responsibility,” in Swedish). Ministry of the Environment, From the Cradle to the Grave – Six Studies of the Environmental Impact of Goods 7–44.
Massarutto, A. 2024. Monetary evaluation in LCA of WM: Everything engineers always wanted to know about it (but were afraid to ask). Waste Management 178:12-25.
Matheson, T. 2022. Disposal is not free: Fiscal instruments to internalize the environmental costs of solid waste. International Tax and Public Finance 29:1047–1073. https://doi.org/10.1007/s10797-022-09741-1.
Matthews, H.S., and L.B. Lave. 2000. Applications of environmental valuation for determining externality costs. Environmental Science & Technology 1390–1395.
Mazancourt, T., A. Thonier, P. Follenfant, M. Pascal, C. Ghesquieres, M. Outters-Perehinec, G. Mikowski, and A. Paugam. 2024. Performance and governance of sectors with extended producer responsibility. Ministry of Economy, Finance and Industrial and Digital Sovereignty. https://www.economie.gouv.fr/cge/filieres-rep.
Medina-Mijangos, R., A. De Andrés, H. Guerrero-Garcia-Rojas, and L. Seguí-Amórtegui. 2021. A methodology for the technical-economic analysis of municipal solid waste systems based on social cost-benefit analysis with a valuation of externalities. Environmental Science and Pollution Research 28(15):18807–18825.
Mendelsohn, R., and S. Olmstead. 2009. The economic valuation of environmental amenities and disamenities: Methods and applications. Annual Review of Environment and Resources 34(1):325–347.
Nahman, A. 2011. Pricing landfill externalities: Emissions and disamenity costs in Cape Town, South Africa. Waste Management 31(9–10):2046–2056.
NCSL (National Conference of State Legislatures). 2020. State Beverage Container Deposit Laws.
NCSL. 2021. States with Landfill Tipping Charges. https://cdn.ilsr.org/wp-content/uploads/2022/02/State-land-fill-tipping-surcharges.2021.pdf.
ODEQ (Oregon Department of Environmental Quality). 2012. Materials Management in Oregon: 2050 Vision and Framework for Action. State of Oregon Department of Environmental Quality. https://www.oregon.gov/deq/filterdocs/mmanagementor.pdf.
ODEQ. 2023. Overview of Scenario Modeling: Oregon Plastic Pollution and Recycling Modernization Act. State of Oregon Department of Environmental Quality. https://www.oregon.gov/deq/recycling/Documents/RMAModeling-ExecSum.pdf.
OECD (Organisation for Economic Co-operation and Development). 2001. Extended producer responsibility: A guidance manual for governments. OECD Publishing, Paris. https://www.oecd-ilibrary.org/environment/extended-producer-responsibility_9789264189867-en.
Oregon Recycling Beverage Cooperative. 2023. Delivering Results for Oregon: 2023 Annual Report. https://obrc.com/wp-content/uploads/2024/03/About_Reports_2023_Annual.pdf.
Paes, M.X., G.A. de Medeiros, S.D. Mancini, A.P. Bortoleto, J.A.P. de Oliveira, and L.A. Kulay. 2020. Municipal solid waste management: Integrated analysis of environmental and economic indicators based on life cycle assessment. Journal of Cleaner Production 254:119848.
Pressley, P.N., J.W. Levis, A. Damgaard, M.A. Barlaz, and J.F. DeCarolis. 2015. Analysis of material recovery facilities for use in life-cycle assessment. Waste Management 35:307–317. https://doi.org/10.1016/j.wasman.2014.09.012.
Product Stewardship Institute, Inc. 2025. https://productstewardship.us.
Recycling Today. 2015. Weight of water bottles decreases, while recycled content increases. https://www.recyclingtoday.com/news/water-bottle-weight-decreases-recycled-content-increases.
Reelop. 2021. Handling fees in deposit return systems. https://www.reloopplatform.org/wp-content/uploads/2021/05/DRS-Fact-Sheet-Handling-Fees-4May2021.pdf.
Resource Recycling. 2022. From green fence to red alert: A China timeline. https://resource-recycling.com/recycling/2018/02/13/green-fence-red-alert-china-timeline.
Sheahan, J. 2024. Comments to the Committee on Costs and Approaches for Municipal Solid Waste Recycling Programs. National Academies of Sciences, Engineering, and Medicine.
Sigman, H. 2020. Deposit refunds. In K. Richards and J. van Zeben (eds.), Policy instruments in environmental law. Cheltenham, UK: Edward Elgar (pp. 377–386). https://doi.org/10.4337/9781785369520.
Smith, B.L., A. Sekar, H. Mirletz, G. Heath, and R. Margolis. 2024. An Updated Life Cycle Assessment of Utility-Scale Solar Photovoltaic Systems Installed in the United States. Golden, CO: National Renewable Energy Laboratory. NREL/TP-7A40-87372. https://www.nrel.gov/docs/fy24osti/87372.pdf.
Sovacool, B.K., J. Kim, and M. Yang. 2021. The hidden costs of energy and mobility: A global meta-analysis and research synthesis of electricity and transport externalities. Energy Research & Social Science 72:101885.
Sustainable Packaging Coalition. 2016. 2015–16 Centralized Study on Availability of Recycling.
The Recycling Partnership. 2020a. 2020 State of Curbside Recycling Report. https://recyclingpartner-ship.org/wp-content/uploads/dlm_uploads/2020/02/2020-State-of-Curbside-Recycling.pdf.
The Recycling Partnership 2020b.2020 Guide to Community Material Recovery Facility Contracts. https://recyclingpartnership.org/mrf-contracts.
The Recycling Partnership. 2024. State of Recycling: The Past and Present of Residential Recycling in the US, 2024. https://recyclingpartnership.org/wpcontent/uploads/dlm_uploads/2024/01/Recycling-Partnership-State-of-Recycling-Report-1.12.24.pdf.
TOMRA. 2023. Bottle bill states and how they work. https://www.tomra.com/reverse-vending/media-center/feature-articles/bottle-bill-states-and-how-they-work.
TOMRA. 2025. Rewarding recycling: Lessons from the world’s highest performing deposit refund systems. https://circular-economy.tomra.com/resources/drs-white-paper.
UNC (University of North Carolina) School of Government. 2024. North Carolina Benchmarking Project Benchmarking 2.0. https://benchmarking.sog.unc.edu.
U.S. Census. 2024. Annual Survey of State and Local Government Finances and Census of Governments downloaded through Tax Policy Center web tool. https://state-local-finance-data.taxpolicycenter.org.
Viscusi, K.W., J. Hueber, and J. Bell. 2012. Alternative policies to increase recycling of plastic water bottles in the United States. Review of Environmental Economics and Policy 6(2):190.
Walls, M., M.K. Macauley, and S.T. Anderson. 2003. The Organization of Local Solid Waste and Recycling Markets: Public and Private Provision of Services. Resources for the Future. https://doi.org/10.22004/ag.econ.10892.
Walls, M., M.K. Macauley, and S.T. Anderson. 2005. Private markets, contracts, and government provision. Urban Affairs Review 40(5):590–613.


