Data Fusion of Probe and Point Sensor Data: A Guide (2024)
Chapter: 2 Data Examples
CHAPTER 2
Data Examples
While data fusion is an extremely broad topic, this document and the associated fusion framework is focused solely on the fusion of two classes of vehicle data: (1) point-sensor data (such as inductive loop or side-fired microwave radar volume and speed data) and (2) probe-based speed data from third-party private-sector vendors.
2.1 Point-Sensor Data
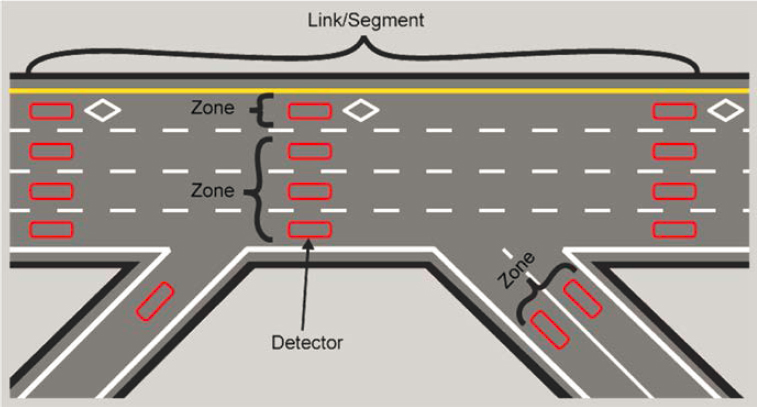
For purposes of this document and the described fusion framework, point-sensor data are volume, classification, and/or speed data that are collected from sensors that are installed on or adjacent to the roadway and provide measurements for either a single lane or a zone spanning multiple lanes, as shown in Figure 2.
There are many different technologies used to collect volume and speed data at individual locations (or points) on the roadway. While inductive loops, magnetometer pucks embedded in roadways, video detection systems, and side-fired microwave detection seem to be more commonly deployed by agencies, there are many other types of sensors available and in use around the world. Common point sensor types available to DOTs are listed in Table 1.
What makes all of these sensors similar is that they are taking their measurements at very specific points on the roadway, rather than continuously tracking vehicles and measuring their speeds wherever they may be. What is dissimilar about these different sensor technologies is how they detect vehicles, where they are installed, and the attributes that they may collect beyond speed (Klein 2020). The Traffic Detector Handbook: Third Edition—Volume I (FHWA 2006a) and Volume II (FHWA 2006b), while nearly 18 years old at the time of this writing, comprehensively cover many of the different concepts on the theory of operation behind different types of sensors along with other information on the applications of these sensors, design and installation, and troubleshooting.
Regardless of the specific sensor technology deployed, agencies configure their sensor systems to collect and report data in different formats, time intervals, and geospatial representations. Some agencies will retrieve (or poll) a detector 10 times/second (10 Hz) while others may poll a detector every 20, 30, or 60 seconds. Some go as far as collecting speeds and volumes only every 5 minutes for operations and hourly for planning applications. While most agencies average speeds across a zone and sum volumes, others may report individual lane measurements. Still others may combine data from multiple sensors and multiple zones along a stretch of the roadway (called a link or segment), especially for freeway operations. At traffic signals, some sensors may be used less for volume and speed data collection, and instead be configured solely for presence detection.
The details of how (and why) an agency collects data from point sensors—including which measurements are collected over which time intervals—may be critical to know when prepping the data for fusion and in determining whether the data are appropriate for a given use case.
© 2007 University of Maryland Center for Advanced Transportation Technology (CATT) Laboratory/Michael Pack
Table 1. Examples of point sensors (types, attributes, and manufacturer).
| Sensor Category | Sensor | Attributes | Manufacturer(s) |
|---|---|---|---|
| Inductive Loops (In-Roadway) | Single Loop | Volume, Speed, Occupancy based on assumed vehicle length | Many |
| Double Loop (Speed-Trap Configuration) | Volume, Speed, Occupancy, Class | Many | |
| Side-Fired Sensors | Microwave | Speed, Volume, Class | RTMS |
| Acoustic | Speed, Volume | Wavetronix | |
| Front-Facing Radar | Microwave Radar | Speed | Iteris Vantage Vector |
| Pucks (In-Roadway) | Embedded Pucks/Magnetometer | Speed, Volume, Classification, and some Reidentification | Sensys |
| Video | Stop Bar/Presence | Speed, Volume, Short-Range Trajectory, Classification | Iteris Vantage, TrafficVision, ISS |
| Reidentification | Volume, Class, Speed, Origin, Destination, Travel Time | Rekor | |
| Tubes | Temporary tubes laid across a roadway | Volume, Speed, Classification | Many |
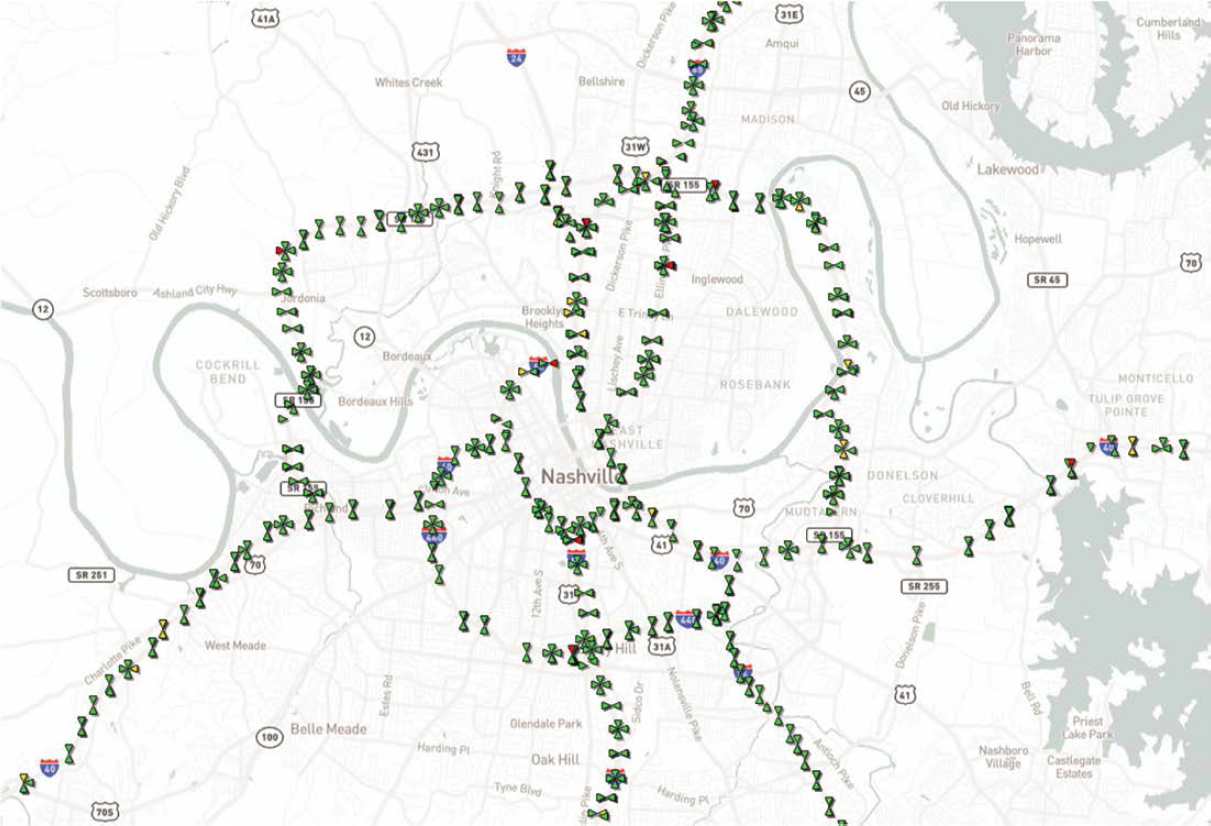
Figure 3 shows a typical sensor deployment density in a typical urban area to support real-time operations and analysis of traffic flow leading in and out as well as around the urban area.
2.2 Probe-Based Data
For the purposes of this project, probe data are classified as any data collected by a device that is moving through a network. This includes devices like cell phones or nav systems and telemetry data provided directly by connected vehicles (CVs). Probe data that require roadside
infrastructure (like Bluetooth or Wi-Fi reidentification technology) are intentionally excluded. Probe data are further classified into the following categories:
- Speed and Travel Time Data. This is the primary probe data source that was intended for this study, and will be covered the most.
- Mobility Data. The following mobility probe datasets are included as they have been identified as potentially relevant in addition to the previously mentioned speed data for several use cases.
- Real-time pings/raw location-based services (LBS): LBS raw data are location information points obtained from applications such as Facebook, a weather app, or similar app installed and running on a cellular phone, tablet, or similar device. The app collects the location of the device (and occasionally other information about the user). LBS data are usually more “raw” than other datasets, requiring more processing and analysis to turn it into something usable.
- Origin-Destination (O-D) Data: Only data about the beginning location and the ending location of a trip. O-D data do not include information about the routes taken to get from the origin to the destination.
- Routing Data: These datasets include substantially more detail about a trip than origin-destination data by themselves. They can be obtained from CV and LBS data, and where they come from has an impact on how they can and should be used in operations and planning.
- CVs Event Data. These include data obtained from the vehicle itself, not a device riding in the vehicle. These data are generally sent directly from the vehicle to the original equipment manufacturer (OEM) via Wi-Fi/cellular communications embedded in the vehicle.
- Mobile Device Event Data. Some companies source data from the companies that develop mobile device apps for the insurance industry to track driver behaviors in exchange for improved insurance rates.
Examples of these datasets for each of the categories are listed in Table 2.
2.2.1 Probe-Based Speed Data
Probe-based speed data from CVs are the primary focus of this data fusion framework study. These speed data have been on the market since the mid-2000s, but grew in popularity in 2008 when the I-95 Corridor Coalition (now called The Eastern Transportation Coalition, or TETC) funded the purchase of data for all of the I-95 corridor and surrounding arterials. Probe-based speed data have been well-studied and largely validated by agencies, universities, and consortia alike.
Unlike point sensors, which collect data only at the location where it has been installed, probes can collect data along roadway segments without having to install any infrastructure. CVs that
Table 2. Probe data examples.
| Data Type | What It Is | What It Is Not | Who Has It |
|---|---|---|---|
| Speed/Travel Time Data |
|
|
|
| LBS Raw Ping Data |
|
|
|
| O-D Data |
|
|
|
| Data Type | What It Is | What It Is Not | Who Has It |
|---|---|---|---|
| Routing Data |
Complete information about individual trips including:
Trips data are typically not aggregated—meaning one can see individual vehicle movements along a roadway |
|
|
| CVs Event Data |
|
|
|
| Event Data from High-Frequency Mobile Device Apps | Event data derived from mobile devices inside of vehicles, including:
|
|
|
have a Global Positioning System (GPS) installed in them provide their location every few seconds or minutes, and probe data providers then perform computations on these movements to produce a speed for that road segment. For example, one might measure the distance traveled (along with the distance and speeds of other probes on the same roadway) to compute a space-mean speed of the segment. Figure 4 shows an example of probes moving across several segments over time.
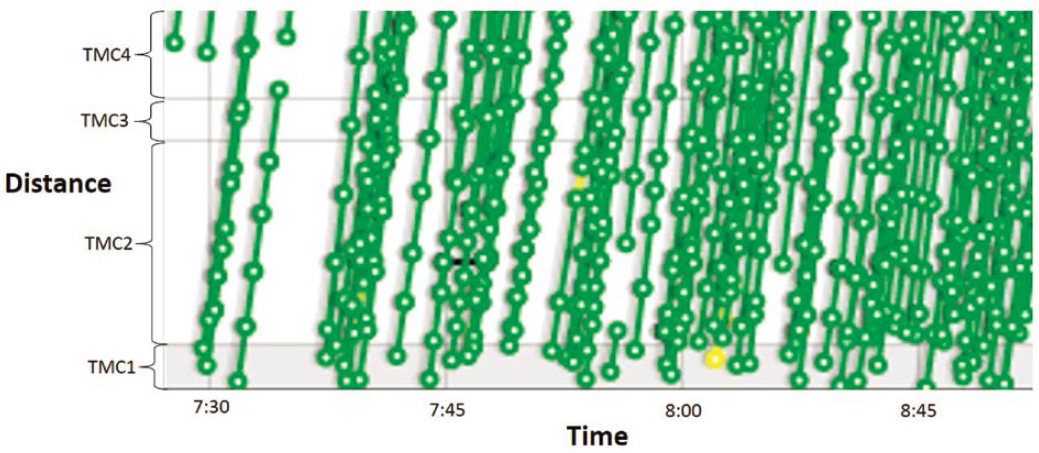
Source: INRIX
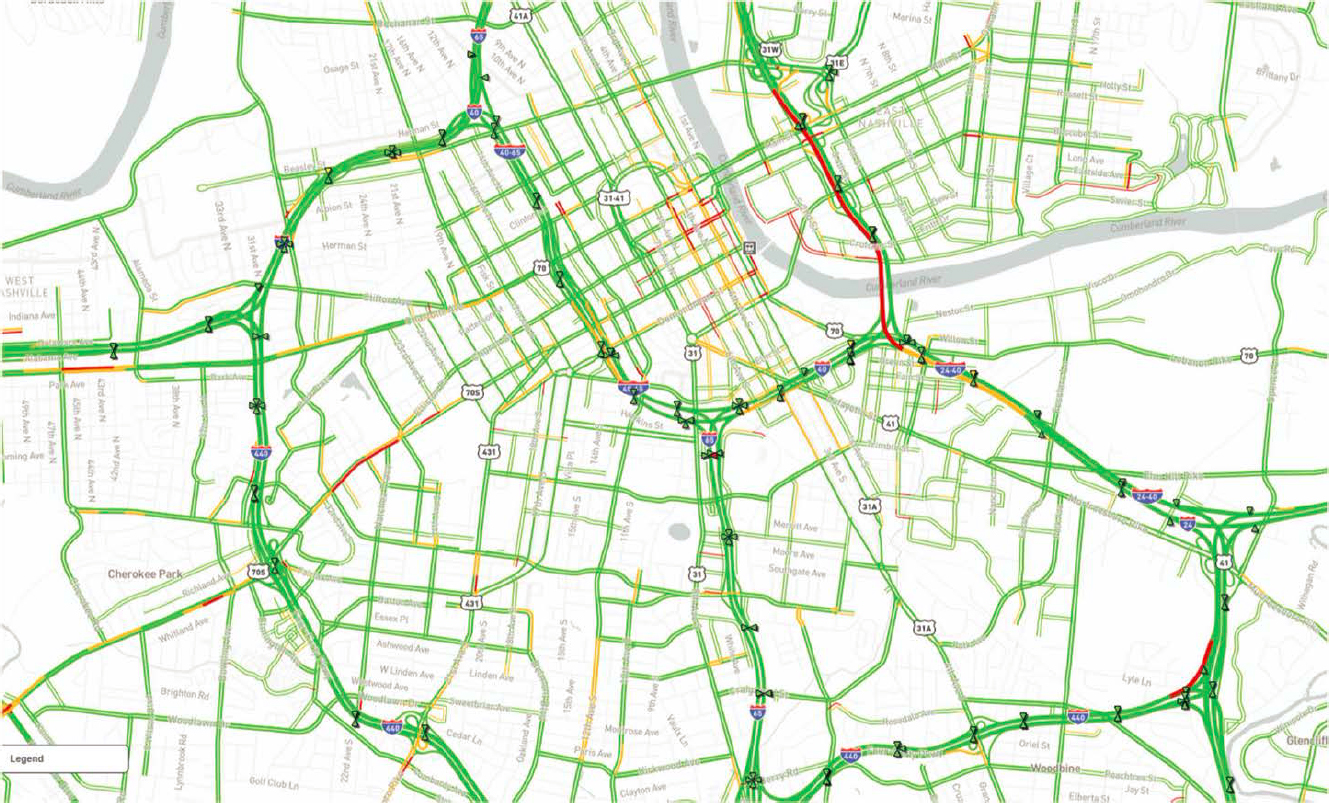
The result is the capability to measure or impute speeds on nearly all roads all the time without having to install any roadway infrastructure. Figure 5 shows a map of the Nashville, Tennessee, downtown area. Wherever a road has color on it, the probe data vendor is measuring and providing a speed reading. The small triangles on the map represent the location of point sensors and are seen mainly on interstates. Note the difference in coverage, especially on arterials. To get the same coverage, many thousands of sensors would need to be deployed on interstates and all local roads which would be cost prohibitive in terms of initial deployment costs and long-term maintenance.
Most vendors provide real-time speed data to DOTs every minute of every day. These data can be provided on both static and dynamic roadway networks. The way in which the roadway is segmented varies from vendor to vendor with several having proprietary segmentations. Some vendors also have ways to provide dynamic segmentation—which means the length of the segments or not fixed. Instead, they can grow or shrink as congestion (or queues) grow or shrink along the roadway. Dynamic segmentation can be more difficult for certain data fusion algorithms as the way in which the roadway is defined can constantly change. This can make spatial data fusion (discussed in Chapter 5) more complex.
Not every roadway segment has a probe on it every minute of every day. In these cases, probe data vendors have proprietary algorithms that leverage nearby probes, upstream and downstream traffic, nearby event and incident data, historic measurements, or other methods to generate a “best guess” as to the current speed. Most vendors include a variable in their data that gives the user a sense of the confidence that the provider has in their speed calculation which is often an indicator of whether probes have been seen on the roadway recently.
While the quality of most vendor’s data products is high, there are exceptions. On extremely low-volume roads and/or roads where no cellular coverage exists, the vendors may struggle to provide reliable and/or real-time data all the time. Additionally, all vendors struggle with roads that are completely closed (or on which traffic has come to a complete standstill) due to major snowstorms, long-duration crashes, flooding, or other events. The challenge is that when roads are closed, there are no probes moving down the roadway to be detected. This scenario may be challenging to vendors, yet point sensors do not fall victim as readily to these conditions.
2.2.2 Mobility Data
While the focus of this report is probe-based speed data from CVs, it is important to note that there are other data sources that can be derived from probes. Mobility data is one example of additional probe-based data that comes in multiple forms, including O-D data and waypoint data.
Waypoint data are the underlying information used to produce both speed and O-D data. Waypoints are the “pings” of CVs or mobile devices that represent a breadcrumb trail of a vehicle or device traversing a path between an origin and destination. Waypoints may be captured at widely varying frequencies ranging from every few seconds to minutes depending on the provider.
Trips can be defined very differently between vendors, but are often classified as having ended after the vehicle or device stops moving for longer than 5–10 minutes. To protect privacy, some providers blur the beginning and end of trips within some distance (1 km, for example). Other privacy-protecting methods may include resetting the anonymized ID of the devices after the end of each trip or only showing O-D pairs when there are at least five or more trips between two locations.
2.2.3 Event Data
Certain types of events such as heavy braking, rapid acceleration, airbag deployments, weather, lane departures, and certain driver behaviors can also be detected from probes. These data can come directly from CVs with telematics or can sometimes be derived from mobile devices that collect location and accelerometry data.
While some providers can provide event data in real time, most providers are collecting vehicle event data at key-off and then transmit the events daily to the transportation agencies or other licensees. These daily transmissions (or key-off collection) are performed partially to preserve privacy, but also to save money as the collection and transmission (e.g., data rates) can be expensive for millions of vehicles to continuously stream and process. Batch processing at key-off or during evening hours can be less expensive.
There are real differences between event data collected directly from CVs and event data collected from mobile devices. CV event data may be based directly on sensors embedded within the vehicle that detect traction, temperatures, braking, wiper use, etc. OEMs that collect and transmit these data generally have tight privacy controls and limits on what can and cannot be done with these data, which can limit their effectiveness in certain situations and operations use cases.
Event data sourced from mobile devices (such as cell phones) can include some of the same attributes as can be found in CV data sources, but the data are collected differently. Location intelligence companies may have partnerships with insurance companies that reward safe drivers with lower rates. These insurance companies encourage the public to install safe-driving apps on their phones. These apps look for occurrences such as rapid acceleration, hard braking, device handling while the vehicle is in motion, and even lane departures. These data can then be anonymized and shared in aggregate with DOTs and safety researchers who are looking to identify locations on roadways that may be more susceptible to unsafe driving behaviors or conditions.
Speed, mobility, and event data are susceptible to changes in the market that could positively or negatively impact the quality and completeness of data. These risks and other considerations will be discussed in Chapter 4.


