Data Fusion of Probe and Point Sensor Data: A Guide (2024)
Chapter: 3 Data Fusion Use Case Examples and Descriptions
CHAPTER 3
Data Fusion Use Case Examples and Descriptions
There is significant potential to leverage both point-sensor and probe data in traffic operations, planning, and research. Some example use cases include items such as:
- Improving data quality (better travel times, speeds, etc.)
- Travel time prediction
- Speed prediction
- Queue length estimation
- Ramp metering control and evaluation
- Variable speed limit control and evaluation
- Incident detection
- Sensor location optimization
- Data validation and procurement support
- Activation/de-activation of hard shoulder running
- Identification/prediction of high-risk crash locations (the relationship between speed and volume directly impacts safety)
- Detouring and associated communication with public
- Dynamic signal timing adjustments
- Work zone management
- Special event management
- Hurricane evacuations
- Adverse weather event planning
There are real costs associated with fusing data from multiple sources. Costs can include legal fees to review data use agreements or negotiate data use terms, the cost to maintain and recalibrate sensors, the cost to implement a fusion methodology, and the ongoing computational costs of fusion. Some of these costs will be worth the increase in capabilities or data quality, while others may not. More complicated data fusion algorithms may not always yield better results, and not all better results will be worth the additional effort. That said, following are descriptions of several use cases that may have greater potential for positive ROI based on the research conducted during this study and interviews with DOTs and systems implementers.
3.1 Improving Data Quality
Despite the large number of validation studies and the growing trust in the quality of private-sector probe data products—especially on higher-volume interstates and urban corridors—some agencies still distrust probe data altogether or in certain scenarios (Vander Laan, et al. 2021). Examples of these scenarios include low-volume roads (especially during off-peak and nighttime conditions), roads that can change direction by time of day or day of week, high-occupancy
vehicle (HOV) lanes that are not separated, and complete road closure conditions that might occur during significant winter weather events or long-lasting crash delays. Most probe data speed providers send “indicators of quality” along with their speed measurements that provide agencies with a sense of when the vendor is having to impute or otherwise rely on historical data instead of relying on real-time measurements from probes.
With this use case, when an agency suspects (or when vendors report) low-quality speed data, agencies would theoretically leverage existing speed sensor data to validate and/or improve the quality of the real-time speed estimates at or near the location of the sensor.
Speed data are used in many different applications from travel-time predictions to end-of-queue warnings to variable speed limits (VSLs). All of these applications are more effective when the speed data behind them are of high quality, but these secondary use cases may not necessarily be fusion-method specific. So long as the fusion method leads to improved data quality, these use cases will benefit.
Several agencies are already implementing some form of fusion that improves data quality. Some are using very simplistic rank-choice fusion methodologies where others are using more complex machine learning algorithms. Each implementation has its pros and cons, and not all more complex and sophisticated algorithms are appropriate for each use case.
There are questions, however, about the quality of sensor data in many locations. While automatic traffic recorder (ATR) point sensors are usually calibrated and maintained given that they are used for federally mandated volume reporting, the same cannot be said for intelligent transportation systems (ITS) point sensors that are used more often for real-time monitoring and reporting. It is not uncommon to have over 50% of ITS point sensors broken or significantly out of calibration in some agencies. If agencies wish to use point sensor data to help improve the quality of probe data, they must first make sure that their point sensors are providing high-quality data themselves. Just because a sensor reports a measurement does not necessarily mean that the data are any good. It is possible that imputed probe-based speed data could be more representative of real-world conditions than many point sensor speed measurements.
Chapter 6 has additional information on how Utah DOT has implemented data fusion of point sensor and probe data for improving data quality.
3.2 Volume Estimation (Real Time, Monthly, Quarterly, or Other)
Probe-based speed data were innovative and transformed the transportation industry because they enabled the infrastructure-less speed measurements virtually anywhere. However, a similarly ubiquitous volume data source has been difficult to develop. To date, a good number of academic and private-sector groups have attempted to estimate volumes from a mix of probe-based speed data and agency-owned volume sensors (Sekula, et al. 2018) (Young, et al. 2020) (StreetLight Data 2022). Some of the algorithms employed have been relatively simple, though they have required knowledge of the sample size at any given moment, which is a data point many probe data providers are loath to share. Others have been more complex and looked not only at probe and volume data from sensors, but also weather data, incident/event data, and more.
Estimating volumes is not as simple as taking sensor measurements and conflating them to the roadway. It involves the expansion of the geography of the sensor, knowledge of the road capacity, and can often use annual average daily traffic (AADT) volume measurements in addition to (or in lieu of) real-time sensors. The goal is to reduce the dependence on volume sensors, and instead leverage probe data sample sizes and their speeds to estimate volumes. Given that probe
data samples can vary (and are theoretically improving each year), it is currently impossible to estimate volumes with probe data alone. Point-sensor data are still needed for this fusion use case.
Because volume data are so difficult to produce for the entire network, some agencies are hoping that they can simply purchase volume data directly from private-sector probe data providers and divest of their point-sensor infrastructure. However, agencies will need to continue to invest in their volume data collection for the foreseeable future, as the private sector relies on volume data from point sensors to calibrate their own models. It is possible that agencies may be able to better partner with the private sector in the future to deploy sensors more strategically to key locations while reducing coverage in other locations, but completely eliminating the need for any point sensors is still many years away.
Volume data from point sensors are a key input for other use cases listed in subsequent sections of this paper, including user delay costs, causes of congestion, and queue length prediction. Each of these applications may benefit from different types of volume estimation or direct measurements. For example, real-time volume estimation has the potential to provide more accurate estimates of user delay, but is not necessary for federally mandated volume data reporting—which only requires AADT. Quarterly volume data estimates that provide weekday vs. weekend estimates by hour of the day may suffice for certain applications and be easier to produce at a lower cost.
3.3 User Delay Cost
Calculating user delay requires speed data (usually from probes) and volume data (usually from point sensors) to determine the amount of delay per vehicle (and sometimes person) that is being experienced on the roadway. User delay is a useful measure by itself. It helps agencies humanize congestion and can be used to justify budgets and TSMO strategies. User delay can also be the basis for identifying and quantifying the causes of congestion, developing related congestion metrics and charts, and understanding the impacts of transportation operations, winter weather operations, certain third performance management rule (PM3) metrics from the FHWA Transportation Performance Management program (specifically the peak hour excessive delay metric), work zone performance metrics, and several emissions and environmental performance measures.
User delay data are used by several agencies and analytics platforms today, with many variations of fusion and implementation methodologies. Leveraging user delay cost for computing the causes of congestion is one of the example use cases described in Chapter 6.
3.4 Causes of Congestion
The location of congestion can be measured easily with probe data. Evaluating the patterns of congestion over longer periods of time (months or years) can reveal whether congestion at certain locations is recurrent or non-recurrent. As shown in the prior use case, if volume data are also provided, then the user delay associated with said congestion can be measured, which provides a better sense of the impact of the congestion. However, most agencies also want to know why congestion is occurring. Quantifying the amount of congestion requires the fusion of probe-based speed data and point-sensor volume data. However, with the addition of event data from CVs, OEMs, agency advanced traffic management systems (ATMS) platforms, police crash reports, weather, and other third parties, it is possible to begin to identify the reason why the location is congested. Figure 6 shows an example congestion causes dashboard that fuses multiple datasets to attribute congestion to various causes.

Source: University of Maryland CATT Laboratory
Understanding causation is what enables agencies to make better investment decisions related to congestion mitigation strategies. More on how to compute the causes of congestion can be found in Chapter 6.
3.5 Safety Analytics and High-Risk Crash Locations
While agencies can report and measure crashes that occurred, determining volume/speed causation and correlation and/or quantifying where near misses or dangerous conditions (heavy braking, traction control engagement, etc.) occur has proven elusive. The fusion of volumes, speed data, and connected vehicle event data would allow agencies to measure and understand the relationship between speed and volume and can assist in the identification and prediction of high-risk crash locations. These relationships along with additional connected vehicle event data could be leveraged to identify near misses and other dangerous locations. This could result in proactive safety countermeasures being deployed and could enable predictive safety analytics if correlation and causation are determined. Several agencies and universities are researching the use of CVs heavy braking data with mixed results. For example, the University of Central Florida’s Real-Time Crash Potential Prediction on Freeways Using Connected Vehicle Data research paper used connected vehicle data to predict crash potential (Zhang and Abdel-Aty 2022). Similarly, Indiana DOT and Purdue University used connected vehicle hard braking data to monitor the operations of work zones (Sakhare, Hunter, et al. 2022).
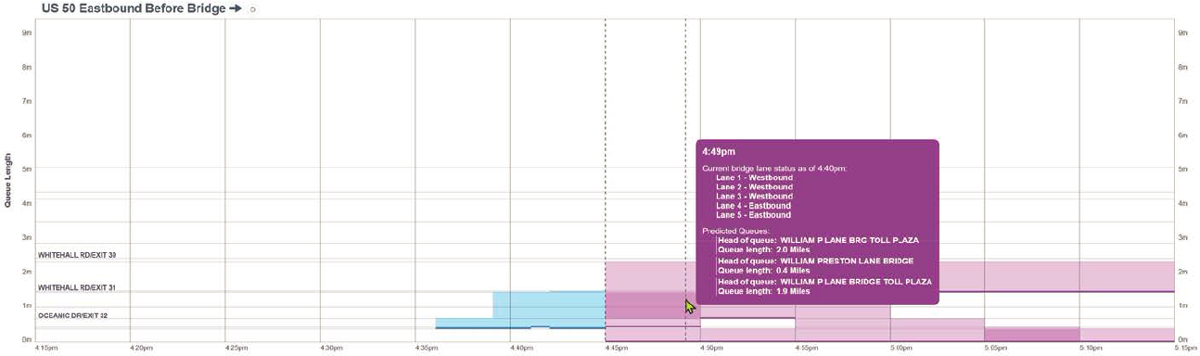
3.6 Queue Length Prediction
While understanding the real-time location of queues is a noble use case by itself, being able to predict queue lengths 10, 30, 60, or 90 minutes into the future has significant operational benefits and was ranked relatively high as a use case that would be beneficial to certain agencies. Knowing where the end of the queue is likely to be in the near future can help provide warnings to motorists to avoid rear-end collisions. Queue prediction can also be beneficial for queue mitigation strategies at places such as toll plazas, work zones, and border crossings. For example, the Maryland Transportation Authority (MDTA) operates the Bay Bridge, which is a tolled facility used to reach the Eastern Shore region of the state. If MDTA can predict that queues are likely to grow or reaching a critical point within a certain number of minutes, corrective action can sometimes be taken to reverse lanes, change toll collection policies, or end work zones early. Figures 7 and 8 show MDTA’s Bay Bridge Queue Detection and Prediction application indicating an active queue (blue) in the eastbound direction, as well as predicted queue changes in the near future (in purple) based on a mix of sensor and probe vehicle data.
Queue detection is achievable with probe data alone; however, queue prediction is much easier to realize if upstream volume data are made available. Having access to upstream volumes that feed to a specific location can help predict queues long into the future if said point sensors detecting the volume are far enough away and well-calibrated.

Source: University of Maryland CATT Laboratory
Source: University of Maryland CATT Laboratory


