Tracking Safety Leading Indicators to Improve DOT Employee Safety Performance (2025)
Chapter: 1 Introduction
CHAPTER 1
Introduction
Employees of state departments of transportation (DOTs) often face great demands in a highly dynamic and hazardous work environment. Those with field responsibilities must not only perform tasks in that environment, but also remain cognizant of the public traveling in close proximity. Working in close proximity to the traveling public results in employee injuries, equipment damage, and, occasionally, fatalities. These outcomes are often found in a variety of lagging indicators that have been measured, tracked, and reported for decades. More recently, however, organizations and industries have sought to measure safety leading indicators (i.e., metrics of safety activities before an incident occurs). This NCHRP synthesis documents practices used by state DOTs regarding the use of safety leading indicators to track and prevent occupational injuries and other incidents. This chapter provides an overview of the topic and synthesis to inform the reader of relevant issues regarding safety leading indicators while also highlighting the issues covered in this report.
1.1 Background
As previously noted, DOT field employees face unique, hazardous circumstances in their work environments. Because distracted driving is an increasing concern, hazards in their work environments are also compounded by a distracted public traveling in close proximity. The Occupational Safety and Health Administration (OSHA) has required that employers track and submit safety lagging indicators, primarily the total recordable incidence rate (TRIR). The TRIR is an industry-standard metric that reports the number of employees injured per 100 employees in a given year. Other lagging indicators include the total case incidence rate and days away, restricted, or transferred (DART) rate.
These lagging indicators are valuable for benchmarking an organization to an industry-wide number; however, they are not an ideal metric for proactively managing employee safety for a variety of reasons. These measures represent undesirable and often tragic past events (hence the term “lagging”). The lagging indicators represent injured people who, in the course of employment, require more advanced treatments than basic first aid.
Alternatively, safety leading indicators are attractive metrics used to avoid undesirable circumstances that could lead to an incident. Leading indicators provide data before an incident occurs (hence the term “leading”) and may offer predictive insights that guide employers to take action to avoid incidents.
Because DOT practices related to safety leading indicators have not been well documented, this NCHRP synthesis provides a better understanding of DOT practices nationwide related to safety leading indicators. This synthesis informs readers of the various issues, implementation efforts, and outcomes of safety leading indicators.
1.2 Synthesis Objective
This synthesis gathers state-of-the-practice information regarding the current processes and strategies for effective use of safety leading indicators to improve employee safety performance. The objective of this synthesis is to document practices used by state DOTs regarding the use of safety leading indicators to track and prevent occupational injuries and other incidents. To be specific, this synthesis collected the following information:
- DOT characteristics that may influence the development or use of indicators
- Employee characteristics and classifications (new and experienced employees or supervisory capacity)
- Leading indicators related to employee attitudes, behavior trends, team culture, and psychological safety
- Leading indicators related to training (mechanisms and methods, frequency and focus of training, and leadership participation in training)
- Frequency of safety leading indicator collection
- Flowthrough requirements of private contractors at worksites or in state-DOT-led activities
- Method of data collection, tracking, and storage
- Roles and responsibilities in the use of leading indicators
- Results and analyses
- Benefits and challenges
- Successful implementation strategies
- Written policies and procedures
1.3 Study Approach
An extensive literature review on the topic provides an initial understanding of the current research and state of the practice regarding safety leading indicators. The findings of the review are provided in Chapter 2. The existing literature and previous discussions with DOTs assisted with the development of the survey questionnaire.
A survey was created to capture the state of the practice of safety leading indicators within DOTs. Under the supervision of the topic panel, the survey was divided into the following categories: Demographic Information, Safety Leading Indicator Use, Implementation and Results, and Written Policies and Procedures. Acknowledging that not all DOTs would have experience with documenting safety leading indicators, question logic guided respondents accordingly. A definition of documentation of safety leading indicators was provided to clarify that only formally documented responses were sought, rather than informally communicated opinions or experiences. Those who do not document safety leading indicators were led to a series of questions worded so that documentation of safety leading indicators was not a prerequisite. This line of questioning was similar to some of the questions provided to those with experience with safety leading indicators.
After the final draft of the survey was approved, an email request with the survey link was distributed to the membership of the North American Association of Transportation Safety and Health Officials (NAATSHO). Because NAATSHO is not an official AASHTO committee, it does not have representation from all state DOTs. When there were gaps, the synthesis team utilized personal contacts, information from state DOT websites, and previous survey respondents to similar topics. The survey recipients were asked to distribute the survey to individuals with responsibility for occupational safety within their organizations. The complete survey is provided in Appendix A, and aggregate results are presented in Appendix B.
A total of 43 responses were collected from a distribution to 50 state DOTs, representing 43 different state DOTs yielding an 86% response rate. Figure 1.1 shows the map of states that
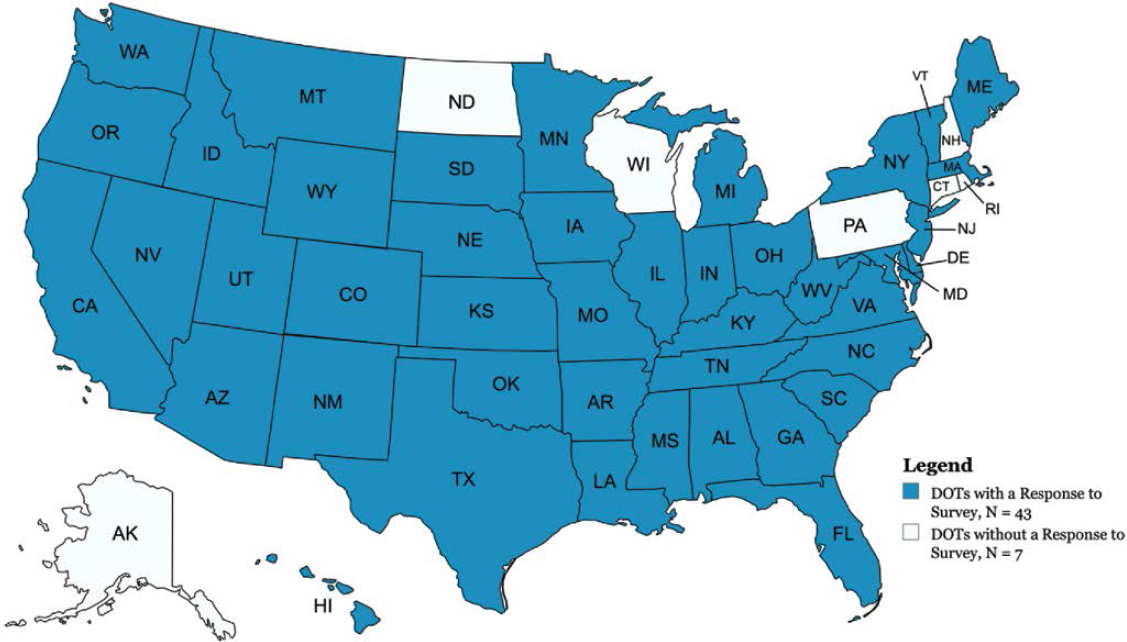
responded to the survey. Throughout this synthesis percentages have been rounded up or down both in the text and in figures and tables.
Following the analysis of survey responses, subsequent case examples were conducted to gather more information on the topic. Since use of leading indicators is inconsistent nationally, a strategy was needed to select the state DOTs for the case examples. Five states were chosen for the case examples to develop an in-depth understanding of the successes, challenges, and barriers to using safety leading indicators. The criteria used for considering case example invitations were as follows: written policies and procedures and documentation of safety leading indicators for at least 5 years using at least half of the safety leading indicators listed. The synthesis team also wanted one representative from each of the four AASHTO regions to diversify geographical representation. The state DOTs were contacted for assistance with the synthesis, and all agreed to participate in the interviews. Details of the individual case examples are outlined in Chapter 4, and the questions asked during the conversations are provided in Appendix C. Policy manual language related to safety leading indicators that were uploaded by survey respondents is provided in Appendix D.


