Tracking Safety Leading Indicators to Improve DOT Employee Safety Performance (2025)
Chapter: 2 Literature Review
CHAPTER 2
Literature Review
This review focuses on previously published academic literature on the use of safety leading indicators to manage employee safety. However, little documented knowledge exists regarding state DOTs’ management of highway construction and maintenance crews. Thus, much of the literature reported here focuses on the general construction industry, which has similar workplace hazards and a significant amount of available literature.
The review begins with traditional safety performance indicators, definitions of safety leading indicators, the development of safety leading indicators in the construction industry, categories of safety leading indicators, and finally, the effectiveness of safety leading indicators in measuring safety performance. A high-level overview of maintenance worker safety management in the United States highway industry can be found in the Background section of the Introduction (Section 1.1).
2.1 Traditional Safety Performance Indicators
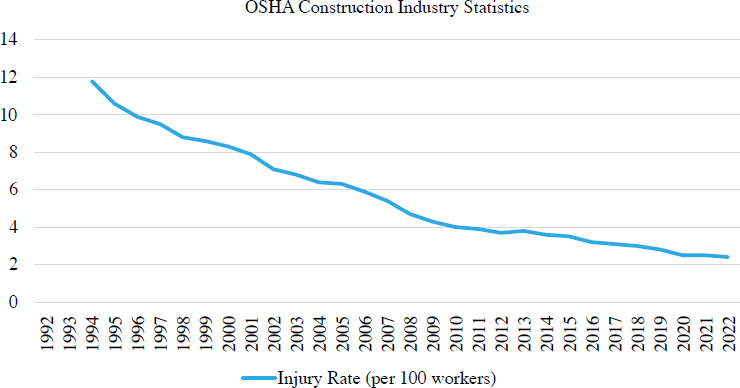
Traditionally, safety performance in many high-hazard industries has been measured by metrics such as the Occupational Safety and Health Administration (OSHA) total recordable injury rate (TRIR), a measure of how often an employee is harmed beyond the effectiveness of basic first aid. Such metrics have been used widely by OSHA, insurance companies, and contractors involved in the highway construction industry. Those measures are mainly examined over an extended period to identify trends and observe any improvement in safety performance. For example, the recent published OSHA recordable incident rate (Figure 2.1) shows that safety performance in the private construction industry has generally improved since 1992, but that the rate of improvement has slowed. The statistics provided in Figure 2.1 represent what is known and classified as a “lagging indicator.”
Toellner (2001) defines “lagging indicators” as measurements associated with the consequences of an accident. Lagging indicators provide data after the occurrence of an incident, but are not able to predict safety in the workplace. Several researchers argue that the limitations of lagging indicators as a measurement of safety performance arise from their deficiency in providing enough data about the origins of accidents (Hinze et al. 2013). Even though they can reflect the level of safety and illustrate a perception of safety objectives that must be established, they fail to provide guidelines for achieving those objectives and effectively avoiding future accidents (Grabowski et al. 2007; Sgourou et al. 2010). Moreover, focusing on an accident after it occurs always is always reactive and thus sends an unintended message that safety is less important (Mengolini and Debarberis 2008), and lagging safety measurements emphasize the negative aspects of safety by measuring the presence or absence of accidents instead of taking a positive approach to achieving safety (Guo and Yiu 2013).
Due to the limitations of lagging indicators, a new approach has emerged to measure safety performance. Several organizations have adopted an innovative and proactive approach to improving safety by developing and implementing health and safety management systems (SMSs) and programs. SMSs have been widely reported in the literature (Flin et al. 2000). Safety management systems are generally comprehensive systems of safety policies and objectives, standard targets, planning and organization of work, monitoring and feedback, corrective actions, review, and continual improvement (Choudhry et al. 2007).
In many SMSs, auditing is a tool for measuring safety performance (Guo and Yiu 2013). Audits typically determine whether the organization is compliant with standards, such as its developed policies and procedures, applicable legislation and regulations, and other external standards. The quantitative results of the conducted audits are used by organizations as safety performance measures (Robson et al. 2012). Robson et al. (2012) observed that variations and inconsistencies exist in practice between auditing records and ISO 19011 guidelines (ISO 2002); such discrepancies could have direct implications for the reliability and validity of audit results used in decision-making. Moreover, SMS indicators can measure individual safety behavior, are compatible with safety management processes, and permit the identification of the required remedial corrective actions to be considered (Guo et al. 2016). Even though SMS safety practices are directly connected to safety outcomes, this connection is vague and indirect (Gallagher et al. 2003). Safety policies and processes are highly emphasized in SMSs; however, human elements and cultural factors are underappreciated (Choudhry et al. 2007; Wachter and Yorio 2014). The structural framework of an SMS is robust and based on the following beliefs (Howell et al. 2002):
- Developed rules and procedures, if followed, will keep workers safe.
- Workers’ failure to follow developed rules will result in incidents.
- Motivating workers and providing them with required training will result in reducing incidents.
SMSs used in the construction industry are nevertheless incomplete (Costella et al. 2009), and the above-mentioned beliefs motivating an SMS may result in two essential problems: incomplete risk profile and oversimplification of safety phenomena. With such existing problems, safety indicators are unable to provide an accurate level of safety, which may result in ineffective decisions and actions (Guo and Yiu 2013). Also, a change in safety program will be realized and identified only after at least one or more injuries occur; therefore, an alternative approach to measuring safety must be considered (Hinze et al. 2013).
For systems available for measurement or currently in place, effective and appropriate measures of safety performance are needed. As noted, lagging indicators are prevalent but insufficient; thus, the opportunity to explore safety leading indicators emerges.
2.2 Definition of Leading Indicators
Toellner (2001) defines “safety leading indicators” as “metrics associated with measurable system or individual behaviors linked to accident prevention.” Grabowski et al. (2007) describe leading indicators as the precursor of accidents, or in other terms, the conditions, events, or measures that precede an incident and have value in predicting the appearance of an accident, incident, or any unsafe condition. Safety leading indicators are associated with proactive activities able to predict hazards and eliminate or at least minimize and control risk. Hinze et al. (2013) characterize leading indicators of safety performance that describe the level of effectiveness of the safety process and consist of selected measures. The safety culture of a project or a company can be partly perceived by their measures of leading indicators. When one of those measures reveals a weakness, it signals that implementation of interventions is required to improve safety and, therefore, to eliminate the possibility of any negative occurrence. Sinelnikov et al. (2015) argue that defining leading indicators can be achieved by describing their relationship with lagging indicators.
Sinelnikov et al. (2015) conducted a research study to investigate the following objectives:
- Describe the extent to which occupational health and safety (OHS) practitioners understand leading indicators and their practical applications.
- Explore organizational practices about tracking, analyzing, and applying the information provided by leading indicators to improve OHS performance.
- Identify barriers and factors that enable the use of leading indicators.
The researchers found that, to announce the leading indicator’s importance, OHS practitioners must possess both technical knowledge and communication skills. OHS practitioners often use leading indicators to make decisions about OHS matters and to support communication and employee morale. Leading metrics can predict and prevent accidents and injuries by providing a set of objectives that supports improvement by transforming organizational safety culture from being passive and after-the-fact to being proactive and solution-driven. The researchers argue that leading indicators are process-specific and linked to certain functions or activities at individual sites. Due to this specificity, the leading indicator data could become less informative as one moves from the site level to the analysis level. Also, different sites might differ in size, location, operation, structure, culture, and OHS procedure, which makes it difficult to normalize data and compare different sites. Depending on how well OHS practitioners track, manage, and use the information provided by leading metrics, their organizations succeed in reducing environmental, safety, and health concerns (Sinelnikov et al. 2015).
2.3 Development of Leading Safety Indicators in the Construction Industry
The approach to developing safety leading indicators has been widely discussed in the literature. A considerable amount of theoretical and conceptual research exists about developing safety indicators. Leading indicators or positive performance indicators (PPIs) of the construction industry, as designated by the National Occupational Health and Safety Commission (NOHSC), include the following (Mitchell 1999):
- Commitment by management to safety
- An effective OHS management system
- Risk management and control of hazards
- Auditing of both management systems and physical hazards
- Training and education
- Communication and consultation
PPIs often used to measure safety performance across the industry include the number of OHS meetings completed, the number of OHS training exercises held, and the number of hazard inspections, toolbox talks, OHS inductions, and OHS audits conducted. Even though NOHSC encourages using PPIs, their adoption has been limited in the Australian construction industry (Dingsdag et al. 2008). Dingsdag et al. (2008) claim that PPIs have several limitations when measuring safety performance, because they cannot reflect the success of preventing injury and disease directly, cannot be easily measured, and could be time-consuming to collect and allocate. PPIs are subject to random variation, and the outcomes depend on how they are measured; furthermore, they measure only the outcomes and do not provide any indication or measure of the effectiveness of each measured event. Also, Dingsdag et al. argue that their relationship with lagging indicators is arbitrary. PPIs provide information only on the frequency of safety activities without any guidelines for their development, application, and validation.
Øien et al. (2011a) conducted a thorough review of previous theoretical work on the development of leading indicators or resilience-based early warning indicators (REWI). They describe the development of REWI through qualitative analysis in major hazardous industries, such as nuclear power, chemical processing, and aviation (Øien et al. 2011b).
Another term for leading indicators, used by Site Safe New Zealand (2012) for the Construction Safety Charter Accreditation program, is “key performance indicators” (KPIs). The goals of the program are to recognize companies performing at a high level, provide high performers with a competitive advantage, and help accredited companies secure more jobs. The Charter Accreditation Key Performance established by industry stakeholders is comprised of three tiers of best practices:
- Tier 1: Safety System
- Tier 2: Safety Behavior
- Tier 3: Safety Leadership
Tier 1 of the KPIs includes evidence of site safety planning, communication, training, and monitoring systems (e.g., communication of safety requirements in tender documents, complete site-specific safety plan, and conduct toolbox talks). Tier 2 emphasizes safe worker behaviors, which will ultimately eliminate fatalities and reduce injuries. Evidence of safe worker behaviors on site includes facilities, good housekeeping, and fall prevention. Moreover, evidence of safety leadership accountability includes ability to define organizational KPIs and measurable safety responsibilities, communicate responsibilities throughout the organization, monitor management participation in safety activities, and provide performance feedback on and recognition of safety performance. Notably, Guo and Yiu (2013) argue that the problem with KPIs is that they were developed for the Site Safe Charter Accreditation program (https://www.sitesafe.org.nz/) and not for safety performance measurement.
Reiman and Pietikäinen (2012) describe the role that safety performance indicators play in improving the organization’s safety performance and define the different purposes and types of safety performance indicators. They discuss three types of safety performance indicators: outcome, monitor, and drive. They define “drive” and “monitor” as leading indicators. Drive indicators are considered a priority for an organizational safety activity when they control measures that manage that socio-technical system, while monitor indicators provide perception of the activities, abilities, skills, and motivations of employees and the practices of the organization regarding safety. Moreover, they control the efficiency of used measures to manage the socio-technical system.
Hinze et al. (2013) classify two types of leading indicators: active and passive. They define “passive leading indicators” as “those that indicate a safety performance to be realized within a firm or a project” and that can predict safety performance for the short term. Examples include the number of management personnel and field employees with 10-hour (or 30-hour) OSHA certification cards, the number of selected subcontractors based on specific safety criteria, a requirement that each contractor submit an approved site-specific safety program, and a requirement that the CEO of each subcontractor indicate commitment to the safety of construction workers. Even though passive indicators represent a good start to the project, they do not provide any additional information about the day-to-day activities that could alter jobsite safety. “Active leading indicators” are defined as “those that are more subject to change in a short period.” Examples include percentage of jobsite toolbox meetings attended by jobsite supervisors, percentage of jobsite pre-task planning (PPT) meetings attended by jobsite supervisors/managers, percentage of negative test results of random drug tests, and several close calls reported per 200,000 hours of worker exposure.
2.4 Leading Indicators Safety Categorization
In the literature, more than 300 leading indicators in construction were identified (Akroush and El-Adaway 2018), and as previously mentioned, they can be classified into different categories. In particular, this synthesis presents some of the major studies that identify the major leading indicators used to measure safety performance. The Construction Industry Institute funded an extensive study to identify best practices of the construction industry that would cause a difference in safety performance and drive the industry toward achieving a goal of zero injuries (Hinze 2002). The results emphasize the importance of some traditional safety techniques and practices conducted by the construction industry and highlight the importance and effectiveness of newly adopted techniques.
The essential components of an effective construction safety program are listed as follows (Hinze 2002):
- Demonstrated commitment by management
- Employee involvement
- Staffing for safety
- Safety recognition and rewards
- Pre-project and PPT
- Accident/incident investigations
- Safety education and training
- Subcontractor management
One of the largest studies regarding number of safety leading indicators and associated metrics for their evaluation was performed by Maloney et al. (2017). In defining operational excellence for safety, the authors created a multilevel organizational assessment tool that outlines over 300 metrics across 12 distinct safety drivers for safety leading indicators (Maloney et al. 2017).
Moreover, in 2015, OSHA updated its voluntary Safety and Health Program Management Guidelines, first published in 1989. The published guidelines provide employers, workers, and worker representatives with a robust and flexible framework for addressing safety and health issues in workplaces. Proactive approaches to managing workplace safety and health are emphasized.
The fundamental elements of the OSHA safety and health program management guidelines are as follows:
- Management leadership
- Worker participation
- Hazard identification and assessment
- Hazard prevention and control
- Education and training
- Program evaluation and improvement
- Coordination and communication on multiemployer worksites
Shea et al. (2016) conducted extended research to include measures linked with organizational safety practices that could be identified as leading indicators of OHS. The identified indicators are listed as follows:
- Accountability for OHS
- Consultation and communication about OHS
- Empowerment and employee involvement in decision-making about OHS
- Management commitment and leadership
- Positive feedback for and recognition of OHS
- Prioritization of OHS
- Risk management
- Systems for OHS (policies, procedures, and practices)
- Training, interventions, information, tools, and resources for OHS
- Workplace OHS inspections and audits
Awolusi et al. (2016) confirmed that the leading indicators most commonly used in the construction industry are as follows:
- Project management team
- Safety process involvement
- Worker observation process
- Jobsite audits
- Near-miss reporting
- Housekeeping program
- Stop-work authority
- Safety orientation
- Safety training
From the previously mentioned research studies, five major leading indicators constructs emerged: management leadership and commitment, employee empowerment and worker participation, training and education, hazard identification and control, and evaluation and improvement. These leading indicators constructs are common among all the above-mentioned studies and are considered the major safety performance measures. More than one construct would fall within the same leading indicator. Each construct is briefly explained and defined and presented in Table 2.1.
2.4.1 Management Leadership and Commitment
All researchers generally agree on the importance of management leadership and commitment, since they provide a lead by example, resources, and vision required for implementing an effective safety and health program (OSHA 2015). Management leadership plays a major role in the safety culture of the organization (Hinze 2002). Active engagement is demonstrated by the management’s commitment, and their behaviors represent a role model that helps build trust with employees and emphasizes the priority of OHS in the organization (Shea et al. 2016).
2.4.2 Employee Empowerment and Worker Participation
Worker participation, or employee engagement, is also crucial, as encouraging workers to engage in the program indicates that management values its employees’ input regarding safety and improves the ability to identify hazards in the workplace successfully (OSHA 2015). Utilizing
Table 2.1. Leading indicator safety constructs of occupational health and safety.
| Leading Indicator | Safety Construct Selected by Authors |
|---|---|
| Management leadership and commitment |
|
| Employee empowerment and worker participation |
|
| Training and education |
|
| Hazard identification and control |
|
| Evaluation and improvement |
|
safety observers to assist in managing behavior-based safety programs reinforces better safety practices and corrects unsafe behaviors (Hinze 2002). Shea et al. (2016) argue that “employee involvement in decision making will lead to ownership of their behavior and positive outcomes, such as safety behavior.”
2.4.3 Training and Education
Workers’ knowledge about workplace hazards and measures to control them allows workers to accomplish their jobs safely and enhances their productivity (OSHA 2015). Training workers to perform tasks safely is vital and is the most effective way to influence their safety performance while conducting their tasks (Hinze 2002). According to Shea et al. (2016), “OHS training, information, tools, and resources are key leading indicators of OHS performance.”
2.4.4 Hazard Identification and Control
Identifying and assessing hazards is a proactive process and a core element of any effective OHS program, while failing to identify them is the root cause of workplace accidents, injuries, and fatalities. Moreover, hazard assessment and control can increase the chances of improving
safety performance (OSHA 2015). As management scholar Peter Drucker notes, “what gets measured, gets managed” (Klaus 2015). Shea et al. (2016) argue that conducting an audit or an inspection alone may not contribute as a leading indicator; however, inspections and audits could be directed to provide relevant and required information associated with appropriate and corrective actions to be considered in the future.
2.4.5 Evaluation and Improvement
Program evaluation is best conducted initially to investigate whether the program was established and implemented as intended and also conducted periodically to ensure that the program is on the right track. Periodic evaluations would highlight opportunities for improving, adjusting, monitoring, and evaluating results (OSHA 2015). Moreover, positive feedback and recognition would help to achieve a successful performance OHS (Shea et al. 2016).
2.5 Effectiveness of Leading Indicators
Since traditional methods reveal their limitations when measuring safety performance and predicting safety in an organization, several construction firms instead applied a new way of measuring their safety performance using leading indicators (Hinze et al. 2013). Hinze et al. (2013) investigated the effect of using leading indicators by two construction firms that employed leading indicators in 14 projects with more than 10 million working hours. The theoretical range of the leading indicators varied between 2 and 6, and the researchers compared the leading indicator score with the recordable injury rate of each project. They found that five projects had a score of 3, five projects had a score of 4, and four projects had a score of 5 to 6. Those with a leading indicator score of 3 had a recordable injury rate (RIR) greater than 1, and those with a score of 4 or 5 had an RIR equal to 0. These results indicate that leading indicators can provide a rough estimation of safety performance across an organization (Hinze et al. 2013).
Rajendran (2013) selected three leading indicators—PPT, worker safe behavior observation (WSBO), and site safety audits—in an actual project to construct a manufacturing facility (as opposed to measurements based on anecdotal evidence or a theoretical project). The researcher evaluated their effectiveness by comparing them to four lagging indicators: near-miss incident rates, first-aid injury rates, OSHA recordable injury rates (TRIRs), and total incident/injury rates. They found that the PPT has a significant impact on workers’ safety behavior. The author suggests that at least 20 PPT reviews must be conducted each week and that, when crews did not develop or implement a good PPT, more injuries or incidents were found in the project. Conversely, during weeks accompanied by good PPT reviews, zero incidents were witnessed. Also, the results showed that a good WSBO represents a safe jobsite, while a negative WSBO represents an unsafe jobsite where instant interventions should be implemented. The researcher suggests that, for a WSBO to be effective, at least 30 observations should be conducted each week on a construction site. In general, the researcher concludes that PPT and WSBO can be used as leading indicators of a safety program, with WSBO being more effective in measuring safety performance.
Guo et al. (2017) developed a set of leading indicators that can be implemented by construction companies to evaluate safety levels and measure safety performance at the project level. A multiple case study was conducted by validating leading indicators scores with documented safety outcomes in three commercial construction projects of different sizes. The results revealed that, on one of the project sites where they did not employ a safety manager, a low safety level was associated with a low score on management commitment. On the same project, workers not provided with required safety training were associated with a low safety knowledge score; furthermore, because of limited safety practices, a low score on safety climate was observed. The total recordable injury frequency
rate (TRIFR) of this project in May of 2015 was 18 per million working hours. This frequency was attributed to the low level of management commitment to safety, suggesting that productivity was prioritized over safety practices. However, on the same project, when management showed more commitment to safety by employing a full-time health and safety manager, improvement in different safety dimensions was the result. TRIFR of June decreased to 15 per million hours worked and then decreased to 10 per million hours worked in July.
Conversely, in two other projects in which the levels of the management’s commitment to safety were better and a well-established SMS implemented different safety practices, the result was better safety levels. In general, if the safety environment led by management is relatively poor, risk behavior will be accepted, thereby increasing the rate of accidents and injuries on the project. Guo et al. (2017) note that leading indicators investigated in this research confirmed their ability to predict the change in the TRIFR and can be used to measure safety performance at the project level in the construction industry. Moreover, implementing the approach of leading indicators would change the safety standard from being reactive to being proactive.
Several researchers consider leading indicators as a reliable measure for safety performance, safety climate, safety risk levels, and operational excellence. For construction projects based on identified leading indicators, Maloney et al. (2016) developed an operational excellence model defined as “doing the right thing, the right way, every time—even when no one is watching.” Givehchi et al. (2017) studied the relationship between OHS leading indicators and a safe climate. Their research emphasizes two leading indicators: safety inspections and noncompliance. They found that safety climate levels are affected by the frequency of conducted safety inspections and the resulting noncompliance. They conclude that scheduling safety inspections influences workers’ safety commitment and that the number of recorded noncompliant inspections represents workers’ perception of management’s prioritization and communication of safety in the organization. Therefore, safety inspections and noncompliance can be considered as leading indicators in monitoring the safety climate in an organization.
Poh et al. (2018) argue that injury severity is not random; on the contrary, it can be predicted and is highly influenced by incident type. Moreover, relying only on safety-related data cannot produce an effective prediction of the frequency and severity of construction site accidents and injuries. In their research, they implemented machine learning (ML) algorithms that would consider the project characteristics and variables in predicting safety outputs. They concluded that project management factors influence accident occurrence and severity. The ML algorithm, used as a leading indicator, can predict the class of the severity of the accident as No Accident, Minor Accident, and Major Accident, thereby providing a perception of safety for a construction site in the future.
The synthesis will now advance to a national survey of state DOTs on their use of safety leading indicators. This literature review informed some of the questionnaire structure and responses that are documented in Chapter 3 and in Appendix A. Chapter 4 documents more detailed case example interviews on the subject.


