Tracking Safety Leading Indicators to Improve DOT Employee Safety Performance (2025)
Chapter: 4 Case Examples
CHAPTER 4
Case Examples
As noted in Chapter 1, follow-up case examples were conducted to gather more details regarding processes and strategies for effective use of safety leading indicators. The case examples were executed by web interviews between the synthesis team and selected state DOTs. The survey respondents of state DOTs were contacted to participate in the case example based on their responses, and they were encouraged to involve other state DOT staff as needed during the interview. The semi-structured interviews followed the questions outlined in Appendix C but often drifted toward unique experiences with each state. The survey responses used to select the case example state DOTs included the following:
- Does the state DOT document safety leading indicators? ∼ Response: Yes
- How long has the state DOT documented safety leading indicators? ∼ Response: Greater than 5 years
Other factors considered for selection of state DOTs for case examples included the geographic location of the state DOT, as it is desirable to have all four AASHTO regions represented. The state DOTs selected for case examples were Colorado, Delaware, Illinois, and Virginia. Washington State indicated in their survey that their state DOT had documented safety leading indicators for less than 4 years. However, they uploaded a robust safety leading indicator manual, resulting in their selection as an additional case example. The case examples for these state DOTs are presented below, and a summary of substantive findings is presented in Table 4.1.
4.1 Colorado Department of Transportation
4.1.1 Overview of Safety Program
The Colorado Department of Transportation (CDOT) is comprised of five regions, each with a regional safety officer and a statewide safety director. To enhance the safety culture and reduce incidents, CDOT has begun exploring the use of safety leading indicators. This initiative is part of a broader effort to transition from relying solely on lagging indicators, such as incident and accident reports, to more proactive measures that can predict and prevent safety issues before they occur. This case example provides an in-depth look at CDOT’s approach, the strategies they have implemented, and the challenges they faced.
4.1.2 Use of Safety Leading Indicators
CDOT’s journey with safety leading indicators began with the recognition that traditional safety metrics, while useful for historical analysis, do not provide real-time insights needed to prevent accidents. The CDOT safety team has been at the forefront of this initiative. They have
Table 4.1. Substantive case example findings from state DOTs.
| Substantive Findings from the Case Examples | State DOTs Mentioning the Finding |
|---|---|
| Data is used to provide directed training. | CO, DE, IL, VA, WA |
| Safety leading indicator programs require significant resources for implementation; But have demonstrable results for safety program improvements. | CO, DE, IL CO, DE, IL, VA, WA |
| Employee buy-in, trust, and a positive safety culture are significant for the effectiveness of safety leading indicators. | CO, DE, IL, VA, WA |
| Leadership support is critical to safety program success. | CO, DE, IL, VA, WA |
started implementing various programs aimed at engaging employees in safety practices and collecting real-time data on safety behaviors.
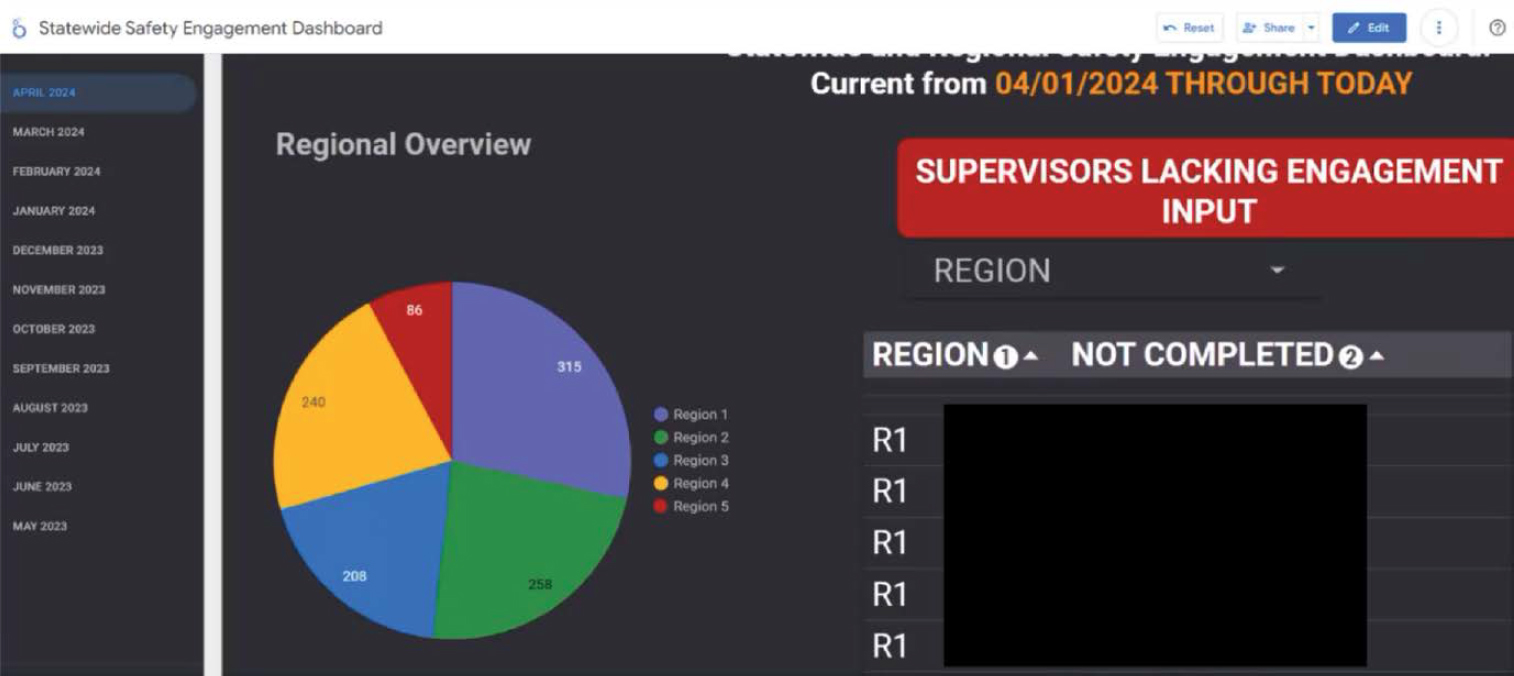
One of the primary tools used by CDOT is the Safety Engagement Program. This program involves maintenance supervisors (from lead workers up to area supervisors) who are tasked with conducting one-on-one safety engagements with their employees. The engagements may involve videos, job hazard analysis, or other content and may involve engagements that occur within larger groups, with a focus on safety discussions. During these interactions, supervisors discuss specific safety topics relevant to the tasks at hand and provide immediate feedback and guidelines. These engagements are recorded and tracked, providing a wealth of data on safety practices and behaviors. The tracking can be visualized in CDOT’s Statewide Safety Engagement Dashboard provided in Figure 4.1.
CDOT shared an example of how this program works in practice. Supervisors might conduct a job hazard analysis meeting, commonly known as a “tailgate talk,” in which they discuss recent incidents from other regions and relate them to the current work performed. This meeting not only reinforces the importance of safety but also makes the information relevant and actionable for employees. The discussions cover a range of topics, including proper lifting techniques, pretrip and post-trip inspections, and specific hazards related to tasks such as pothole patching or snowplow operation.
The recorded safety engagements are not only for accountability; they also serve as a vital data source for identifying trends and areas for improvement. By analyzing the data, CDOT has observed a correlation between the frequency of safety engagements and a reduction in incidents. For instance, in the months following increased safety engagements, there was a noticeable downturn in incidents attributable to CDOT personnel. Most recorded incidents involved external factors, such third-party motorists, indicating a positive impact of the safety engagements.
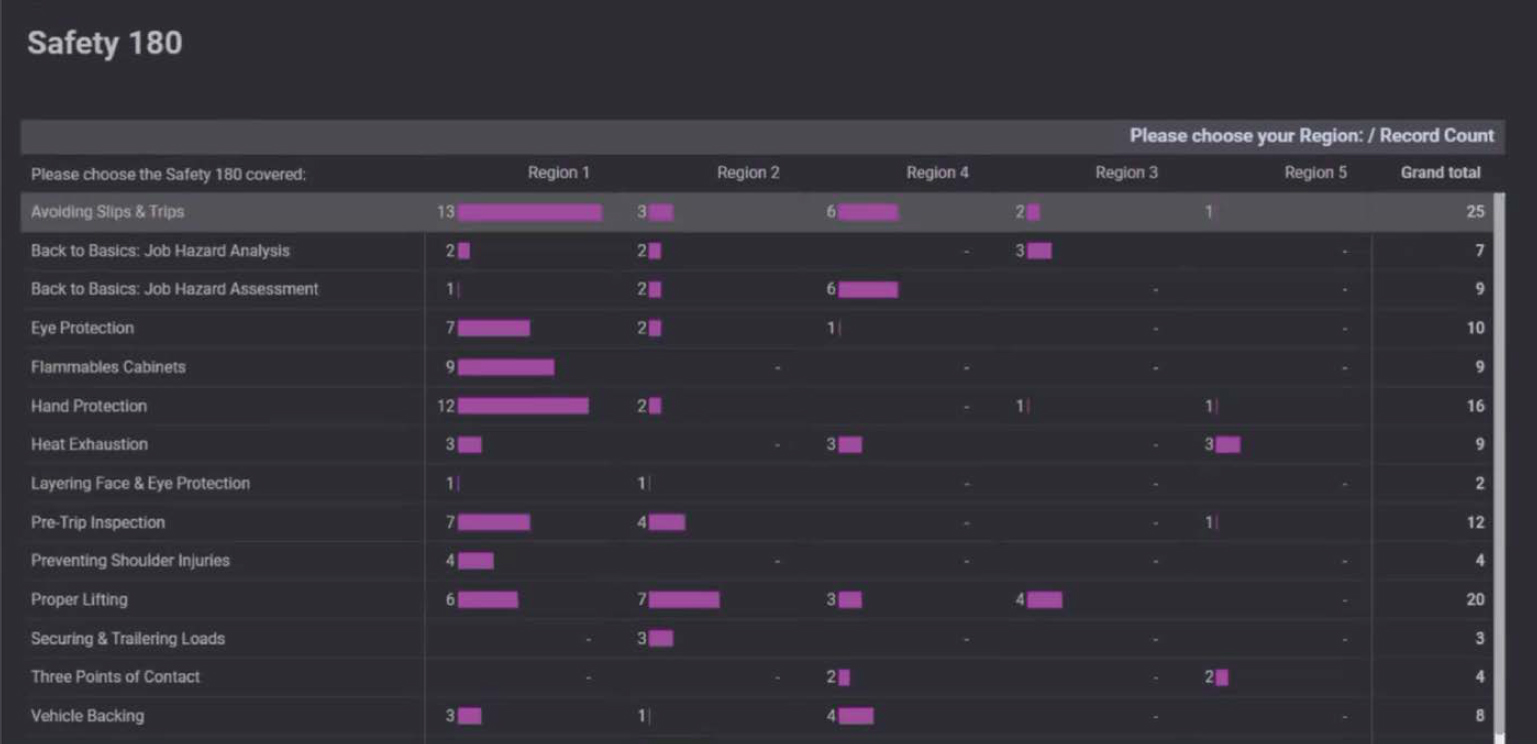
Another program CDOT emphasizes is “Safety 180,” which features videos 180 seconds in length and emphasizes topics such as maintaining three points of contact when climbing. The use of the entire library of “Safety 180” videos is tracked (see Figure 4.2.).
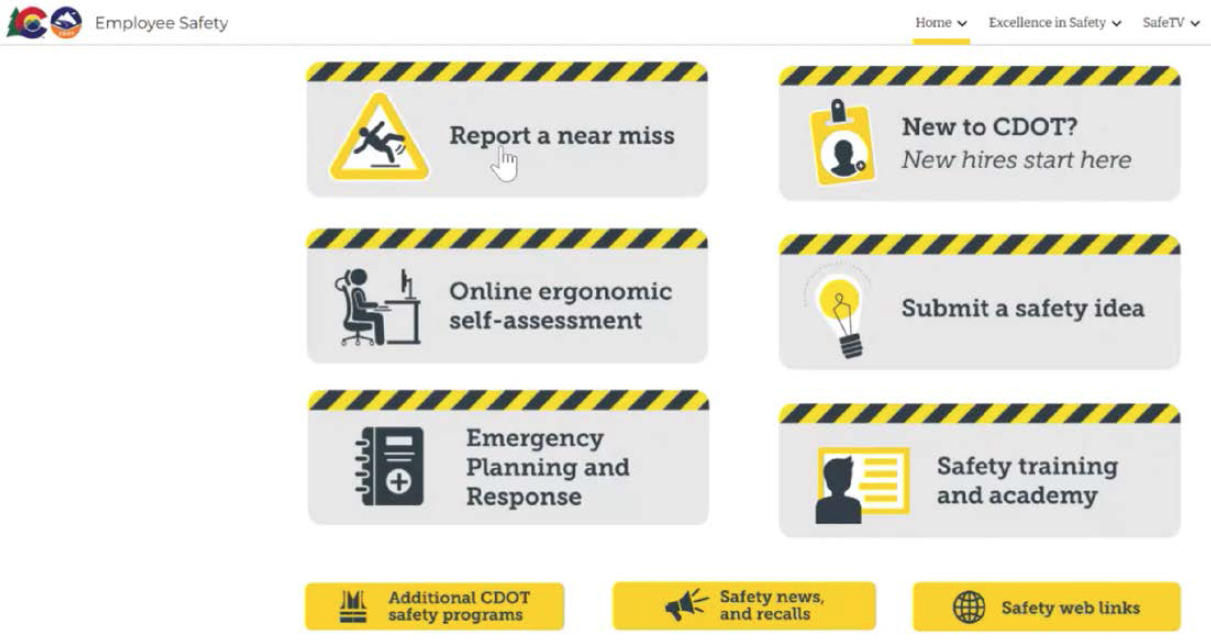
CDOT has also implemented a near-miss reporting system as part of its safety strategy. Employees can report near-misses through an online form, which is then reviewed by the safety team. This system allows CDOT to capture data on potential hazards that did not result in an accident but could have under different circumstances. Anonymity in reporting is encouraged to ensure honest and detailed accounts, thereby fostering a culture of openness and continuous improvement and submission of ideas for improvements. One challenge has been informing staff about these resources and requesting that employees use them and input information to build the program. The resources are available through CDOT’s Employee Safety website (see Figure 4.3).
CDOT also has an Employee Safety Recognition Program in which staff can be awarded as Safety Champions. This program is being extended from maintenance staff to all employees in 2024. Champions must maintain a clean safety record, be acknowledged for good practices, and be nominated. Engineering and administrative staff have separate criteria that are newly developed, including training participation, seat belt usage and safe driving, and proper badge usage, among other criteria. The awards originally included a vest identifying a “Safety Champion,” but because it fostered negative behaviors and unnecessary competition, CDOT instead offered more prize-type awards.
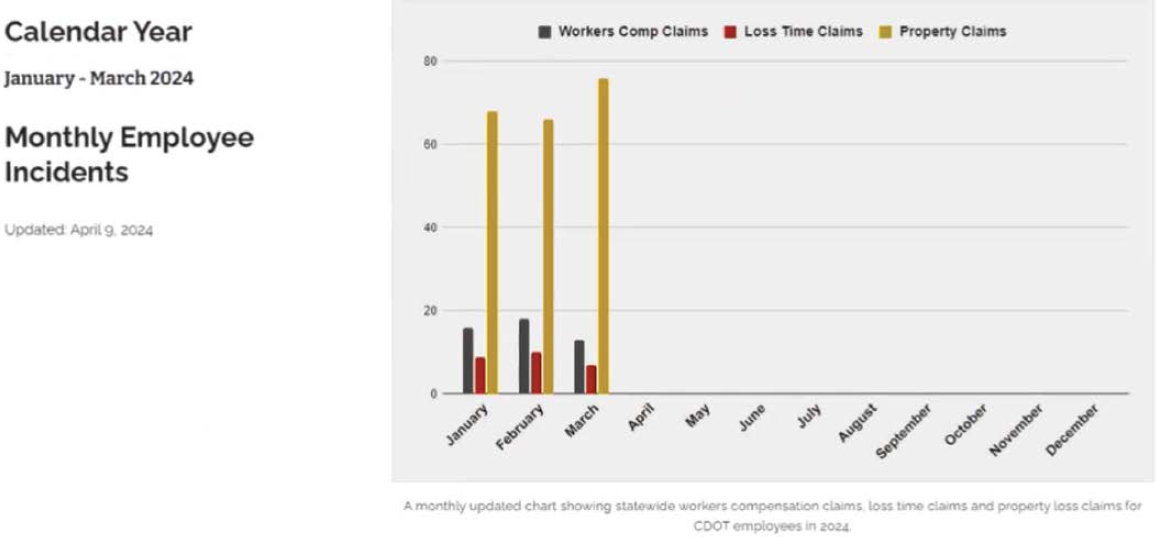
All the practices previously mentioned regard CDOT’s more proactive approach to safety and communication to employees that their safety is important. CDOT is also trying to build consistency across the regions through efforts such as Snowplow Operator Training spot checks. CDOT attempts to over-inform employees with safety information so that safety is part of everyday conversations, which has had a proactive and positive effect. CDOT also has a robust system of tracking and monitoring lagging indicators. Reporting of some of this tracking can be found in a review of their incidents (see Figure 4.4).
4.1.3 Employee Involvement and Training
Training has been a critical component of CDOT’s approach. However, they acknowledge that much work must be accomplished in this area. While initial efforts have focused on highway maintenance crews, training needs to expand across all departments within CDOT. The goal is to ensure that all employees understand the importance of safety leading indicators—as opposed to lagging indicators—and know how to use them effectively. CDOT also acknowledges the need to provide training on the use, tracking, and implementation of leading indicators.
Involving employees in the process has been crucial for gaining buy-in and ensuring the success of these initiatives. Employees must understand “what is in it for them.” CDOT has found that when employees are included in decision-making, such as selecting safety gear or suggesting improvements, they are more likely to engage with and support safety programs. This participatory approach helps create a sense of ownership and commitment to safety goals. Furthermore, it has been supported by CDOT leadership, who support the transition to leading indicators, while also needing more education themselves about the use and impact of this type of data.
4.1.4 Challenges and Future Directions
Despite progress, CDOT faces several challenges. One of the main hurdles is achieving uniformity in training and implementation across all regions and departments. CDOT highlighted the need for a cohesive strategy that aligns the entire organization with common safety objectives. Additionally, they desire to learn from other state DOTs that may have more advanced or successful safety programs. CDOT also acknowledges that employees may sometimes present challenges by being resistant to changes or safety practices. CDOT focuses on keeping the program positive rather than punitive; however, some instances require reprimands for the sake of safety.
Looking ahead, CDOT acknowledges that their use of safety leading indicators is recent but plans to continue refining its use of safety leading indicators and expanding its training programs. They are also interested in exploring new technologies and methodologies that could enhance their ability to predict and prevent safety incidents. Collaboration with other state DOTs and safety organizations will be key to overcoming challenges and achieving their safety goals. They note that their regular communication with the North American Association of Transportation Safety and Health Officials (NAATSHO) members has been beneficial for exploring new programs and sharing information.
The implementation of safety leading indicators at CDOT represents a significant shift toward a more proactive and engaged approach to workplace safety. Through programs such as the Safety Engagement Program and near-miss reporting, CDOT is making strides in reducing
incidents and fostering a culture of safety. While there are challenges to overcome, the commitment to continuous improvement and employee involvement is paving the way for a safer working environment for all CDOT employees.
The CDOT case example demonstrates the potential impact of safety leading indicators and the importance of organizational commitment and employee engagement in achieving safety excellence. CDOT feels their efforts are resulting in continuous improvement of their safety culture.
4.2 Delaware Department of Transportation
4.2.1 Overview of Safety Program
The Delaware Department of Transportation (DelDOT) has been actively working to enhance its safety culture and reduce incidents by implementing safety leading indicators. This case example details the efforts undertaken by DelDOT and highlights DelDOT’s strategies, challenges, and progress in fostering a proactive safety environment.
Within Maintenance and Operations, a program manager oversees several programs, including Occupational Safety. This role involves managing two risk management officers who ensure compliance with safety protocols, provide any missing or replacement personal protective equipment (PPE), and deliver training to new employees. Notably, PPE is readily available to DelDOT staff in the field offices, and operators are expected to obtain the proper PPE before starting work. DelDOT is transitioning toward a more comprehensive workforce development program that includes a Safety Baseline Week for new hires, focusing on safety knowledge of PPE, traffic control training, and Occupational Safety and Health Administration (OSHA) awareness.
4.2.2 Use of Safety Leading Indicators
DelDOT notes that their focus is primarily on the use of lagging indicators but that they are exploring some leading indicators. DelDOT’s primary use of leading indicators is for tracking training hours. They report that, last year alone, they conducted 15 different safety trainings totaling 306 hours. They also noted previously having a near-miss reporting tool (or hazard reporting tool), but it was not used and is no longer supported. Nonetheless, near-miss discussions do rise to the attention of the safety program officer, and focused training can be used to combat common safety concerns.
Other strategies used by DelDOT include safety reward meals for injury-free quarters and required weekly toolbox talks. These programs, among others, will expand as the occupational safety and health team adds two employees to increase bandwidth and grow the leading indicator approach. Much of the effort of the new employees will initially be to develop the two-week Equipment Operator Safety program.
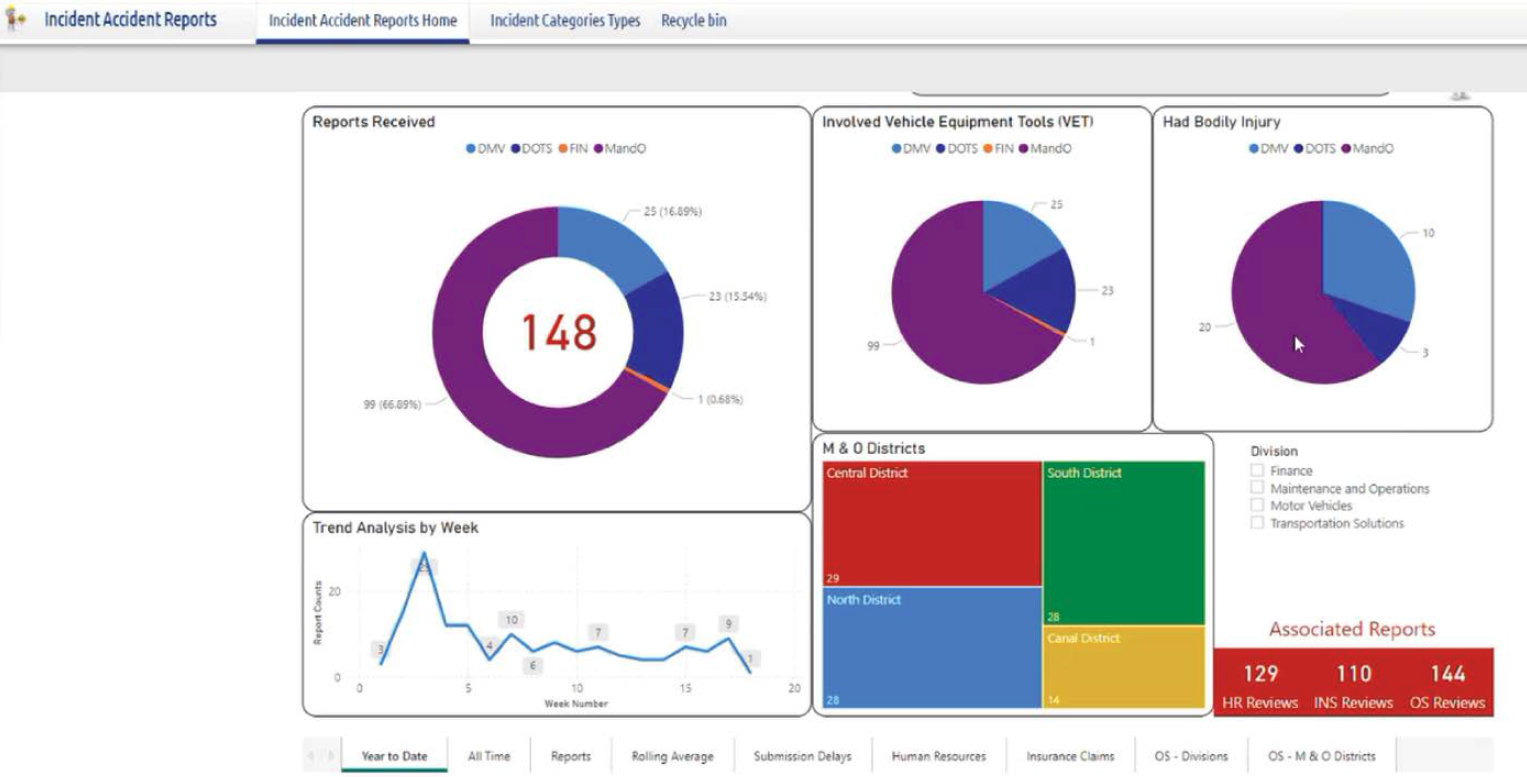
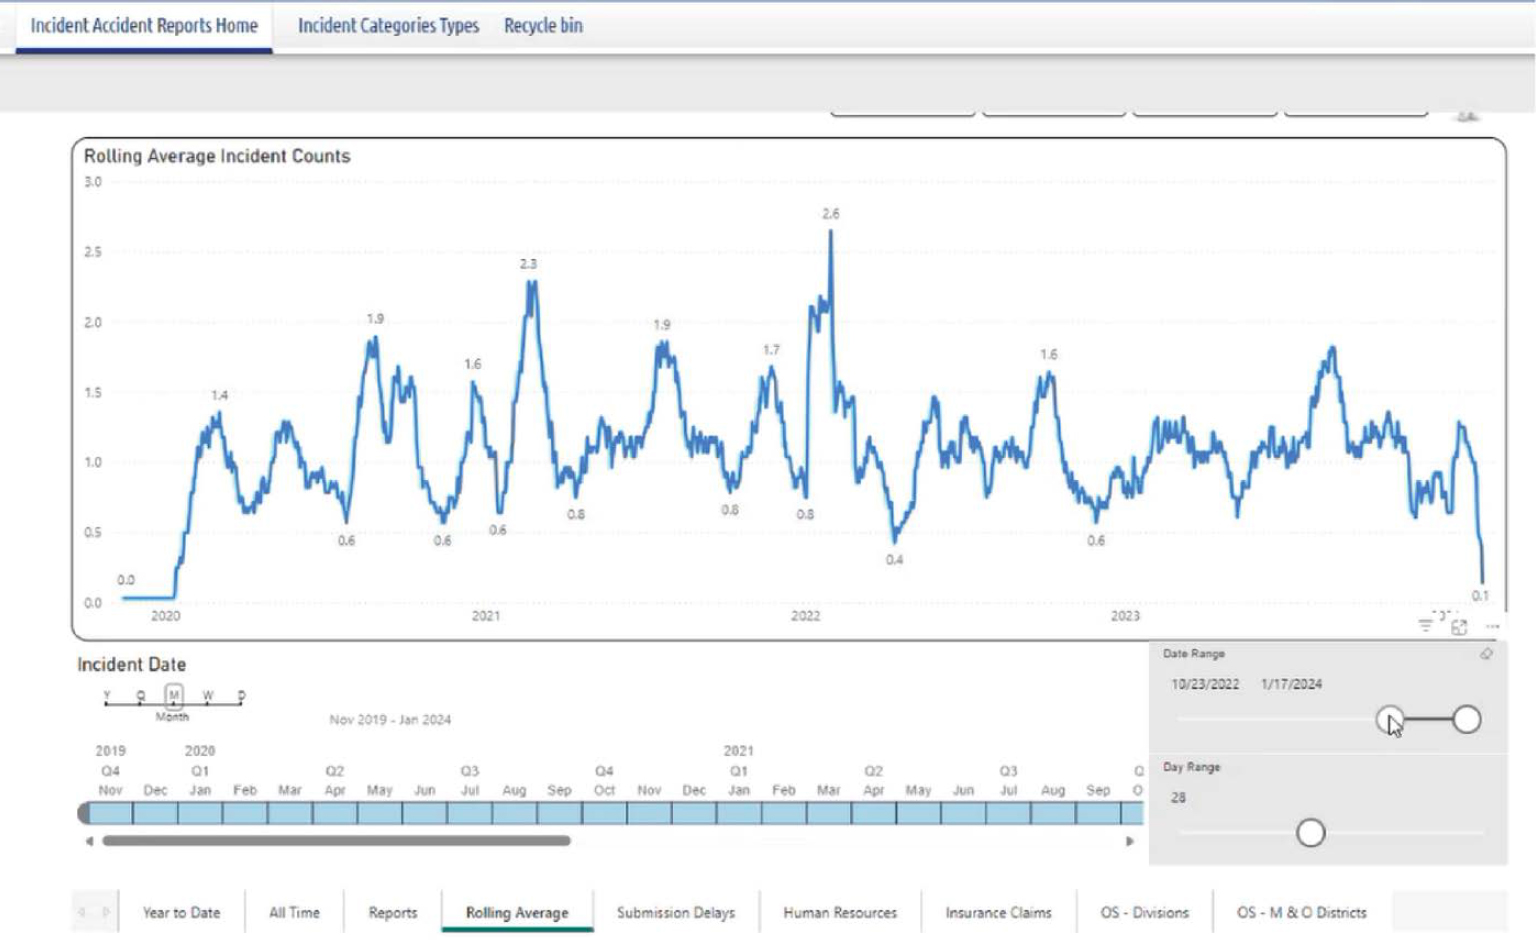
In this interview, the importance of safety leading indicators was emphasized in improving DelDOT’s safety culture. The agency has implemented several initiatives aimed at enhancing safety awareness and compliance among its staff. They also have had success with the safety data they collect in lagging indicators by using it proactively. DelDOT is leveraging tools such as Microsoft Power BI to analyze safety data and identify trends. This data-driven approach enables the agency to pinpoint areas of concern and tailor training and interventions, accordingly, transforming reactive insights into proactive safety measures. Their dashboards present information on incident reports, vehicle involvement, bodily injury, and time and location-based trends (see Figure 4.5 and Figure 4.6).
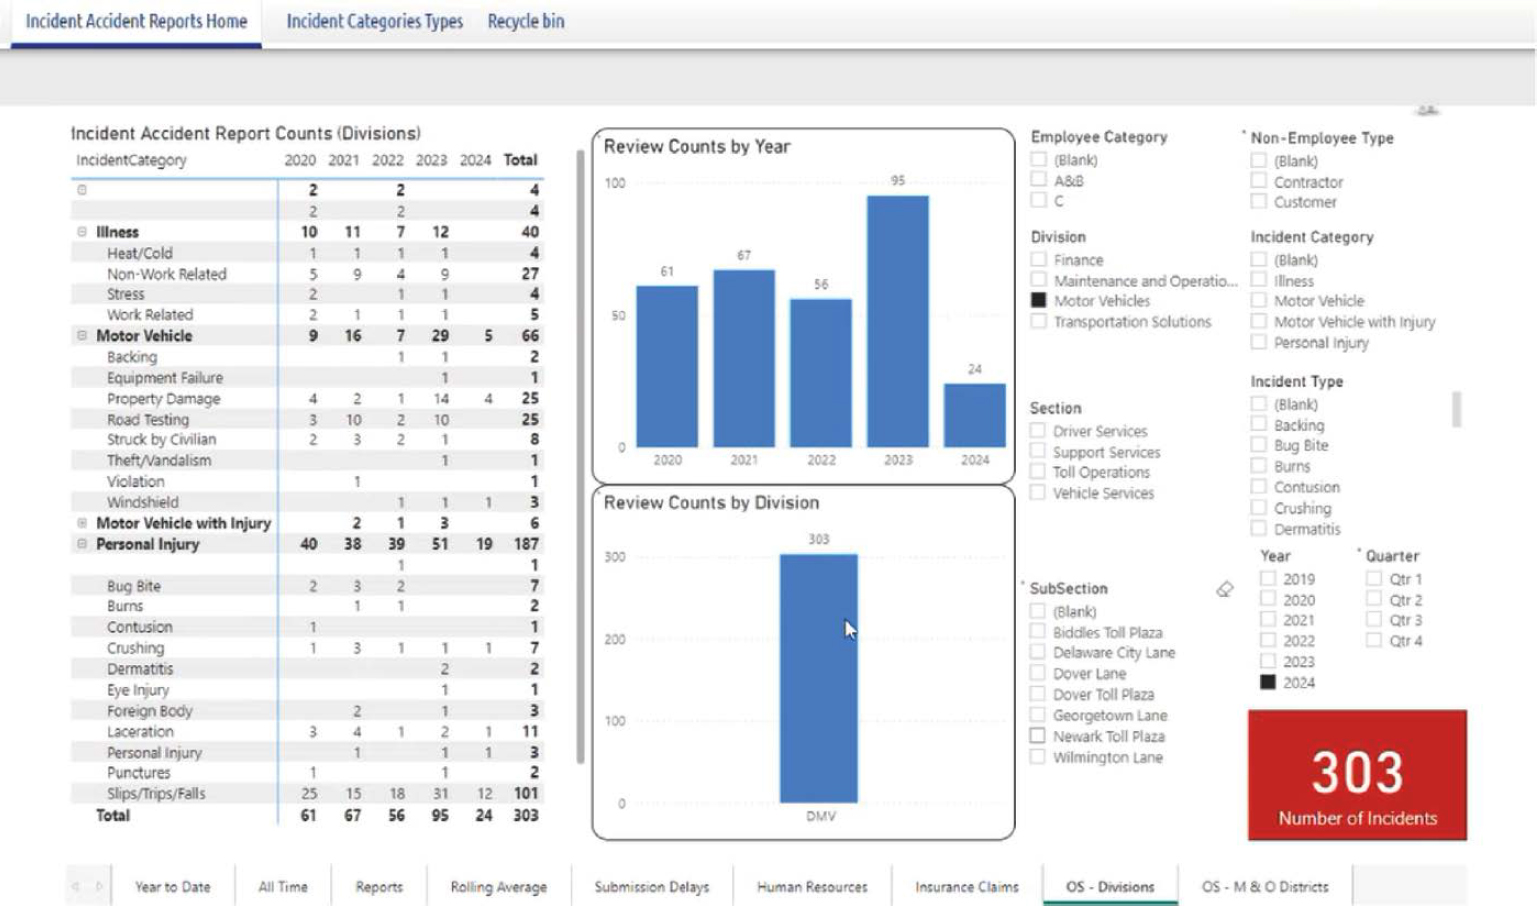
DelDOT is able to use this data to highlight trends, such as incidents peaking near holidays and bad weather; therefore, they send email blasts to heed caution during these times. They can also let specific groups know what incidents have been documented at a high rate so that toolbox talks and training can focus on those areas. An example of this data is provided in Figure 4.7. DelDOT can also compare data year to year or in other ways (e.g., quarter to quarter, or after a new initiative). To raise awareness, they discuss this data in training and new employee orientation to help employees understand that these accidents can happen to anyone.
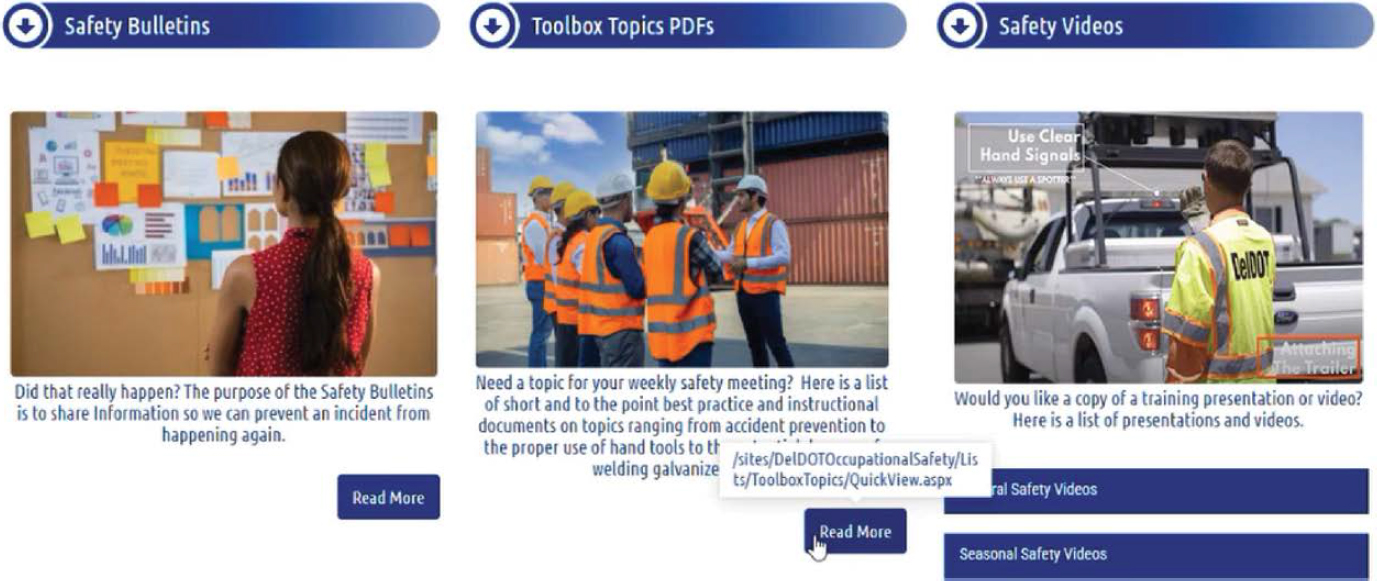
To combat these trends, DelDOT has curated materials, including safety bulletins, talk agendas, and videos, to provide a library of guidelines and information for safety—in particular, operations, PPE usage, and so forth. Figure 4.8 displays the website of these resources.
4.2.3 Employee Involvement and Training
Among the initiatives mentioned by DelDOT, three topics stood out: training programs, safety campaigns, and safety culture. DelDOT has developed robust training programs for new and existing employees. These programs include comprehensive safety training, traffic control, and proper use of PPE. A significant focus is on instilling the importance of safety from the onset of employment.
DelDOT is also using safety campaigns to emphasize safe practices. The agency organizes events such as Safety Week to promote various aspects of highway safety. These campaigns address safety for the traveling public, construction projects, and occupational safety. DelDOT is supported by leadership to keep safety “top of mind” for employees by highlighting safety in their communications and newsletters.
These efforts are shifting the DelDOT safety culture. DelDOT is gradually improving, although there is room for growth. Initiatives such as job hazard analyses are being introduced to encourage workers to assess potential risks before starting new tasks. This proactive approach is intended to make safety a routine part of daily operations.
4.2.4 Challenges and Future Directions
Despite progress, DelDOT faces several challenges to fully embedding a proactive safety culture. First, many employees are unfamiliar with safety concepts, and middle management must embrace and encourage the improvement of the safety program. DelDOT points out that some workers might not even know what a job hazard analysis is, which indicates a need for more education and integration of safety practices.
Additionally, upper management at DelDOT is supportive of safety initiatives and actively promotes them. However, translating this support into tangible changes at the ground level can be challenging. Ensuring that safety messages are consistently reinforced and understood across all levels of the organization is crucial, especially when changing the mindset of veteran employees who may be resistant to new safety practices remains a hurdle. DelDOT highlights the importance of fostering a mentality that prioritizes safety and compliance with PPE requirements among all staff, particularly those with more traditional views on safety.
Although DelDOT’s leading indicator program is evolving, there have been notable benefits. DelDOT reported a downward trend in incidents over the past year and a half, attributing this improvement to the enhanced focus on safety training and proactive measures. However, it was noted that more data is needed to conclusively link these efforts to the observed improvements. That said, the hiring of a new risk management officer with extensive field experience has significantly increased safety-related discussions within the organization. This officer’s existing
relationships and credibility with field staff have helped elevate the importance of safety across the department.
DelDOT’s experience underscores the importance of a multifaceted approach to implementing safety leading indicators. By combining training, cultural shifts, and data analysis, DelDOT aims to create a safer work environment and reduce incidents. Continued support from upper management, ongoing education, and the adoption of best practices from other states will be vital in sustaining and enhancing these efforts. This case example from DelDOT serves as a valuable reference for other states seeking to improve their safety programs through leading indicators.
While DelDOT noted that a safety program manager responsible for multiple programs could be a workload challenge, the doubling of their safety officers demonstrates a heightened emphasis on safety. DelDOT is emphasizing safety overall with the public safety and occupational safety programs, which are all supported by leadership.
DelDOT suggests that a strength of any safety program is the use of data—not only collecting data, but taking advantage of tools for managing and organizing it. Also, DelDOT noted the benefits of relying on other state DOTs and knowledge sharing in NAATSHO and acknowledges that this synthesis is a way to share and learn from the best practices of other states.
4.3 Illinois Department of Transportation
4.3.1 Overview of Safety Program
The Illinois Department of Transportation (IDOT) has been actively working on enhancing its safety leading indicator program. IDOT has two Occupational Health and Safety Coordinators who reside in IDOT headquarters and lead the development of safety policy, incident investigation, and participation in advanced safety and health training programs. These coordinators are leading the development of a program that aims to track and analyze leading indicators to improve workplace safety and reduce incidents.
At present, IDOT’s safety program is in its developmental phase, primarily due to staff availability issues. Despite these challenges, the department has been able to implement several foundational elements. IDOT primarily collects data on workplace injuries and illnesses and analyzes trends to adjust training and policies accordingly. Repetitive task injuries, particularly injuries related to ergonomics, are a significant focus. To address them, IDOT examines high-risk tasks and provides targeted training and policy recommendations.
4.3.2 Use of Safety Leading Indicators
Training is a central component of IDOT’s approach. IDOT emphasized the importance of tailoring training to the highest risk areas identified through data analysis. Although the program is in the early stages, audits, inspections, and near-miss tracking are integral parts of IDOT’s safety strategy. IDOT expressed a preference for training over policy changes, believing it to be more effective to address safety concerns. They track training and are looking at improvements to their system to target specialized training regarding needs due to repeated incidents, special functions (e.g., confined spaces, high voltage), and other factors.
IDOT plans to expand its safety leading indicator program by incorporating more comprehensive data collection and analysis methods. A significant Safety Summit was held in June 2024, at which safety managers and representatives from all nine districts will receive training on incident reporting and investigation. This summit aims to enhance the quality of data collected and improve incident investigation procedures.
IDOT is developing a pilot program that focuses on building safety committees; its goal is eventually to roll out these committees across all districts in the state. Additionally, IDOT is working on a “train the trainer” program to ensure that district managers and safety representatives are well-equipped to handle safety training, investigations, and data recording.
IDOT has seen improvements in its efforts using targeted training. For example, they provided targeted training on the use of chain saws and proper PPE and have seen a decline in associated incidents. IDOT noted that the data to support their efforts comprehensively is not yet available.
4.3.3 Employee Involvement and Training
Leadership involvement in the safety program varies within IDOT. While the upper administration, including the Secretary of Transportation, has an interest in employee safety, the most direct support for implementation is from operational heads. Upper administration has generally been supportive by providing resources and assistance when needed. This support is crucial for the successful implementation of safety programs and for fostering a culture of safety within the organization. The safety program has a strong working relationship with the head of operations, which has been beneficial to addressing safety concerns and implementing necessary changes.
Employee buy-in has been attempted, but IDOT would like to communicate that the safety office exists for their safety first and foremost. They emphasize that the safety officers are approachable and want to make clear the program is for employee safety. IDOT continues to build trust with employees as they work to improve safety communications. In programs involving reporting or near-misses, IDOT does not use any information for disciplinary actions or for placing blame. Investigations serve the purpose of updating policy.
4.3.4 Challenges and Future Directions
IDOT identified several challenges to developing and implementing the safety leading indicator program. The most significant challenge is lack of labor staffing. The extensive workload and need for comprehensive safety measures often exceed the available resources and time. Another challenge is that navigating and deploying new processes within a large, multidisciplinary state agency can slow implementation and adoption.
Despite these challenges, IDOT has seen some early benefits from their efforts. Improved communication between safety coordinators and field employees has been a notable outcome. Employees have become more proactive in requesting training and identifying hazards, which indicates a growing trust and engagement in the safety program.
The case example of IDOT’s safety leading indicator program provides valuable insights for other state DOTs looking to enhance their safety practices. Key recommendations include building trust and communication and developing a safety culture in which employees feel comfortable reporting issues without fear of disciplinary action, which involves clear communication and a supportive approach from safety coordinators. They also note the importance of comprehensive training programs that tailor training to address the most significant risks and ensure all employees receive adequate training. Use of programs such as “train the trainer” can help disseminate knowledge effectively across the organization. IDOT also notes that support from upper administration and operational heads is vital. Regular updates and engagement with leadership can ensure that safety programs receive the necessary resources and attention. Finally, IDOT values data-driven program adjustments. Analyzing trends in workplace injuries and illnesses to adjust training and policies helps to proactively address safety concerns. Additionally, near-miss tracking and thorough incident investigations can provide valuable data for these adjustments.
By focusing on these areas, state DOTs can build more effective safety leading indicator programs, ultimately reducing workplace incidents and enhancing overall safety.
4.4 Virginia Department of Transportation
4.4.1 Overview of Safety Program
The Virginia Department of Transportation (VDOT) employs approximately 7,700 full-time employees, 1,000 part-time employees, and up to 10,000 contractors. Nearly 4,000 employees of the 7,700 full-time employees have positions requiring work in the field. For these employees, VDOT implemented a comprehensive program focusing on safety leading indicators to enhance workplace safety and reduce incidents. This case example illustrates how VDOT collects, analyzes, and utilizes safety data to improve its safety culture and operational effectiveness.
4.4.2 Use of Safety Leading Indicators
VDOT employs various safety leading indicators, with a significant emphasis on lessons learned and near-miss reporting. These indicators are crucial to identifying potential hazards before they result in accidents or injuries. The agency’s approach to safety is data-driven, relying on modern digital tools and an inclusive, team-oriented strategy to foster a safer working environment.
Near-miss incidents are a cornerstone of VDOT’s safety program. A near-miss is an event in which an accident is narrowly avoided. VDOT captures and analyzes these incidents to prevent future occurrences. For instance, near-misses can include situations such as equipment malfunctions, procedural errors, or environmental hazards that could have led to an injury but did not. A lessons-learned event results when there is an incident or injury that VDOT wants to prevent in the future.
VDOT uses digital tools such as the ArcGIS Survey123 to collect near-miss and lessons-learned data. This tool helps employees report incidents easily and ensures that the information is disseminated across the state. By sharing these reports, VDOT can implement corrective actions statewide, thus preventing similar incidents in different locations.
The lessons-learned program at VDOT is designed to analyze incidents in which injuries occurred or significant safety issues were identified. This process is essential for ensuring that improvements are made. The program addresses and rectifies problems identified in one part of the state to prevent them from happening elsewhere. This proactive approach is critical for maintaining compliance with safety regulations and standards set by Virginia Occupational Safety and Health (VOSH).
For example, if an incident involving a piece of equipment occurs in one district, VDOT ensures that the issue is communicated and resolved throughout all districts. Such communication not only improves safety but also mitigates potential regulatory repercussions from VOSH.
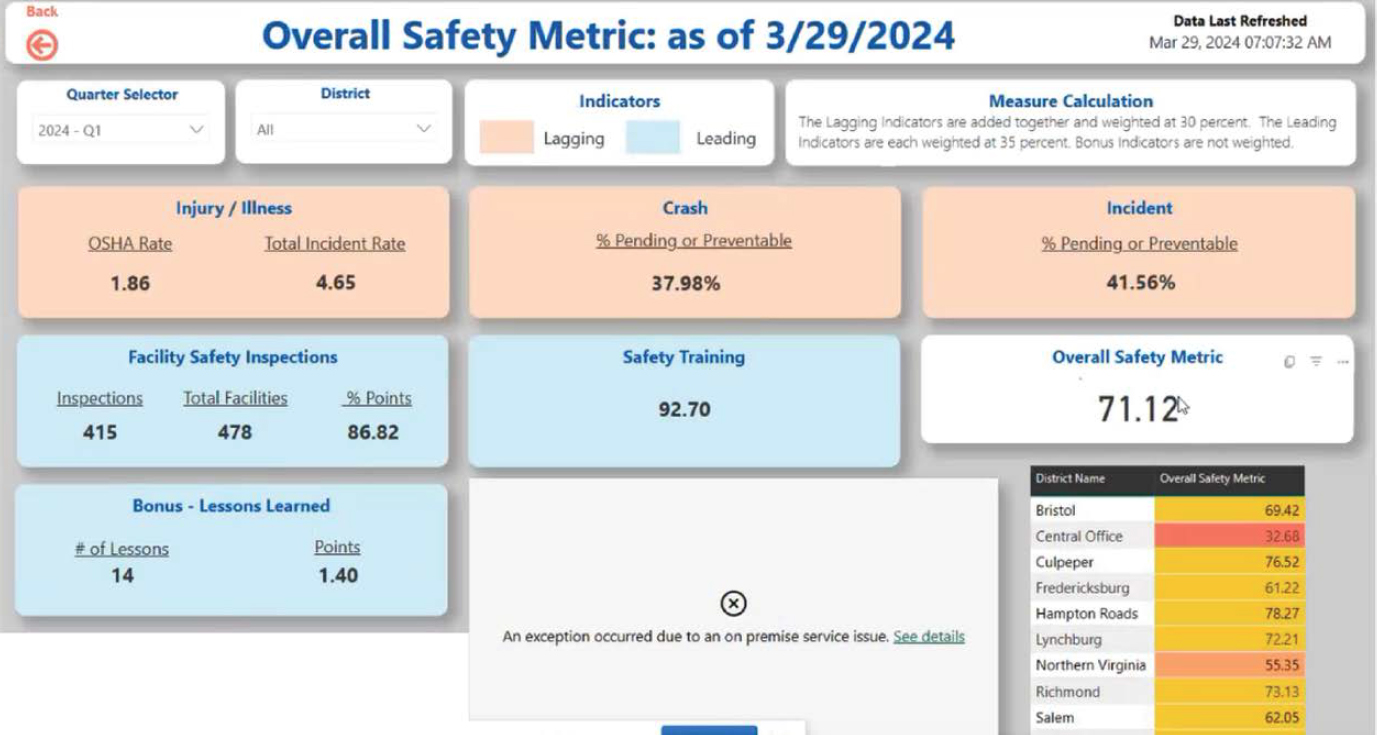
VDOT integrates these safety leading indicators into a comprehensive dashboard using Microsoft Power BI. This dashboard provides real-time visibility into safety data and enables managers and safety officers to monitor trends and address issues promptly. The data collected through near-miss reports and lessons learned is rolled into various safety programs, thus enhancing the overall effectiveness of VDOT’s safety initiatives. VDOT tracks both lagging and leading indicators, which are often used separately; however, they also have an overall safety metric combining leading and lagging indicators.
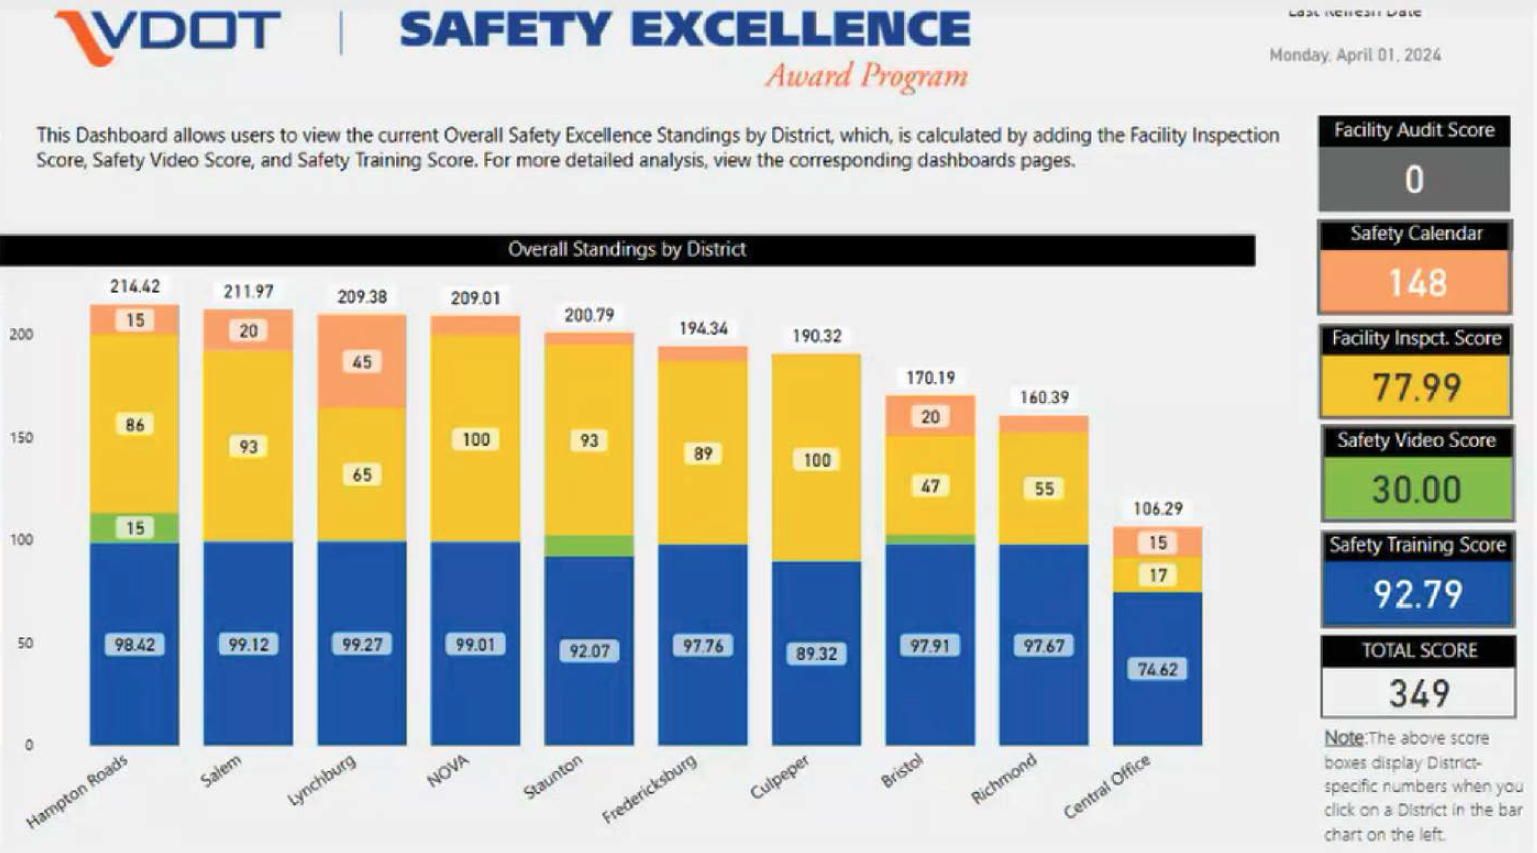
While near-misses and lessons learned are more common leading indicators, a more unique safety leading indicator for VDOT is the Safety Excellence Award program. This year the program has four categories that are tracked for all employees: trainings (four trainings are required, two mandatory and two unique but safety-related), safety videos (submitted by employees regarding a safety topic, some of which have been used for following years’ training), facility inspections (a self-assessment and follow-up QA/QC for approximately 20% of the inspections, captured through ArcGIS Survey123), and a safety calendar (employees to submit drawings to correspond with monthly topics from the National Safety Council). The categories are scored and tallied and broken down by district in Figure 4.9.
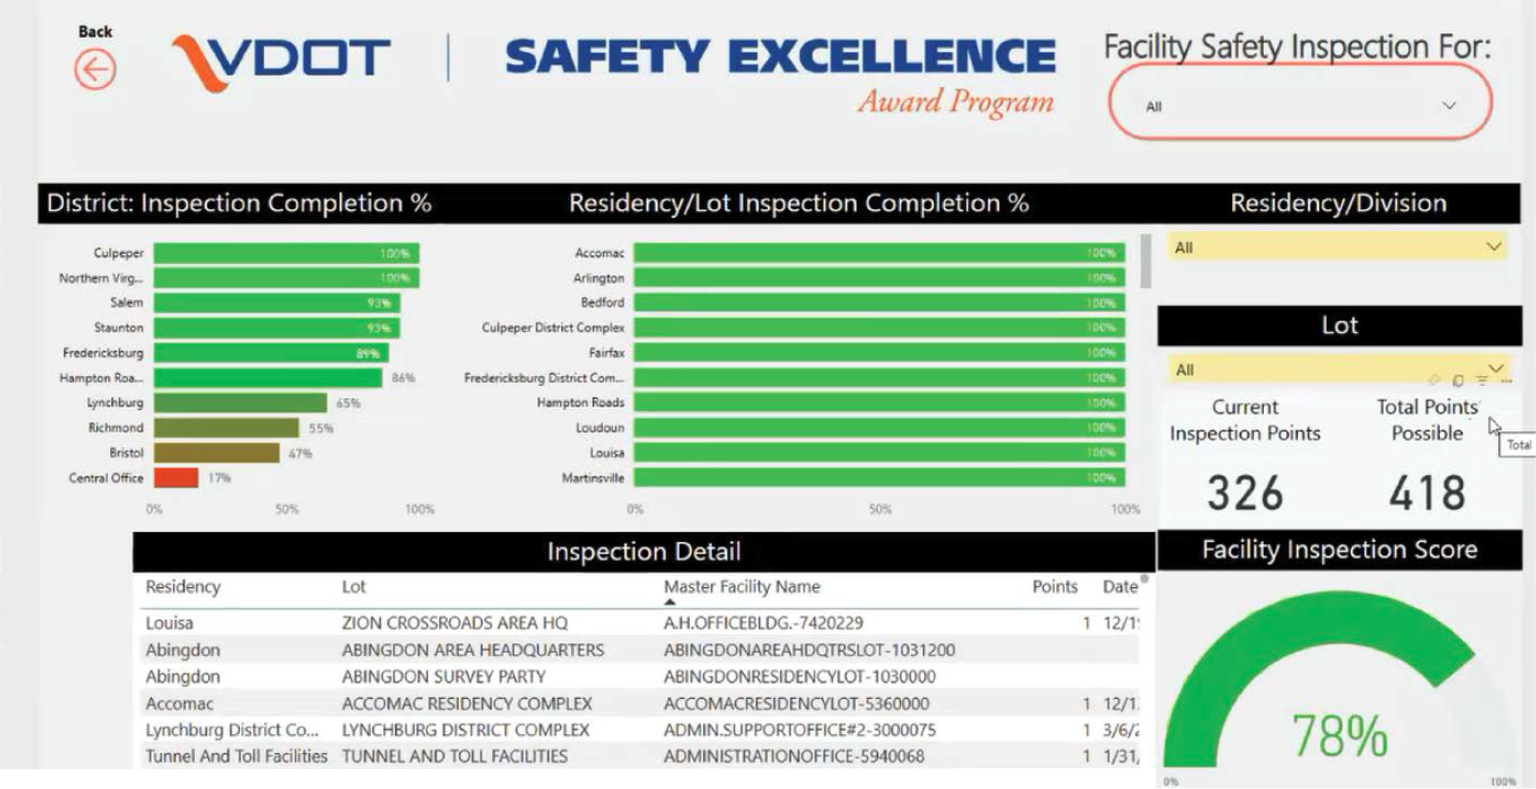
Awards are then presented each summer during the VDOT Statewide Rodeo. The data from the scoring and data submissions allows for in-depth data analysis and sharing, as seen in Figure 4.10 and Figure 4.11. The safety office has its own data scientist who provides data sharing, analysis, and dashboards for ease of use by managers.
This data is also available in a safety data analytics portal, along with other information.
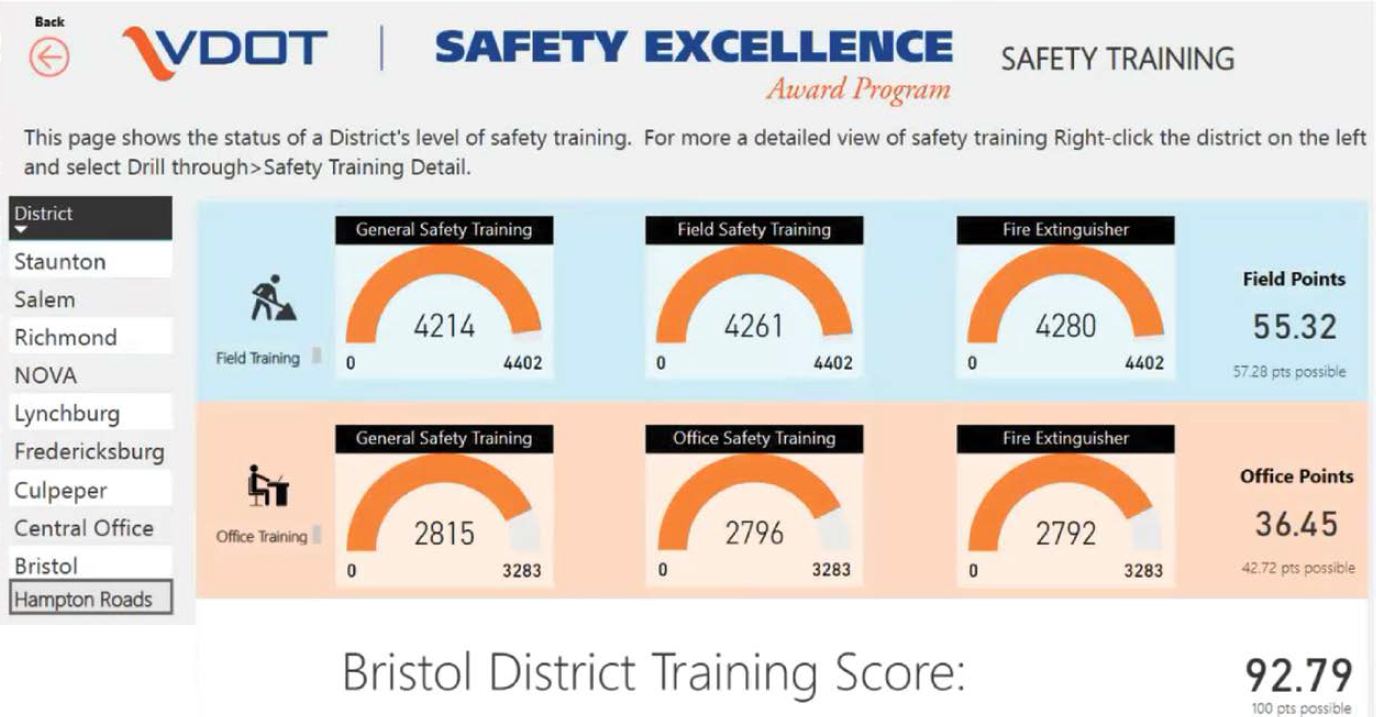
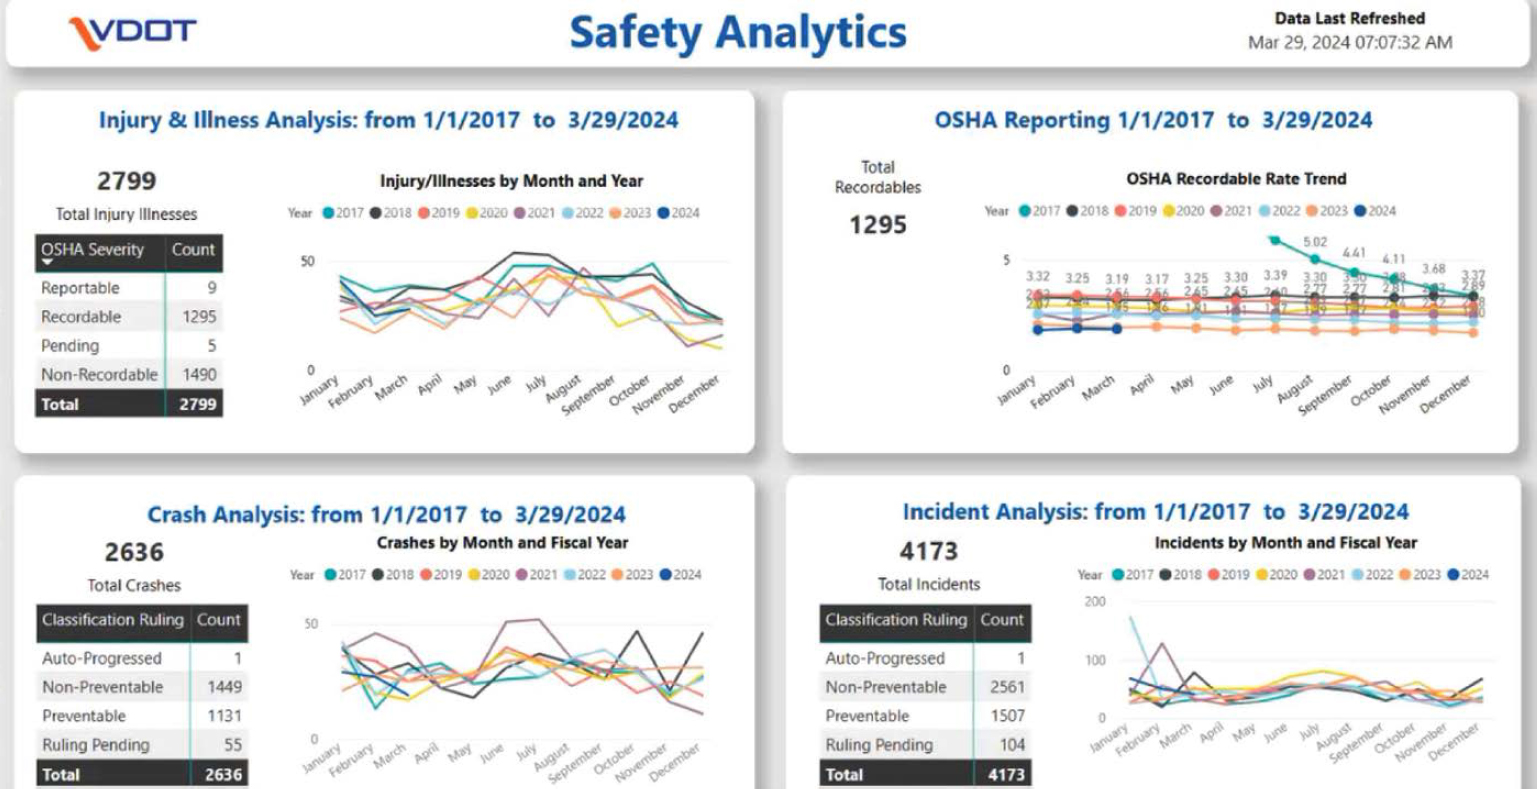
The data is pulled from their Esri system and then into Microsoft Power BI. They are able to automate the data analysis on dashboards and in reporting (see Figure 4.12). This data is driven from lagging indicators, but through sharing and providing the data, it encourages a proactive approach to improvement. VDOT uses the lagging indicators and leading indicators and, through their own developed scoring equation, provides an overall safety score (see Figure 4.13).
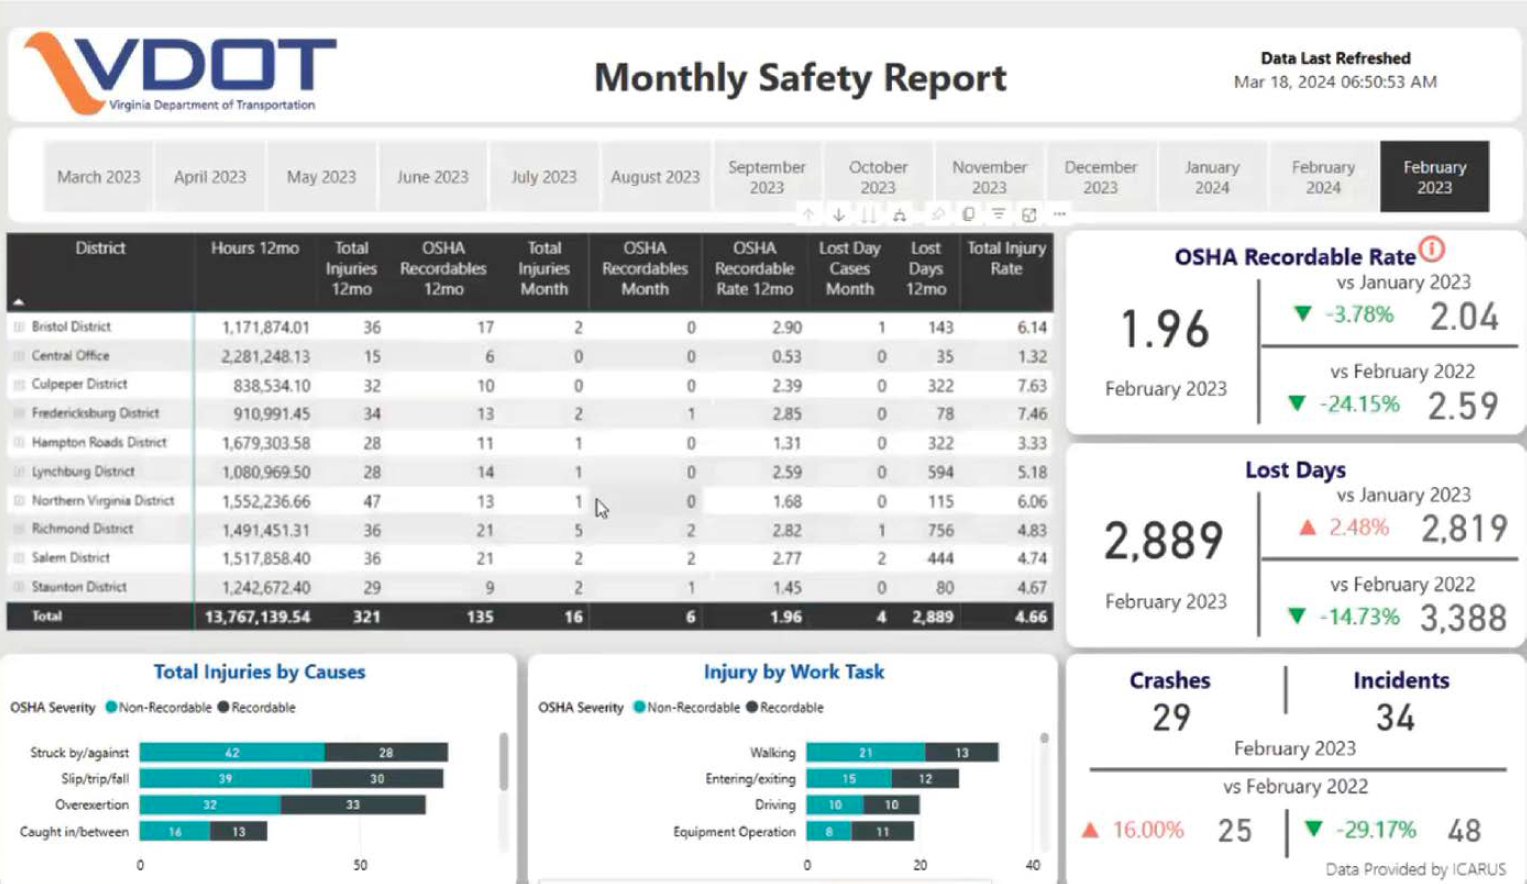
This emphasis on data and analytics assists VDOT to share and present their data proactively. The approach did not occur by happenstance. VDOT determined how best to capture their data for desired end needs in 2016 and now have the database to investigate trends and put their data to work to improve their safety program (see Figure 4.14).
4.4.3 Employee Involvement and Training
VDOT’s training programs are tailored to different employee groups, from maintenance crews to executive leadership, ensuring that safety protocols are understood and followed at all levels. These programs are continuously updated based on feedback and data analysis, making them dynamic and responsive to new challenges. Training is also provided for data entry and the tools VDOT uses (e.g., ArcGIS Survey123, Microsoft SharePoint, Microsoft Power BI) based on who needs to use the tools. The support for the program is top-down from leadership, who encourage safety in all areas of the department. For example, a VDOT expectation is that every meeting begins with a safety brief, and a library of safety briefings is available to all employees.
The impact of VDOT’s focus on safety leading indicators has been significant. The agency has seen a steady decline in its OSHA recordable rate from 5.02 in 2017 to approximately 1.8 in 2024. Additionally, the number of motor vehicle incidents, overall workplace injuries, and lost-time incidents has decreased. This reduction in incidents has also led to lower workers’ compensation costs, thus saving millions of dollars over the years. VDOT’s data is also detailed enough to indicate which groups have deficiencies as well as high performers.
In another example from 2021, VDOT launched a major safety initiative to reduce vehicle-backing incidents, which were a significant source of accidents. This initiative included mandatory training on backing procedures, implementing a safety circle around vehicles, and installing steering wheel covers as reminders for drivers to perform safety checks. The impact of this program was substantial, reducing backing incidents from 113 in 2020 to 56 by 2023.
The success of VDOT’s safety programs is also reflected in increased employee engagement. The number of safety submissions and the level of participation in training programs have both risen, indicating a growing safety culture within the organization.
4.4.4 Challenges and Future Directions
Despite these successes, VDOT faces ongoing challenges to maintaining and improving its safety programs. One significant challenge is keeping employees engaged and ensuring that safety protocols are consistently followed. VDOT addresses this challenge by continuously evolving its safety programs and introducing new initiatives to keep the workforce motivated. Continuous communication helps employees understand why data is collected, how it is used, that reporting is not punitive, and that the objective is to keep employees safe.
For example, during the COVID-19 pandemic, VDOT had to adapt its training and safety protocols to a remote work environment. This process included leveraging online platforms for training and ensuring that employees working from home were engaged in safety practices relevant to their new work settings and that the program adapted to keep things fresh.
VDOT’s comprehensive approach to utilizing safety leading indicators has proven effective in enhancing workplace safety and reducing incidents. By focusing on near-misses, lessons learned, and continuous training, VDOT not only complies with safety regulations but also fosters a proactive, nonpunitive safety culture. Having a program leading from the positive instead of the negative results in organic safety program improvement built from trust instead of fear of compliance. The agency’s success demonstrates the value of a data-driven, inclusive approach to safety management and serves as a model for other transportation departments and large organizations.
4.5 Washington State Department of Transportation
4.5.1 Overview of Safety Program
The Washington State Department of Transportation (WSDOT) has been at the forefront of integrating safety leading indicators into its safety programs to reduce workplace incidents and enhance overall safety. This case example explores the strategies implemented by WSDOT, the challenges encountered, and the significant results achieved through the adoption of safety leading indicators. WSDOT has over 6,800 employees, and their safety program includes a safety program manager in the central office and a safety manager in each region.
4.5.2 Use of Safety Leading Indicators
The safety leading indicator program is driven by a Secretary’s Executive Order for Employee Safety. The program tracks employee participation in eight categories of leading indicators with results reported during various employee meetings and evaluations. The eight categories tracked are as follows:
- Near-Miss: lessons learned, good catches, or close calls viewed as an opportunity for improvement
- Stretch and Flex: stretching muscles and tissues to avoid injuries
- Employee Safety Recognition: workers recognized for safe behaviors
- Employee Health and Wellness: crew discussion of physical and mental wellness and completion of activities
- Safety and Health Training: participation in safety and health training topics
- Quality Safety Meetings: issues reviewed and solutions brainstormed by crews
- Facility/Worksite Inspections: monthly facility and worksite inspections
- 360 Walk-Around: walking around a vehicle or equipment before entry and then using the “Take 2” concept to be patient and avoid hazards
These eight categories have varying scoring criteria for evaluating participation. Although this program is rolling out to all regions, not all regions are incorporating all eight categories at once.
WSDOT has found flexibility leads to improved acceptance and adoption; therefore, the regions are adopting categories according to their own their own determination. Some regions have elected to use the scoring as a recognition program and present awards. These awards include hats, stickers, and food. Some regions have decided against the award program to focus on safety as part of the job, while others find the competition helps support implementation. The programs have evolved since 2018, with regions providing much feedback and safety leadership being flexible enough to change.
4.5.3 Employee Involvement and Training
Communication and leadership commitment are critical components according to WSDOT. Leadership also needs to understand the program, speak the language, and provide encouragement beyond financial support. Educating employees about the difference between lagging and leading indicators was essential. WSDOT detailed the process of using presentations and PowerPoint slides during safety meetings to explain the concepts and implementation of leading indicators. This approach ensured that all employees, including new supervisors, were well-informed and capable of participating effectively.
A significant milestone in the program was the issuance of an executive order by the Secretary of Transportation encouraging participation in the leading indicator program. This executive order made it an expectation in the employees’ job responsibilities, thus ensuring consistent participation across all regions.
Publicizing safety performance and recognition of achievements monthly played a crucial role in maintaining momentum and encouraging ongoing participation. Supervisors and employees could see their progress, which reinforced the importance of the program and fostered a culture of safety.
Ensuring consistent participation and compliance across different regions and supervisory levels was challenging. Some supervisors were initially reluctant to incorporate the new practices into their routines. The executive order and continuous support from leadership helped address these challenges by setting clear expectations and providing the necessary authority to encourage participation.
In some cases, the regions are taking a firm line on participation, but they are also able to use the results of other regions to support implementation. The most notable support for buy-in was a Secretary’s Executive Order emphasizing the program and recognizing the safety of employees. Publicizing successes, sharing the data that show improvements, and getting supervisors engaged to be program leaders will establish participation. Leadership sets the tone, and while there may be some resistance, persistence and the data will win employees over. Again, communication and explanations of the indicators’ importance is also an effective approach.
4.5.4 Challenges and Future Directions
Changes to the safety program at WSDOT were a significant undertaking and took many years to establish. The safety leading indicator program is one piece of the overall program and initiative to make WSDOT safe. Initial resistance was encountered from various levels of management. WSDOT highlighted that the resistance stemmed from unfamiliarity with the new approach and skepticism about its effectiveness. Overcoming this resistance required persistent communication and demonstration of the program’s benefits.
The initial step was securing the commitment from top leadership. WSDOT emphasized the critical role of leadership in communicating and endorsing the program. Leaders not only embraced the initiative but also actively participated in communication strategies, such as sending out emails and participating in reward programs to highlight the importance of leading indicators.
The adoption of safety leading indicators has led to noticeable improvements in safety metrics. WSDOT regions that actively participated in the program reported significant decreases in injury rates, illness rates, and vehicle incidents. The introduction of measures such as 360 walkarounds contributed to the reduction of backing incidents, which were a common issue. Those who are implementing the program are seeing the benefits.
The program fosters a culture of safety in which employees and supervisors actively engage in safety practices; they even take the safe practices home. The interest and genuine questions from employees about the program indicate a deeper understanding and commitment to safety. Safe employees are more productive and miss less work.
The program also serves as a platform for leadership development. For instance, a supervisor who embraced the program to demonstrate his commitment to safety received acknowledgment of this work in his performance evaluation. His leadership in the program was a major factor in his promotion to superintendent. His success story encouraged other supervisors to take the program seriously and strive for similar results.
The case of WSDOT illustrates the transformative impact that safety leading indicators can have on workplace safety when implemented with strong leadership support, effective communication, and consistent education. Despite initial resistance, the clear benefits regarding reduced incidents and an enhanced culture of safety have proven the value of this approach. WSDOT’s experience provides valuable insights for other transportation departments looking to improve their safety programs through the use of leading indicators.
For other states considering a safety leading indicator program, WSDOT suggests patience. If a safety program is not strong, leading indicators may not be the place to start. WSDOT affirms that there is a need to change the mindset and prepare the state DOT for the leading indicators before jumping in. The program will take time, but openness to the concept is necessary. WSDOT claims it takes 7 years to change a culture. During that time, consulting other states and participating with NAATSHO can suggest effective practices.


