Tracking Safety Leading Indicators to Improve DOT Employee Safety Performance (2025)
Chapter: 3 Survey Results
CHAPTER 3
Survey Results
An online survey questionnaire was distributed by email to the members of the North American Association of Transportation Safety and Health Officials (NAATSHO). A total of 43 responses across 43 different state DOTs were received (Figure 1.1). Appendix B provides the aggregate survey results. This chapter reports on the results of the survey questions.
3.1 Demographic Information
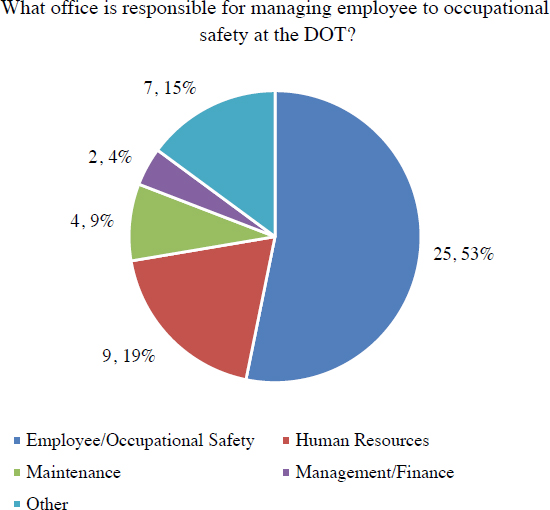
The survey began by identifying the office responsible for managing employee safety within each state DOT, given that it varies nationally. The question allowed respondents to select multiple options. Among the 43 state DOTs responding to the question, a few selected multiple options, yielding a total of 47 responses. Figure 3.1 shows that most (53%, 25 responses) of the survey respondents are housed within employee or occupational safety divisions within their respective state DOTs. Other respondents represent an “Other” category (15%, 7 responses), Human Resources (19%, 9 responses), and Management/Finance (9%, 4 responses). The “Other” category write-in responses included offices such as Division of Safety, Maintenance, Occupational Safety/Insurance Program, Operations, Office of Chief Engineer, and Officer of Homeland Security and Occupational Safety.
3.1.1 Responding State DOT Structure
To provide a better understanding of the survey respondents, the survey asked a series of question about the state DOT’s structure in a variety of areas. This section provides a breakdown of those responses. For additional details and to identify specific state DOTs that may be similar in structure, see the responses included in Appendix B.
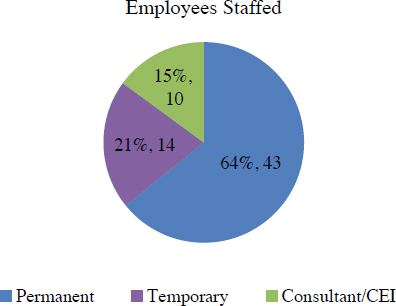
The first question regarding state DOT structure asked about the types of employees at the state DOT. All 43 responding state DOTs noted that they have permanent employees, 14 (21%) noted they also have temporary employees, and 10 (15%) noted they have consultant or construction engineering and inspection (CEI) employees (see Figure 3.2).
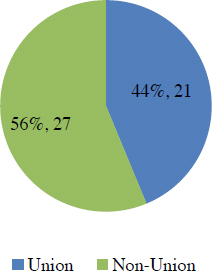
Given the diversity of staff representation nationally, state DOTs were asked whether their nonmanagement labor is union or nonunion. Figure 3.3 shows that 27 (56%) survey respondents noted their nonmanagement labor are nonunion, and 21 (44%) survey respondents noted their nonmanagement labor are represented by a union.
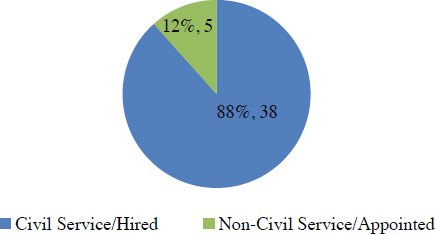
Hiring systems within state DOTs differ. For nonmanagement staff, survey respondents were asked whether positions are considered “civil service/hired” or “non-civil-service/appointed.” Thirty-eight DOTS (88%) responded that nonmanagement staff are civil service/hired, and 5 (12%) responded that those positions are non-civil service/appointed (see Figure 3.4).
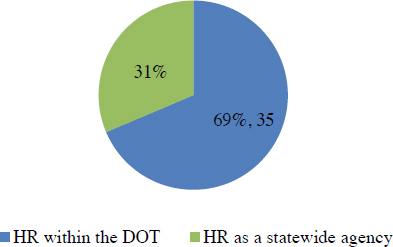
Human resource departments vary across state DOTs. This survey found that 35 (69%) of survey respondents embed their human resources department in the state DOT, while 16 (31%) utilize human resources through a statewide agency (see Figure 3.5).
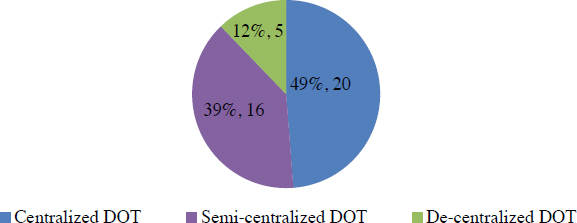
Geography, among other reasons, has influenced the governance structures of state DOTs. This survey reports that 20 (49%) of respondents have a centralized state DOT governance structure, 16 (39%) have a semi-centralized state DOT governance structure, and 5 (12%) have a decentralized state DOT governance structure (see Figure 3.6).
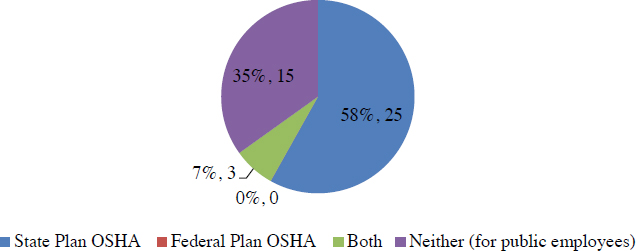
Given that the focus of this synthesis is employee safety, the last state DOT structure question was related to the required reporting of the state DOT to an Occupational Safety and Health Administration (OSHA) group. Twenty-five (58%) survey respondents report to a state OSHA, 0 report to the federal OSHA, 3 (7%) report to both a state and the federal OSHA, and 15 (35%) report to neither, as their public employees are exempt (see Figure 3.7).
3.2 Use of Safety Leading Indicators
The next section of the survey asked respondents about the frequency and length of their specific safety leading indicators.
3.2.1 Safety Leading Indicator Usage and Length
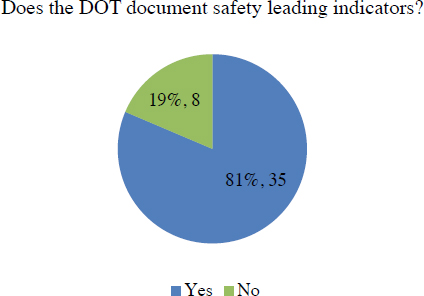
Of the 43 state DOTs that responded to the survey, 35 (81%) document safety leading indicators, and 8 (19%) do not document safety leading indicators (see Figure 3.8). A statement to clarify the meaning of safety leading indicators was provided for this question as follows:
For the purposes of this survey, safety leading indicators are “proactive and preventive measures that can shed light about the effectiveness of safety and health activities and reveal potential problems in a safety and health program (OSHA).” These would be in opposition to lagging indicators that are safety measures after an incident occurs such as a total recordable incidence rate (TRIR) and days away, restricted, or job transfer (DART) rate.
When asked about documenting, using, or tracking of safety leading indicators, this means the measure(s) are documented regardless if on paper, through electronic means, or through a safety management system (SMS).
Section 3.2.1 through Section 4 delve into specific questions about safety leading indicators for the 35 state DOTs that document their use. Section 3.5 concerns a series of questions to those eight state DOTs that do not document safety leading indicators.
Many state DOTs that document safety leading indicators use responded that they have been documenting them for some time. Twelve (34%) respondents have been documenting safety leading indicators for more than 10 years, 6 (17%) have been documenting them more than 5 but less than 10 years, 9 (26%) have been documenting them more than 3 but less than 5 years, 7 (20%) have been documenting them more than 1 but less than 3 years, and 1 (3%) has been documenting them for less than a year (see Figure 3.9).
3.2.2 Specific Types of Safety Leading Indicators
Following questions about the existence and length of use of safety leading indicators, the survey asked about specific types of safety leading indicators and the frequency of their documentation. The results of this question are provided in Table 3.1. Twenty safety leading indicators were presented in the survey, and each had at least six state DOTs reporting that they were documented. The question was posed in a matrix format that began by asking whether a state DOT documented a particular indicator, followed by options for documentation frequency, such as “as needed” or “when an event occurs,” followed by regular frequencies, such as monthly and yearly. The matrix question allowed a respondent to select any of the possible responses and did not require a response of “Is Documented,” in order to select a frequency; likewise, respondents were not required to select a frequency if they noted an indicator was documented. This matrix was necessary to allow flexible feedback; however, it also led to results that could not be tallied into representative percentages.
The leading indicators listed in Table 3.1 do not necessarily represent activities that occur before an incident occurs. For instance, toolbox talks, and various safety training, occur frequently and can be pre-incident and post-incident. The safety leading indicator that was most documented was “tracking safety training logs,” while “use of stretch and flex programs” was the least frequently documented. Regarding frequency, most of the safety leading indicators are documented “as needed” or “as event occurs” (see Table 3.1). It is important to note that the safety leading indicators listed are not necessarily specific metrics. For instance, the safety leading indicator “Use of Toolbox Talks” is not a measurement. If the DOT documents toolbox talks in metric format, it could be measured by “percentage of crews that conduct a daily toolbox talk” or “percentage of superintendents that have been through a toolbox talk training program.”
Write-in safety leading indicators under the “Other” option are quoted as follows:
- Safety Training Participation Rate
- Work Zone TTC Audits
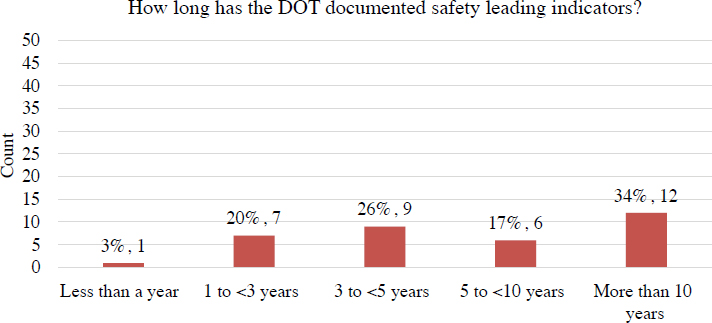
Table 3.1. Use and frequency of specific safety leading indicators, N = 35.
| Of the following safety leading indicators, which does the DOT document and how frequently are they documented, used, or tracked? | |||||||
|---|---|---|---|---|---|---|---|
| Leading Indicator | Is Documented | Documented as Needed/As Event Occurs | Documented Daily/Weekly | Documented Monthly | Documented Quarterly | Documented Annually | Documented on Other Frequency |
| Reporting of near-miss/close calls | 13 | 20 | 0 | 1 | 0 | 0 | 1 |
| Use of safety committees | 16 | 12 | 1 | 6 | 11 | 0 | 0 |
| Supervisors being coached and encouraged for safety | 9 | 22 | 1 | 1 | 1 | 0 | 3 |
| Employee perceptions of just and fair safety culture | 9 | 12 | 0 | 4 | 0 | 1 | 0 |
| Safety leadership training | 17 | 14 | 1 | 1 | 2 | 0 | 1 |
| Use of toolbox talks | 16 | 11 | 11 | 2 | 1 | 0 | 0 |
| Use of safety audits/risk assessments | 22 | 12 | 4 | 1 | 2 | 1 | 0 |
| WorkZone traffic control training | 25 | 16 | 3 | 2 | 1 | 2 | 0 |
| First aid/CPR training | 28 | 15 | 0 | 1 | 1 | 1 | 1 |
| Use of stretch and flex programs | 6 | 13 | 1 | 0 | 0 | 0 | 0 |
| Use of wellness programs | 12 | 15 | 0 | 2 | 2 | 1 | 0 |
| OSHA 10 training | 12 | 13 | 1 | 0 | 2 | 0 | 1 |
| Communication of safety lessons learned | 16 | 20 | 2 | 0 | 0 | 0 | 1 |
| Reporting of vehicle inspections | 17 | 10 | 8 | 0 | 1 | 2 | 1 |
| Reporting of vehicle operations (i.e., seat belt usage) | 12 | 7 | 5 | 1 | 1 | 0 | 0 |
| Participation and buy-in of leadership to safety activities | 11 | 15 | 2 | 0 | 1 | 0 | 0 |
| Existence of agency safety champion | 11 | 9 | 1 | 2 | 0 | 0 | 0 |
| Tracking PPE spending/replacement | 21 | 10 | 2 | 0 | 2 | 1 | 0 |
| Investing in safety programs | 18 | 12 | 1 | 1 | 2 | 0 | 0 |
| Tracking safety training logs | 24 | 16 | 3 | 1 | 3 | 1 | 1 |
| Other | 11 | 6 | 2 | 2 | 1 | 1 | 0 |
- Outdoor Storage of Flammables and Combustibles
- All Safety Training
- Daily Safety Huddles
- Weekly/Biweekly/Monthly Safety Calls
- Annual Safety Pledge Signing
- Safety Focus Posters
- Safety Meetings
- Pre-Activity Safety Program
- OSHA 30
For a more detailed breakdown of what each state DOT documents, see Appendix B to determine who has developed a specific training option of interest.
3.2.3 Safety Training Programs
Several of the safety leading indicators are related to safety training programs. A question asked what programs existed in the state DOT’s portfolio of safety trainings: 34 (97%) of survey respondents have first aid and CPR training, 33 (94%) have WorkZone Traffic Control training, and 31 (89%) have defensive driving training (see Figure 3.10). OSHA 10-hour (18 respondents, 51%) and OSHA 30-hour (9 respondents, 26%) were the least noted safety trainings from the pre-populated list. Twenty-two (63%) respondents selected safety leadership training. While not specified, these programs inform leaders about conducting conversations about safety, expectations of participation in the safety program, and programs such as “Foundations for Safety Leadership” from The Center for Construction Research and Training. Twenty-seven (77%) survey respondents provided a write-in “Other” response for safety training, which are quoted and categorized in Table 3.2.
For a more detailed breakdown of each state DOT’s safety trainings, see Appendix B.
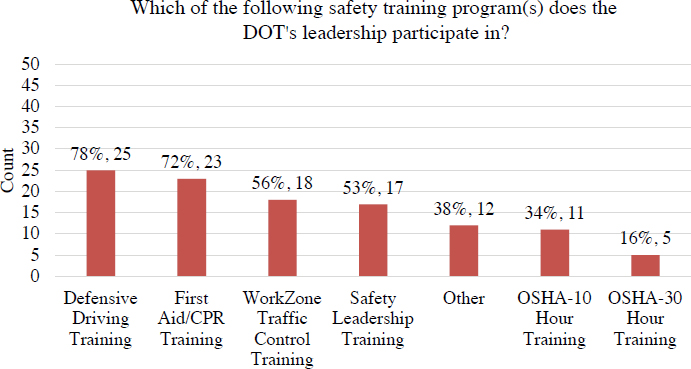
One of the important components of an occupational safety program identified by OSHA and discussed in the literature review is management and leadership involvement with safety. Furthermore, one of the objectives of this synthesis is to identify leader engagement. Figure 3.11 shows that state DOT leadership in 25 of 32 responding state DOTs (78%) participate in defensive driving training, 23 (72%) DOTs participate in first aid/CPR training, and 18 (56%) DOTs participate in WorkZone Traffic Control training. In addition, 12 (32%) of responding DOTs provided a write-in response, which are quoted as follows:
- Safety-related training as it pertains to the specific work task
- Forklift training
- Statewide leaders from Crew Leaders to Senior Leaders receive training above as well as triennial workplace safety and risk issues
- Safety Excellence Program training
- Smith System Driver training
- Same as non-leadership
- Safety Committee
- Safety Orientation
- OSHA required annual trainings
- Chainsaw training
- Operational/Specific Training
- Safety policy and programs
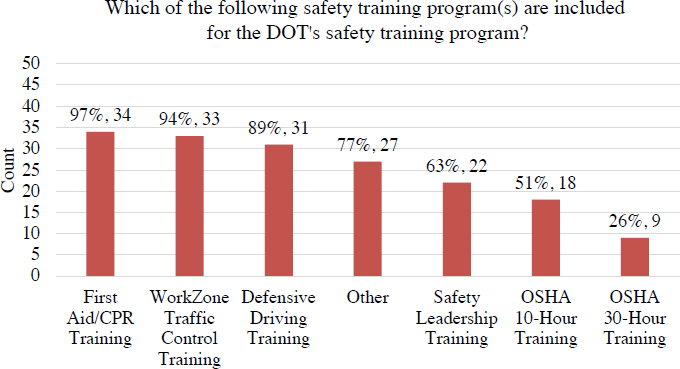
Table 3.2. List of write-in safety training offered by state DOTs.
| Task-Specific Training | Job/Employment-Specific Training | Equipment Training | Driver/Operator Training |
|---|---|---|---|
| Aerial Lift | New Employee Safety Orientation | Forklift | Smith System Behind the Wheel Driver Training |
| Arc Flash | Incident Investigations | Bucket Truck | Boat/Kayak Operations |
| Asbestos | Emergency Action Plan | Chainsaw | Equipment Operator Safety Training |
| Traffic Incident Management | Work Site Assessments | Fixed Cab and Mobile Crane | Snowplow Operations |
| Flagger | Work Site Visits | Scissor Lift | Operation of TMA |
| Bridge Deck Patching | Supervisor Safety Training | Under Bridge Inspection Truck | |
| Bridge/Super Structure Cleaning | Traffic Control Supervisor | Scaffolds | |
| Cable Barrier Repair | Traffic Control Technician | ||
| Confined Space and Confined Space Competent Person | Division Safety Coordinator Training | ||
| Excavations | Division Emergency Management Training | ||
| Trenching | Basic Traffic Control Short Duration | ||
| Fall Protection and Fall Protection Competent Person | Hazard Communication | ||
| Hazmat | Traffic Control in Urban Work Zones | ||
| Bloodborne Pathogens | HAZWOPER 40-hour and 8-hour refresher | ||
| Stop the Bleed | Active Shooter and Bomb Threats | ||
| Tree/Brush Removal | Construction Inspector Safety Training | ||
| Crack Sealing | Nighttime Temporary Traffic Control | ||
| Culvert Replacement/Pipelining | |||
| Digger Derrick | |||
| Ditch Maintenance | |||
| Drain Cleaning | |||
| Electrical Safety, NFPA 70 | |||
| Lead | |||
| Debris/Litter Pickup | |||
| Lockout/Tagout | |||
| Pothole Patching | |||
| Shoulder Maintenance | |||
| Silica | |||
| Spot Paving | |||
| Stormwater | |||
| Swift Water Rescue | |||
| Utility Markings Basics | |||
| Welding |
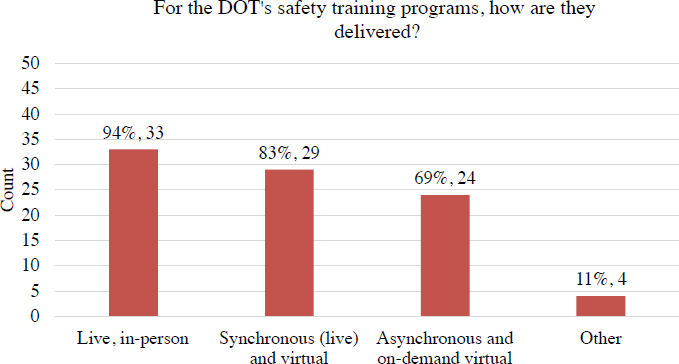
The last question specifically related to safety training sought to understand the method for training delivery. Figure 3.12 shows that 33 out of 35 (94%) deliver their safety training through live, in-person sessions; 29 (83%) deliver training synchronously but virtually; and 24 (69%) deliver training asynchronously and on-demand virtually. Four survey respondents provided write-in options of “online–on demand,” “external contract,” “self-paced virtual,” and “not sure I understand. No difference.”
3.3 Implementation and Results
This section of the report documents responses related to questions about implementation and results of the safety leading indicator programs at state DOTs.
3.3.1 Requirements for External Partners
Recognizing that state DOTs often work with external partners that may be exposed to hazardous working conditions, the survey sought to understand roles, responsibilities, and requirements for those external partners in their use of safety leading indicators.
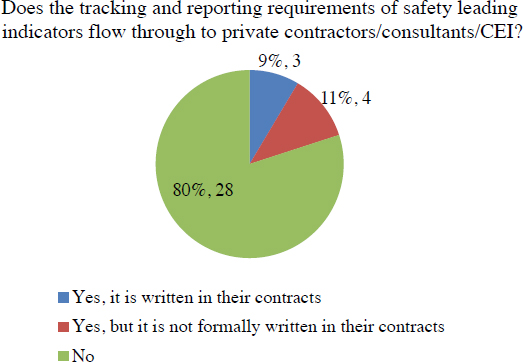
Figure 3.13 shows that 28 out of 35 (80%) survey respondents do not require tracking and reporting of safety leading indicators by their private contractors/consultants/CEIs. Four (11%) state DOTs pass on those requirements but do not formally write them in their contracts, while 3 (9%) state DOTs write those requirements into their contracts.
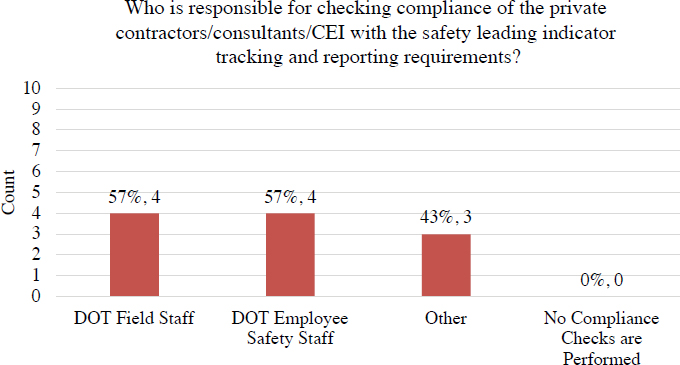
Of the seven state DOTs that pass along requirements for safety leading indicator use, 4 (57%) respondents have their field staff check for compliance, 4 (57%) have their safety staff check for compliance, and 3 (43%) noted that other staff are responsible (see Figure 3.14). Those who responded with “Other” wrote in “our construction division has liaison positions/responsibilities within this field,” “combination of state DOT safety staff and contractor/consultant staff,” and “Rolling Owner Controlled Insurance Program Broker and Carrier.”
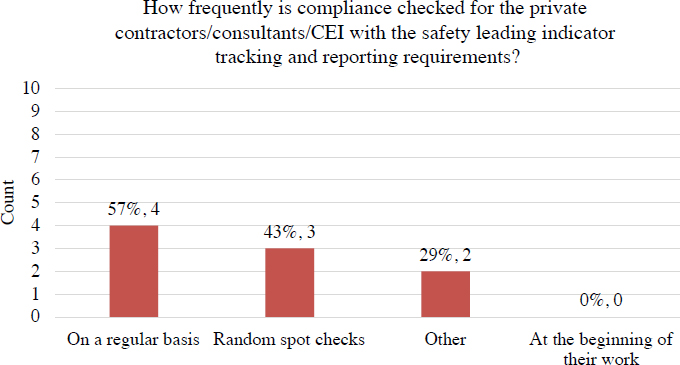
Of the seven state DOTs that pass along safety leading indicator tracking requirements, 4 (57%) respondents reported that compliance is checked on a regular basis, 3 (43%) check compliance randomly, and 2 (29%) noted “Other” in their response (see Figure 3.15). The “Other” write-in responses were “as needed by DOT; more frequently by other staff” and “as needed.”
3.3.2 Documentation of Safety Leading Indicators
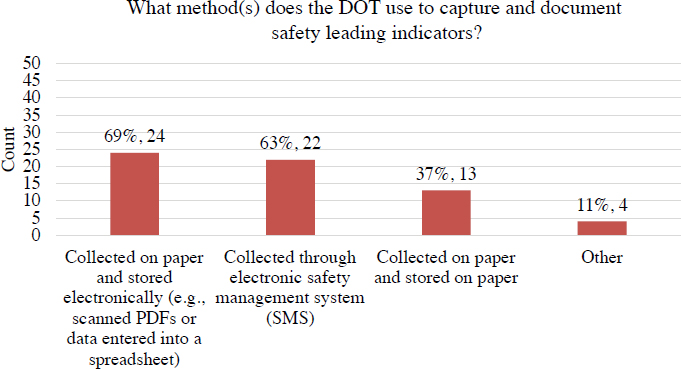
Continuing with implementation, the 35 state DOTs that document safety leading indicators were asked what method(s) they use to capture and document those leading indicators. Figure 3.16 shows that 24 (69%) collect safety leading indicator data on paper and store it electronically (e.g., scanned PDFs or data entered into a spreadsheet). Twenty-two (63%) collect the data through an electronic safety management system (SMS). Thirteen (37%) collect the data on paper and store it on paper. Four (11%) noted a different method by selecting “Other.” The write-in responses were “Adobe Captivate and People Soft Learning Management System,” “combination of different platforms for training, fleet, and safety systems,” “power BI,” and an “old in-house built safety system that was designed in 1993.”
3.3.3 Actions from Safety Leading Indicators
State DOTs were asked how captured data is used (see Figure 3.17). Twenty (57%) of the 35 responding state DOTs use the data for short-term trend analysis (i.e., quarter-to-quarter trends). Another 20 (57%) of the responding state DOTs use the data for long-term trends (i.e., year-to-year
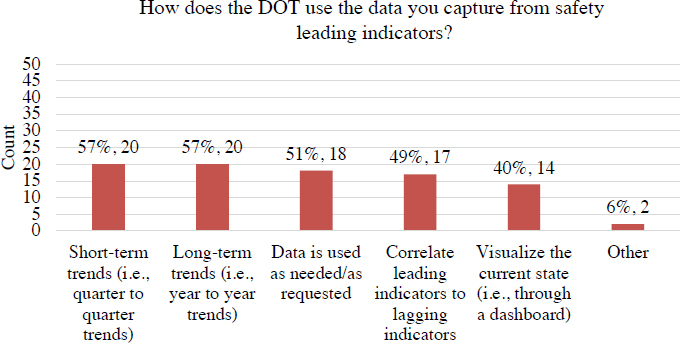
trends). Eighteen (51%) use the data as needed or as requested. Seventeen (49%) correlate leading indicators to lagging indicators, and 14 (40%) visualize the current state of the leading indicators (i.e., through a dashboard). Two (6%) respectively wrote in “working toward development of safety index that is predictive of risk event (injury, crash, property damage, etc.)” and “depends on the type of leading indicator as we are currently transitioning how we capture all of these electronically.”
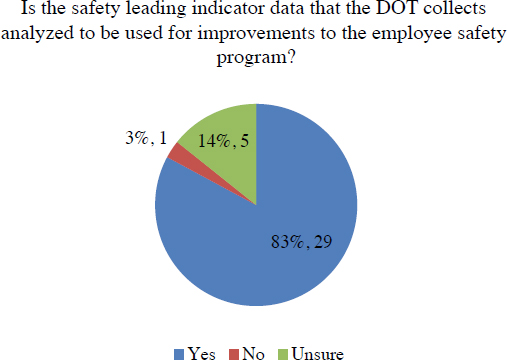
Beyond specific use cases, state DOTs were asked whether the safety leading indicator data they collected is used to improve the employee safety program. Twenty-nine (83%) of the 35 responding state DOTs reported that they do, 1 (3%) reported they do not, and 5 (14%) were unsure (see Figure 3.18).
3.3.4 Implementation Strategies
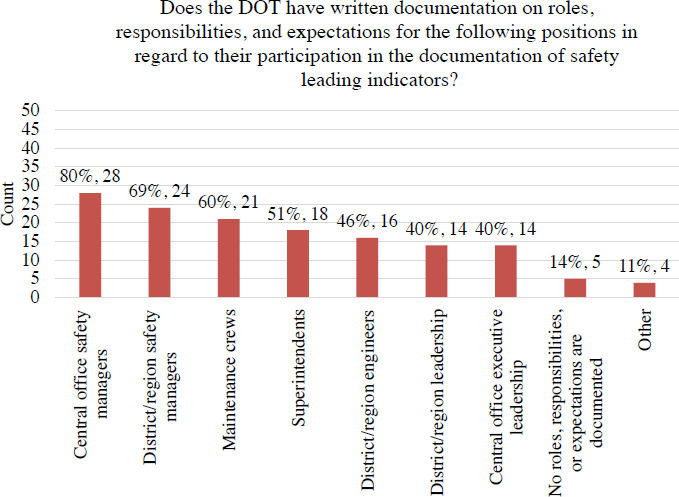
Regarding personnel involvement, survey respondents were asked if the state DOT has written documentation of roles, responsibilities, and expectations for specific positions related to documenting safety leading indicators. Figure 3.19 displays the results of that question. The most frequently noted positions were central office safety managers (28 of 35, 80%), district/region safety managers (24 of 35, 69%), and maintenance crews (21 of 35, 60%). Five (14%) of the 35 responding state DOTs did not have roles, responsibilities, or expectations documented for employees. Four (11%) wrote in positions such as “supervisors.”
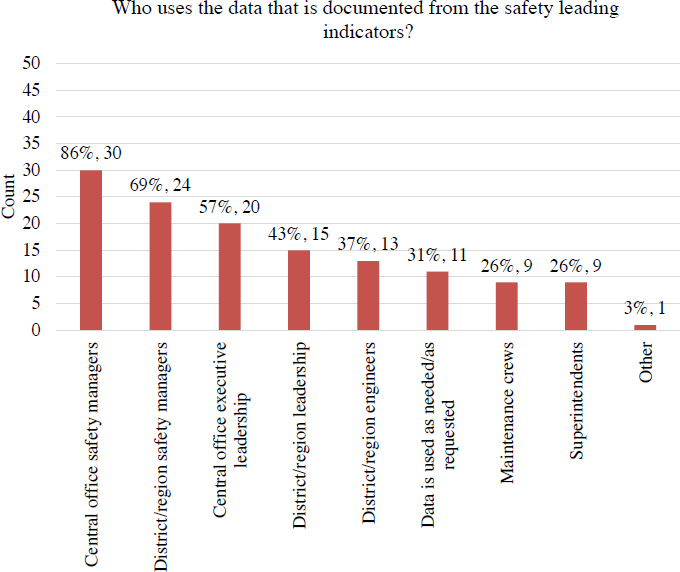
Using the same general position descriptions, survey respondents were asked who uses the data captured from the safety leading indicator program. Figure 3.20 shows that the most frequently noted positions were central office safety managers (30 of 35, 86%), district/region safety managers (24 of 35, 69%), and central office executive leadership (20 of 35, 57%). One state DOT noted that “Division Directors” use safety leading indicator data in an “Other” response.
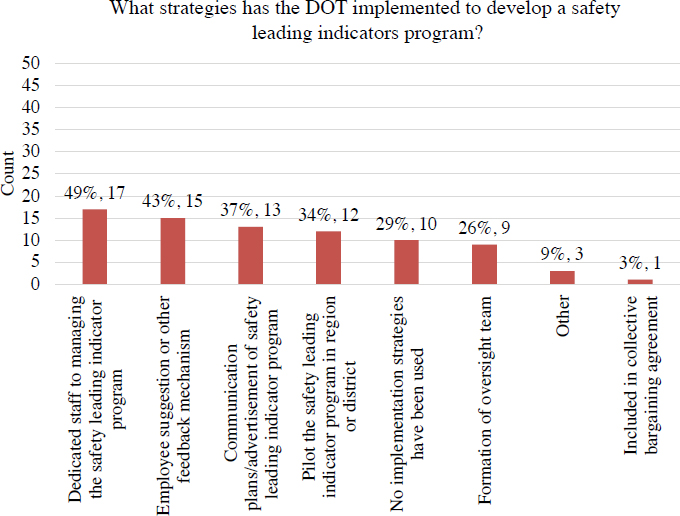
Regarding specific implementation strategies, Figure 3.21 documents strategies that the state DOTs have utilized in their execution of their safety leading indicator programs. The most frequently noted strategies were having a dedicated staff to manage the safety leading indicator program (17 of 35, 49%), employee suggestion or other feedback mechanism (15 of 35, 43%), and communication or advertisements of the safety leading indicator program (13 of 35, 37%). Ten (29%) of 35 state DOTs noted that no implementation strategies have been used, while 3 (9%) wrote in an “Other” response.
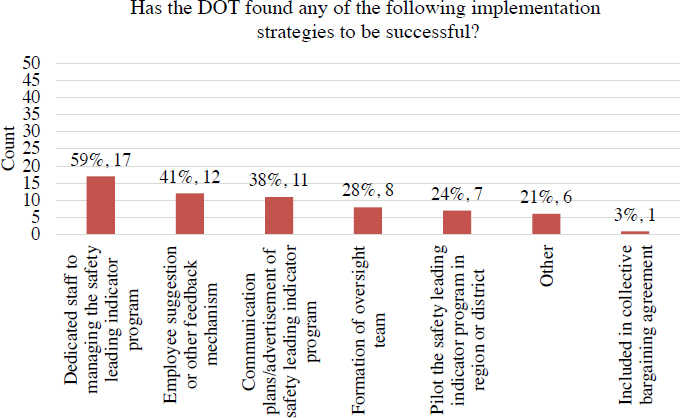
After collecting the implementation strategies utilized, the survey then asked which were particularly successful in the execution of a safety leading indicator program. Regarding frequency of response, the most successful implementation strategies were dedicated staff to manage the safety leading indicator program (17 of 29, 59%), employee suggestion or other feedback mechanism (12 of 29, 41%), and communication or advertisement of the safety leading indicator program (11 of 29, 38%) (see Figure 3.22).
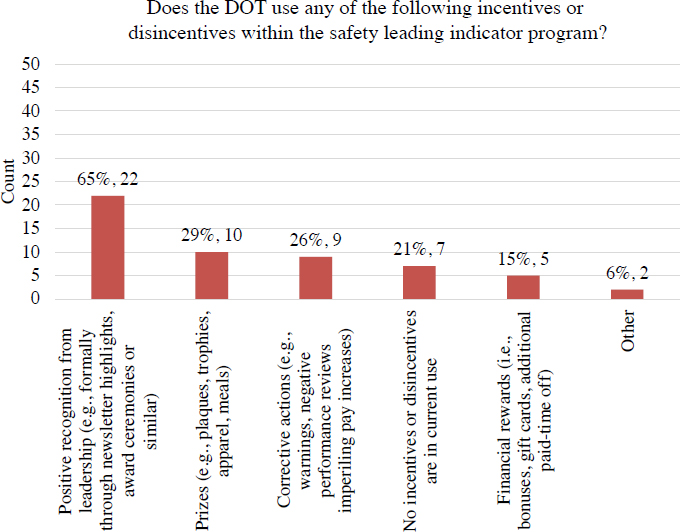
Incentives and disincentives are often used in occupational safety programs to encourage desired actions and behaviors and discourage unwanted behaviors, respectively. State DOTs were asked what incentives and disincentives they use in the safety leading indicator program. Figure 3.23 shows that 22 (65%) of 34 state DOTs use positive recognition from leadership in the safety leading indicator program. Positive recognition might be formal recognition in newsletters and award ceremonies or informal verbal accolades. Ten (29%) of the 34 responding state DOTs noted that they use prizes such as plaques, trophies, apparel, or meals. Nine (26%) use corrective actions such as warnings, negative performance reviews that can impact pay increases, or furloughs/suspensions. Seven (21%) of responding state DOTs do not use incentives or disincentives. Two (6%) wrote in “employee performance plans” and “every 6 months employees who are incident free get a reward choice” as “Other” options.
3.3.5 Implementation Challenges
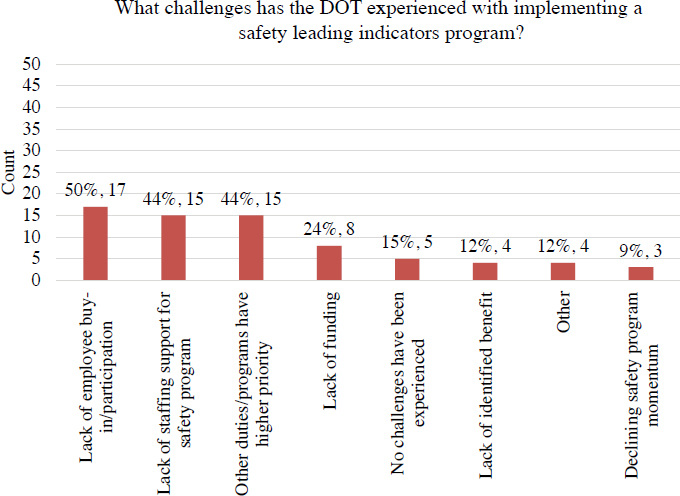
With change come inevitable challenges. Survey respondents were asked about specific implementation challenges they experienced with their safety leading indicator programs (see Figure 3.24).
Seventeen (50%) of 34 responding state DOTs noted it was difficult to get employee buy-in and participation, while 15 (44%) noted that they had insufficient staff to support the program and that other duties or programs have higher priority. Eight (24%) mentioned a lack of funding, while 5 (15%) did not experience challenges. Four (12%) state DOTs wrote in an “Other” response: “unable to give bonuses due to state laws,” “leading indicators is a new concept,” “still building a program,” and “leadership buy-in lacking and safety officers who lack understanding of leading indicators.”
3.3.6 Benefits of Safety Leading Indicators
Several potential benefits result from the use of safety leading indicators, as described in Chapter 2. Figure 3.25 displays the most frequently noted benefits from state DOTs’ use of safety
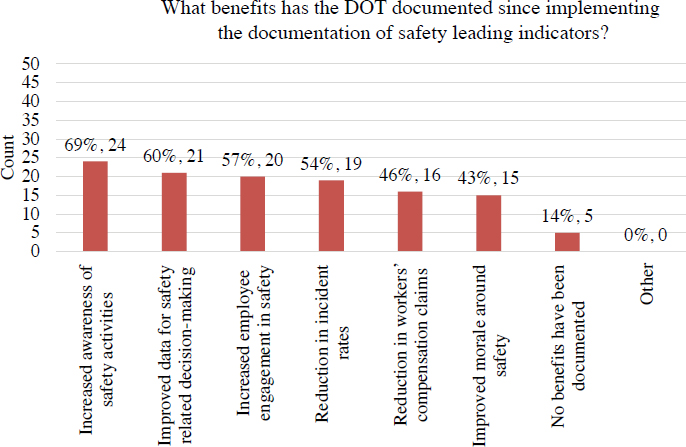
leading indicators: increased awareness of safety activities (24 of 35 state DOTs, 69%), improved data for safety-related decision-making (21 of 35 state DOTs, 60%), and increased employee engagement in safety (20 of 35 state DOTs, 57%).
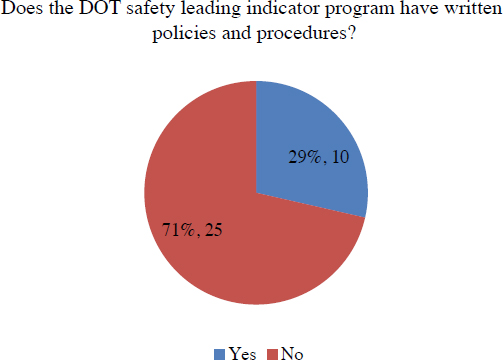
3.4 Written Policies and Procedures
The last section of the survey for state DOTs that documents safety leading indicators concerned the existence of written policies and procedures for safety leading indicators. Figure 3.26 shows that 25 (71%) of the 35 responding state DOTs do not have any written policies or procedures about the leading indicators that are documented, while 10 (29%) of the 35 responding state DOTs have documentation on procedures. The 10 survey respondents that noted the existence of policies were asked to upload any documentation that they could provide. Three state DOTs (Colorado, Hawaii, and Washington State) provided relevant documentation. Those file uploads are provided in Appendix D.
3.5 State DOTs not Currently Documenting Safety Leading Indicators
Recognizing that not all state DOTs have a safety leading indicator program, the survey branched to allow those that reported they did not have a program (see Figure 3.8) to provide some feedback to inform this report. Eight responding state DOTs reported they do not currently document safety leading indicators within their employee safety programs.
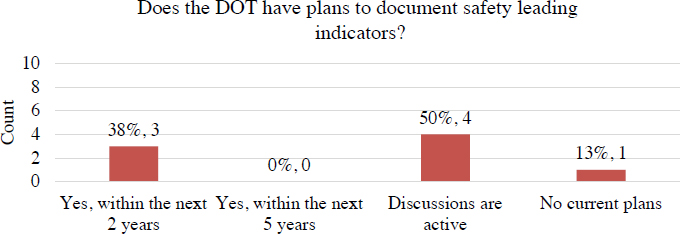
3.5.1 Future Plans with Safety Leading Indicators
For the eight state DOTs that do not document safety leading indicators, Figure 3.27 shows the results of a question about potential future plans for safety leading indicators. Three (38%) of the eight survey respondents reported that they have plans to start documenting safety leading indicators within the next 2 years, 4 (50%) of the eight responses noted that discussions are active, and 1 (13%) state DOT noted that there were no current plans.
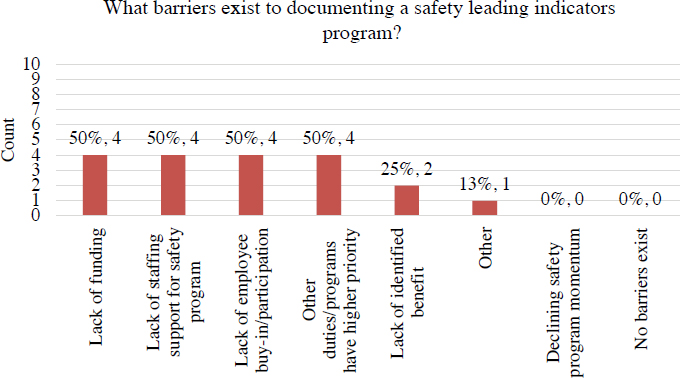
3.5.2 Barriers to Use of Safety Leading Indicators
For the DOTs that do not currently document safety leading indicators, the survey sought to understand what barriers exist. Figure 3.28 shows that half of those state DOTs (4 out of 8, 50%) reported that lack of funding, lack of staffing support, lack of employee buy-in/participation, and other duties/programs have higher priority as the most frequently noted barriers. Two (25%) of the eight responding state DOTs noted that there is no benefit to document safety leading indicators. One (13%) state DOT wrote in that they “need to find the right leading indicator to track” as a barrier that they have experienced.
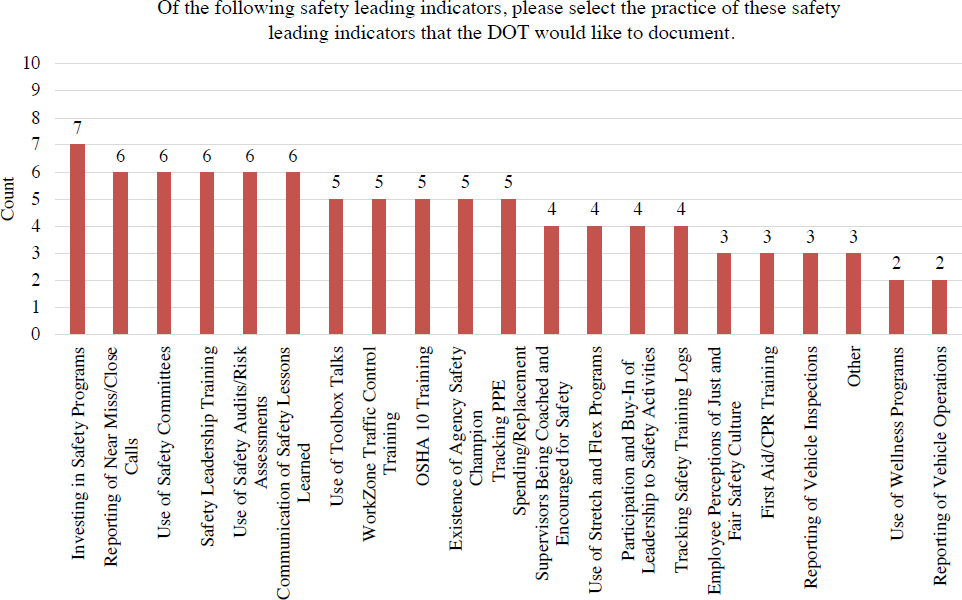
3.5.3 Desired Specific Types of Safety Leading Indicators
Using the same list of safety leading indicators from Table 2.1, survey respondents were asked which they would like to document, given that this group of respondents does not currently document safety leading indicators. Of the eight responding state DOTs, no leading indicator received a vote from all respondents. Investing in safety programs received the most responses (7 out of 8), while reporting of near-miss/close calls, use of safety committees, safety leadership training, use of safety audits/risk assessments, and communication of safety lessons learned received 6 out of 8 responses (see Figure 3.29).