Implementation of Federal Highway Administration Proven Safety Countermeasures (2025)
Chapter: 2 Literature Review
CHAPTER 2
Literature Review
This chapter presents the results of the literature review for FHWA PSCs. Sources compiled for the literature review include guides, evaluation studies, websites, DOT policies and standards, and other resources. Various methods were used to search for and select resources, such as reviewing FHWA websites, using the Transportation Research Board’s Transport Research International Documentation (TRID) database (https://trid.trb.org/), searching guidance and standards by state DOT and PSC, reviewing resources submitted by DOTs through the survey, and identifying the DOT resources relevant to each FHWA PSC.
The chapter is organized into the following sections: FHWA and NCHRP Resources for PSCs, State Strategic Highway Safety Plans (SHSPs), State DOT Highway Safety Improvement Program (HSIP) reports, and Evaluations and State DOT Resources for PSCs. Tabular summaries of literature and guidance for PSCs are provided in Appendix D, which may be found on the National Academies Press website (nap.nationalacademies.org) by searching for NCHRP Synthesis 639: Implementation of Federal Highway Administration Proven Safety Countermeasures and then looking under “Resources at a Glance.”
FHWA and NCHRP Resources for PSCs
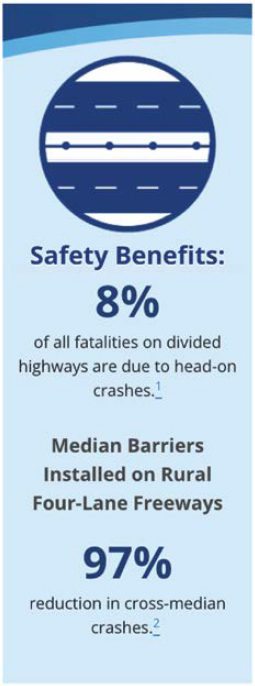
FHWA provides a webpage (https://highways.dot.gov/safety/proven-safety-countermeasures) with information about the 28 PSCs (FHWA 2024a). The PSCs are organized on the webpage into five categories: speed management, pedestrian/bicyclist, roadway departure, intersections, and crosscutting. The webpage includes links to informational pages for each PSC. Each PSC webpage and corresponding factsheet includes resources and related materials to support agency implementation. These information pages provide information such as a general overview of the PSC, safety benefits, links to crash modification factors (CMFs) in the CMF Clearinghouse (FHWA 2024b), and other related links. FHWA also presents the same information on FHWA PSCs in booklet format, with a page for each PSC (Albee and Bobitz 2021). For example, the information page for median barriers indicates that the installation of median barriers on rural four-lane freeways is associated with a 97% reduction in cross-median crashes (Albee and Bobitz 2021). Figure 1 is an excerpt from this page [where superscript 1 refers to the Fatality Analysis Reporting System and superscript 2 refers to NCHRP Report 794: Median Cross-Section Design for Rural Divided Highways (Graham et al. 2014)]. The booklet is available online (https://highways.dot.gov/sites/fhwa.dot.gov/files/Proven%20Safety%20Countermeasures%20Booklet_0.pdf).
In addition, guidance is available from FHWA and NCHRP on many PSCs, as shown in Table 3. In 2023, FHWA published guidance documents on appropriate speed limits for all users, speed safety cameras (SSCs), and lighting (FHWA 2023b, 2024c; Gibbons et al. 2023). In addition,
Table 3. Example FHWA and NCHRP guidance available for PSCs.
| PSC | Resource Title | Web Link | Reference |
|---|---|---|---|
| Corridor Access Management | Safety Evaluation of Access Management Policies and Techniques | https://www.fhwa.dot.gov/publications/research/safety/14057/14057.pdf | Gross et al. 2018 |
| Dedicated Left- and Right-Turn Lanes at Intersections | Safety Effectiveness of Intersection Left- and Right-Turn Lanes | https://highways.dot.gov/media/7116 | Harwood et al. 2002 |
| Reduced Left-Turn Conflict Intersections | Restricted Crossing U-Turn: Informational Guide | https://safety.fhwa.dot.gov/intersection/rltci/fhwasa14070.pdf | Hummer et al. 2014 |
| Roundabouts | NCHRP Report 672: Roundabouts: An Informational Guide | https://nap.nationalacademies.org/catalog/22914/roundabouts-an-informational-guide-second-edition | Rodegerdts et al. 2010 |
| Systemic Application of Multiple Low-Cost Countermeasures at Stop-Controlled Intersections | Proven Safety Countermeasure: Systemic Application of Multiple Low-Cost Countermeasures for Stop-Controlled Intersections | https://safety.fhwa.dot.gov/provencountermeasures/syst_stop_control.cfm | FHWA 2018 |
| Yellow Change Intervals | NCHRP Report 731: Guidelines for Timing Yellow and All-Red Intervals at Signalized Intersections | https://nap.nationalacademies.org/catalog/22700/guidelines-for-timing-yellow-and-all-red-intervals-at-signalized-intersections | McGee et al. 2012 |
| Lighting | FHWA Lighting Handbook | https://highways.dot.gov/sites/fhwa.dot.gov/files/202305/FHWA-Lighting-Handbook_0.pdf | Gibbons et al. 2023 |
| LRSPs | Developing Safety Plans: A Manual for Local Rural Road Owners | https://rosap.ntl.bts.gov/view/dot/41182 | Ceifetz and Anderson 2012 |
| Pavement Friction Management | High Friction Surface Treatment Site Selection and Installation Guide | https://safety.fhwa.dot.gov/roadway_dept/pavement_friction/high_friction/docs/HFST_Guide_HPA.pdf | Merritt et al. 2021 |
| RSAs | FHWA Road Safety Audit Guidelines | https://safety.fhwa.dot.gov/rsa/guidelines/documents/FHWA_SA_06_06.pdf | FHWA 2006 |
guidance on many PSCs, such as crosswalk visibility enhancements, LPIs, PHBs, RRFBs, yellow change intervals, and wider edge lines is included in the 11th edition of the Manual on Uniform Traffic Control Devices for Streets and Highways (MUTCD) (FHWA 2023a).
The U.S. DOT initiated an Allies in Action campaign, which encourages stakeholders to make commitments to specific actions (many of which relate to FHWA PSCs) to move toward eliminating highway fatalities (U.S. DOT n.d.). The Allies in Action webpage (https://www.transportation.gov/nrss/allies-in-action) presents commitments made by government agencies, industry, and other partners. Example commitments from state DOTs are described in Chapter 4 of this synthesis report (Case Examples).
State Strategic Highway Safety Plans
States provide information on safety emphasis areas in their SHSP documents. Many of these emphasis areas correspond to FHWA PSCs. DOTs often include pedestrians and bicyclists as an emphasis area. Other emphasis areas related to the FHWA PSCs include speeding, roadway departure crashes, and intersections. A tabular summary of SHSPs by state is provided in Appendix D, which may be found on the National Academies Press website (nap.nationalacademies.org) by searching for NCHRP Synthesis 639: Implementation of Federal Highway Administration Proven Safety Countermeasures and then looking under “Resources at a Glance.”
State DOT Highway Safety Improvement Program Reports
State DOTs describe various safety-related programs and provide project lists in their HSIP report. A tabular summary of HSIP reports by DOT is provided in Appendix D. Examples of programs related to FHWA PSCs include horizontal curves, intersections, median barriers, pedestrian safety, roadway departure, sign replacement and improvement, lighting, local safety, SafetyEdge, and high friction surface treatment (HFST). Example projects related to FHWA PSCs include installing sidewalks, roundabout construction or modifications, shoulder widening, continuous roadway lighting, adding/modifying auxiliary lanes, HFST, rumble strips, cable barriers, road diets, LRSPs, RSAs, and shared use paths.
Other examples of DOT practices from HSIP reports include the following:
- The Kentucky Transportation Cabinet’s specifically noted systemic treatment focus includes roadway departure corridors, HFST, median barriers, and guardrails (Kentucky Transportation Cabinet 2022a).
- North Carolina DOT established a process to identify curves and segments for updated signing, chevrons, and rumble strips on two-lane rural roads (North Carolina DOT 2022b).
- Ohio DOT revised its speed limit setting practices (including pedestrian and bicyclist considerations and allowing agencies to use 50th percentile speed) (Ohio DOT 2022).
Evaluations and State DOT Resources for PSCs
Various evaluation studies and state DOT resources for PSCs were reviewed, including general resources and resources for each of the 28 FHWA PSCs. This section summarizes the state of the practice for FHWA PSCs and presents these resources, beginning with general resources followed by resources for specific FHWA PSCs.
State DOT General Resources for PSCs
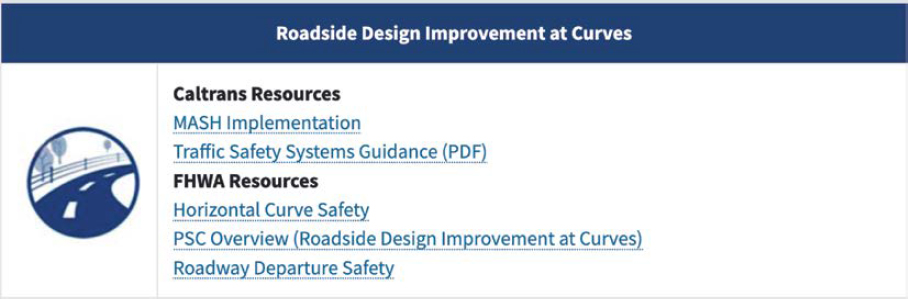
General information on PSCs is available from various state DOTs. For example, the website of the California Department of Transportation (Caltrans) (https://dot.ca.gov/programs/safety-programs/proven-safety-countermeasures/countermeasures) gives an overview of each PSC, including links to resources from Caltrans, FHWA, and other agencies (see Figure 2) (Caltrans 2024a). Florida DOT (https://www.fdot.gov/Safety/safetyengineering/countermeasures) provides a list of most PSCs organized by the most common risk factors for fatal and serious injury crashes
in Florida (lane departures, pedestrians and bicyclists, and intersections), with links to the FHWA informational pages for each PSC (Florida DOT 2022). A memorandum from Virginia DOT discusses eight countermeasures (high visibility signal backplates, flashing yellow arrow, pedestrian crossings, centerline and edgeline rumble strip, curve delineation, unsignalized intersection, and safety wedge installation criteria), with information on implementation and cost for each countermeasure (Virginia DOT 2021). A Safety Countermeasures Community Practice webpage on Ohio DOT’s Local Technical Assistance Program (LTAP) provides opportunities for local agency communities to share knowledge regarding Ohio’s PSCs and includes a database of locations of installed PSCs on local Ohio roadways (Ohio DOT 2020a).
Speed Management
Appropriate Speed Limits for All Users
State DOTs use various approaches to setting and changing speed limits.
- One approach used by state DOTs (e.g., Michigan DOT 2024a; North Carolina DOT 2022a; Oklahoma DOT 2018a) for setting speed limits is based on the 85th percentile speed.
- Iowa DOT allows jurisdictions or individuals to request a change in speed limits (Iowa DOT 2006). Iowa DOT’s review process for a speed zone considers factors such as road type and surface, access points, crash history, pedestrian activity, and a speed study.
- Nebraska DOT indicates in a fact sheet that speed limits may be revised based on factors such as crash history, geometry, sight distance, level of pedestrian activity, and results from a speed study (Nebraska DOT 2021).
- Massachusetts DOT, in its procedures document for speed zoning, presents requirements for conducting a traffic engineering study to create a special speed regulation based on speed and additional factors to enhance safety for all users of the transportation system (Massachusetts DOT 2021b). The Massachusetts DOT procedures document indicates that data on roadway information, speed, and crashes should be collected and analyzed. In addition, safety zones (e.g., parks, playgrounds, senior citizen housing, hospitals, and child care centers) with a speed limit of 20 mph can be established by municipalities in Massachusetts without approval from Massachusetts DOT (Massachusetts DOT 2023a).
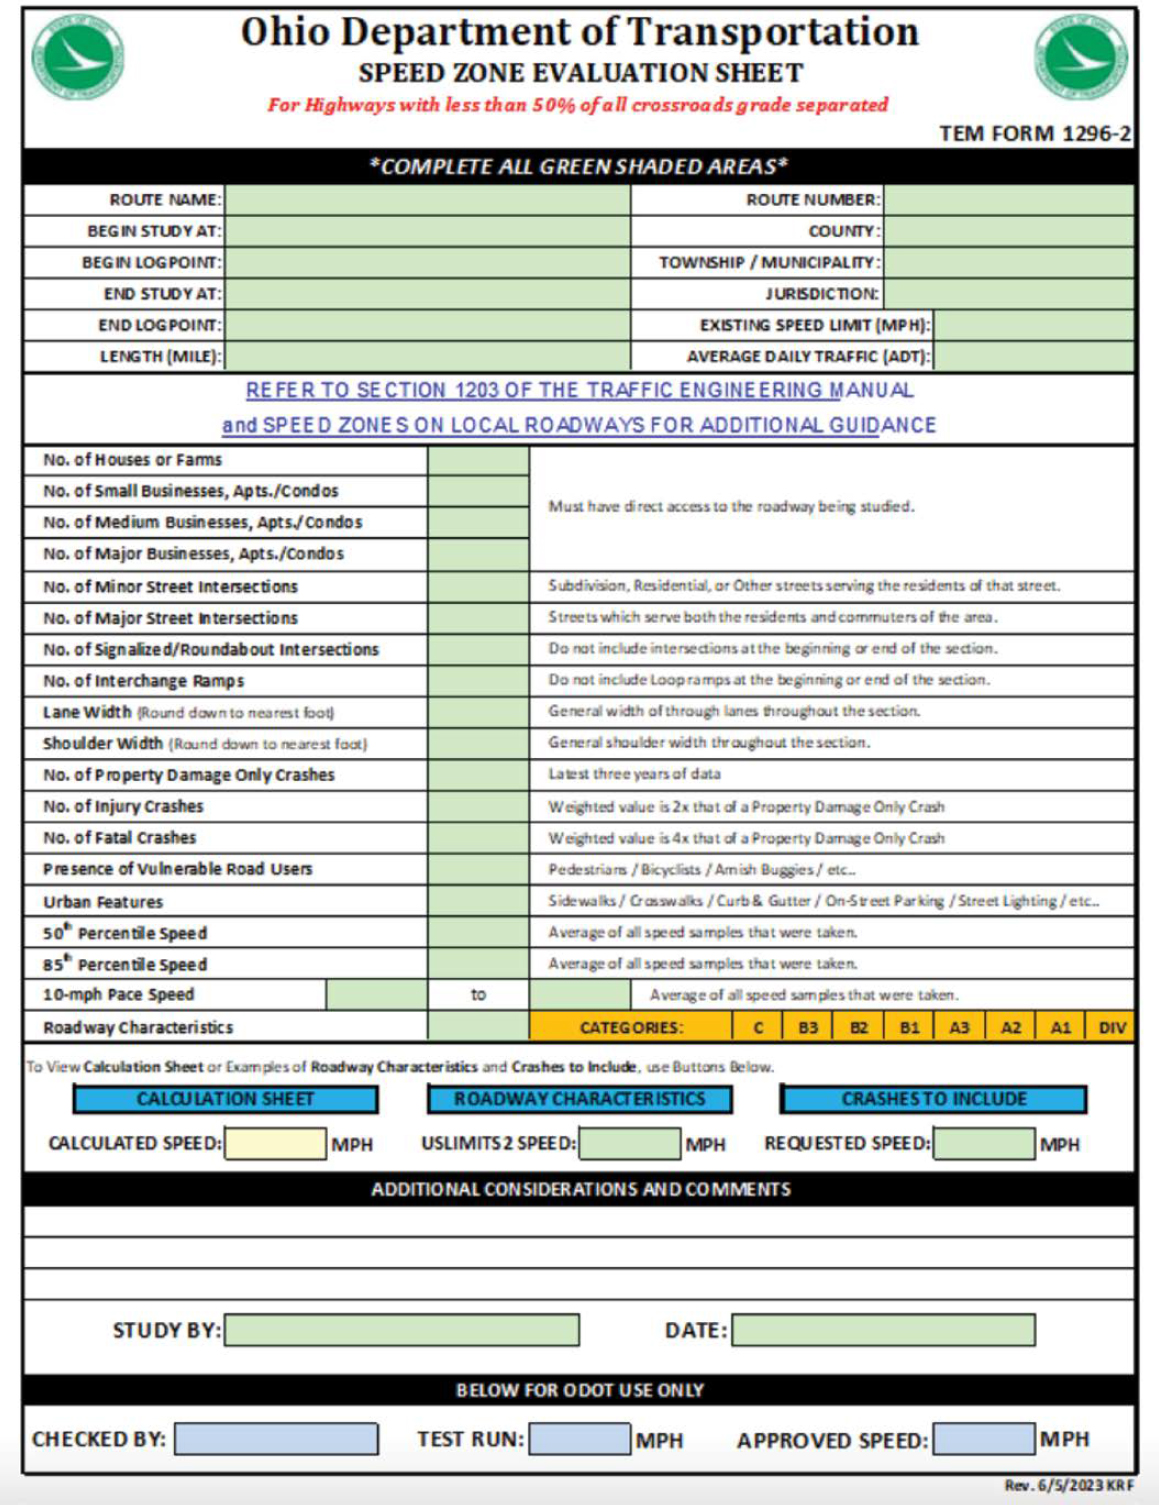
- Ohio DOT considers changes in speed limits based on the review of a speed study that determines the recommended speed limit based on factors such as lane widths, intersection/driveways, crash history, presence of vulnerable road users, 85th and 50th percentile speeds, and USLIMITS2 (Ohio DOT 2024a). An excerpt from Ohio DOT’s speed warrant sheet is shown in Figure 3.
DOTs sometimes encourage or apply other approaches to setting speed limits.
- Colorado DOT has utilized a new approach to setting speed limits that considers additional factors such as roadway purpose and design and the number of pedestrians and bicyclists (State Smart Transportation Initiative 2023). The approach has been used on 50 to 60 miles of road, with lower speed limits as an outcome from approximately two-thirds of conducted studies.
- Florida DOT, in its guidance, suggests careful assessment or reassessment of appropriate posted speed limits to promote safe access for all users (e.g., pedestrians, bicyclists, motorists, transit riders) of transportation facilities (Florida DOT 2017a).
The City of Seattle, Washington experienced a 26% decrease in traffic fatalities after the deployment of speed management strategies such as reducing the speed limit on non-arterial streets to 20 mph and lowering the speed limit on 200 miles of arterial streets to 25 mph (FHWA 2020b). Results from a study based on Montana data indicated that setting the speed limit 5 mph below the 85th percentile speed showed CMF values of 0.44 for total crashes and 0.60 for fatal injury crashes (Gayah et al. 2018).
Speed Safety Cameras
DOT practices for SSCs vary concerning the level of deployment and procedures (e.g., conditions that lead to a citation or warning being issued). Some examples of DOT practices are described as follows:
- Arkansas DOT uses SSCs in Interstate work zones to facilitate enforcement (Arkansas DOT 2023a). The presence of an officer is required to issue a warning or ticket.
- Connecticut DOT’s pilot program for SSCs in work zones includes the deployment of cameras at three locations, with information on current and future locations available online (Connecticut DOT 2023c). Warnings (first offense) or citations (subsequent offenses) are mailed to the registered owners of vehicles that exceed the posted work zone speed limit by 15 mph or more.
- Delaware DOT’s pilot program for SSCs is only being implemented for the work zone on the “Restore the Corridor” project on I-95 in Wilmington (Delaware DOT 2022a). First-time offenders receive a warning. The threshold for issuing a citation is 13 mph over the posted work zone speed limit.
- A list of SSC locations in the District of Columbia is provided online (District of Columbia DOT 2023). Citations for speed violations in the District of Columbia are sent to the registered owner of the vehicle.
- Georgia DOT allows schools to apply for a permit to place SSCs in school zones (Georgia DOT n.d.).
- As per the Illinois Vehicle Code, automated speed enforcement is allowed by Illinois DOT and Illinois State Patrol in work zones and by Chicago DOT in safety zones (Illinois DOT n.d.).
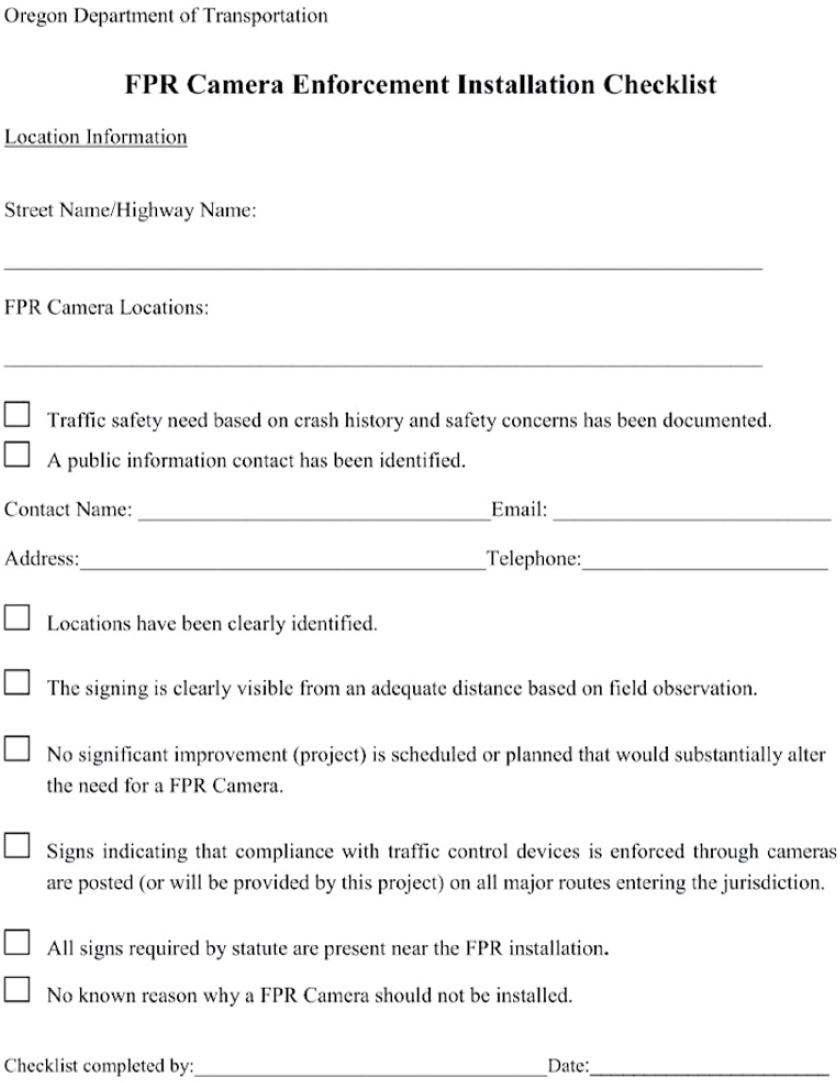
- Oregon state law allows camera installation and operation on State Highways with State Engineer approval (Oregon DOT 2016). The application for the use of SSCs must be accompanied by data supporting the need (Oregon DOT 2016). Oregon DOT’s checklist for SSC installation is shown in Figure 4.
Some states, such as Maine and New Hampshire, have laws that specifically prohibit SSCs, while other states, such as North Dakota and Oklahoma, do not have state laws regarding SSCs (Insurance Institute for Highway Safety 2024).
An evaluation of SSCs using sites in Chicago, Illinois found a 12% reduction in fatal and injury crashes (Tilahun 2023). Results from a study of SSCs on SR 101 in Scottsdale, Arizona indicated total injury crash reductions of 28% to 48% (Shin et al. 2009).
A screenshot from an FHWA outreach video on SSCs in school zones is shown in Figure 5.
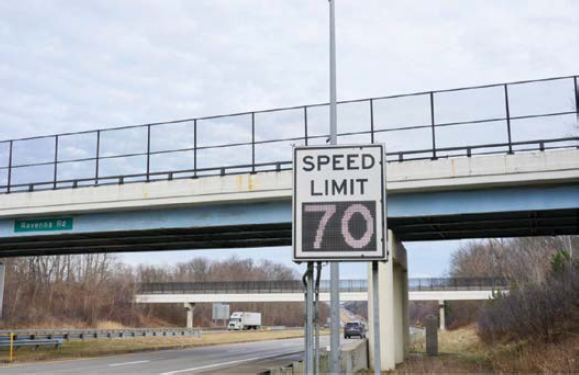
Variable Speed Limits
DOT resources cover various aspects of VSLs, such as types of VSLs, conditions for use, and system design. An example VSL sign is shown in Figure 6. Some other examples include the following:
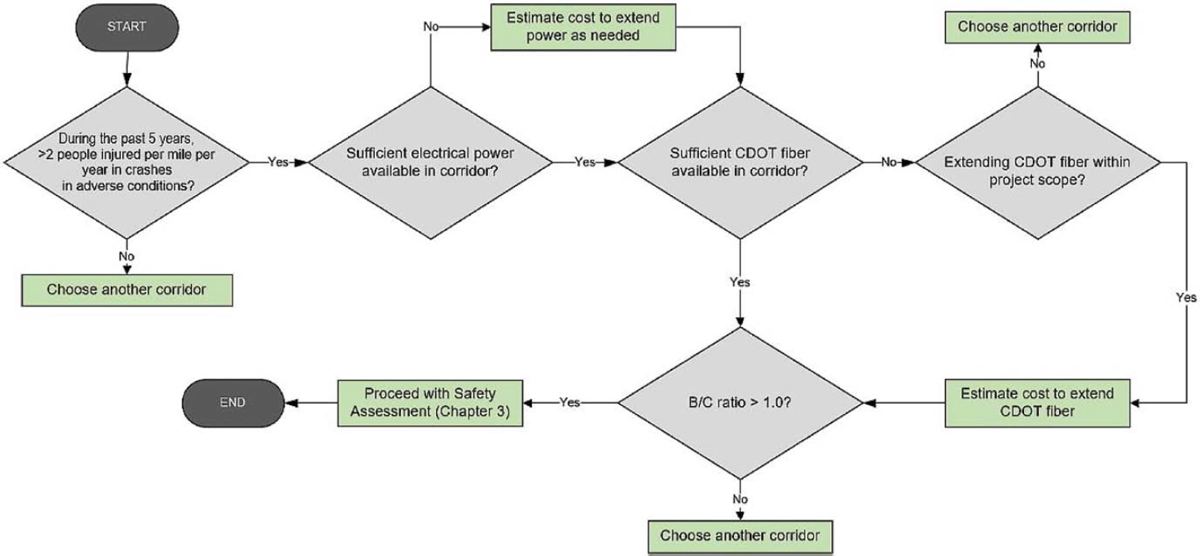
- Colorado DOT provides guidance on various aspects of VSLs, including feasibility studies, safety assessments, algorithms, system design, system configuration and testing, and long-term operations and maintenance (Colorado DOT 2023a). Before a project is scoped, a VSL feasibility workshop must be held. Flowcharts for weather-based VSLs (see Figure 7) and traffic-based VSLs are completed at the VSL feasibility workshop.
- Michigan DOT developed a concept of operations document for Michigan DOT’s Real-Time Warning and VSL program (Cook et al. 2022). Operational scenarios include inclement pavement conditions, inclement weather conditions, high-risk weather events, and motorist trip planning.
- Ohio code effective in November of 2023 indicates that variable speeds may be established on portions of streets or highways based on weather conditions, traffic incidents, congestion, or other factors that affect the safe speed on a street or highway (Rule 5501:2-14-01).
- A webpage from Washington State DOT provides an overview of VSLs, including when to use VSLs, types of VSL systems (e.g., congestion-responsive systems, weather-responsive systems), and implementation needs (Washington State DOT 2022a).
- Missouri DOT ended a pilot program to use VSLs on 35 miles of highway in the St. Louis area because of feedback regarding the lack of perceived benefits and concerns from the public regarding enforcement (Bergal 2018).

A safety evaluation of VSLs found total crash reductions of 34.4% (Wyoming data) and 29.2% (Georgia data) (Avelar et al. 2021). A research study performed in British Columbia found a reduction of 34.4% in winter serious collisions associated with the use of VSLs (El Esawey et al. 2022).
Pedestrian/Bicyclist
Bicycle Lanes
DOTs vary in their guidance regarding where bicycle accommodation may be warranted. Some, such as Arizona DOT, design for dedicated bicycle lanes only when funding is provided by the local agencies and the route is identified in a bicycle facilities plan (Arizona DOT 2022a). Other state DOTs, such as Caltrans, require complete street designs on all projects unless an exception is documented and approved (Caltrans 2022a). Massachusetts DOT’s Highway Division published Engineering Direction E-20-001 in 2020 to help determine where bicycle facilities are required (Massachusetts DOT 2020a). The design directive considers speed, traffic volumes, number of travel lanes, and corridor classifications according to the State’s Bicycle Transportation Plan.
Many states have developed high-level overview documents that describe the types of bicycle facilities available – buffered bicycle lanes, separated bicycle lanes, shared use paths, and shared lanes or bicycle boulevards – as well as selection criteria and facility benefits. Examples include
- Colorado DOT’s Roadway Design Guide, Chapter 12 (Colorado DOT 2023b);
- Iowa DOT’s Design Manual, Chapter 12 (Iowa DOT 2024a);
- Ohio DOT’s Multimodal Design Guide, Section 6 (Ohio DOT 2024b);
- Oregon DOT’s Highway Design Manual, Appendix L (Oregon DOT 2024a); and
- Texas DOT’s TxDOT Bicycle Accommodation Design Guidance (Texas DOT 2021a).
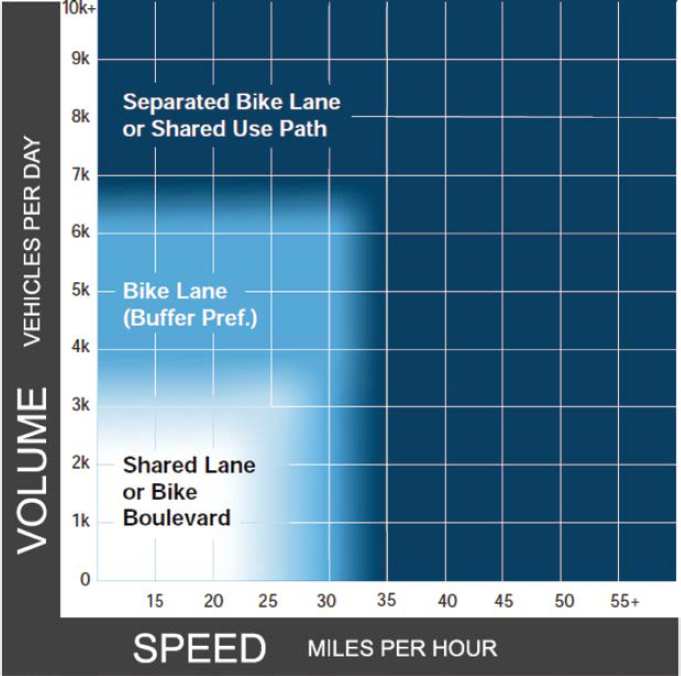
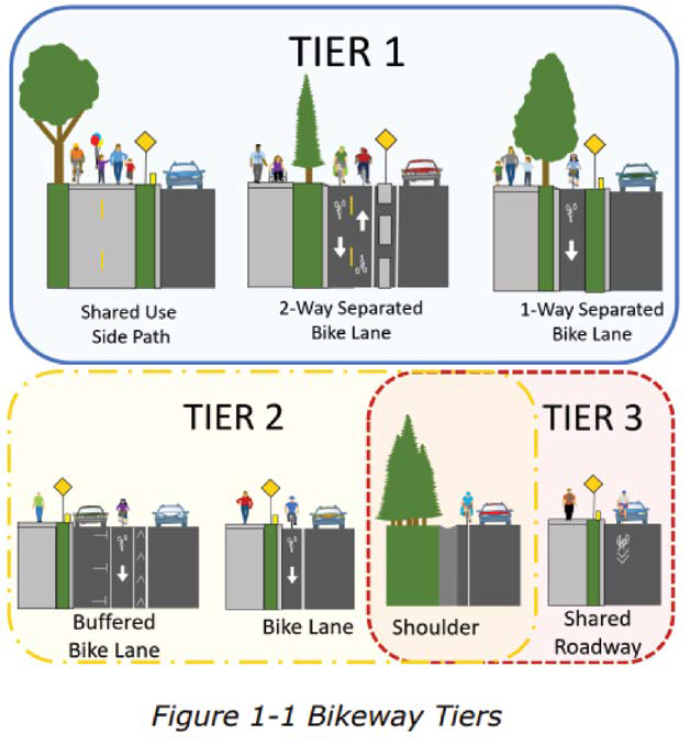
These state DOTs refer to Figure 8, which is from FHWA’s 2019 Bikeway Selection Guide (Schultheiss et al. 2019). Oregon DOT bases its selection process on a tiered approach, as shown in Figure 9, where Tier 1 is most preferred (Oregon DOT 2024a).
In April 2023, North Carolina DOT Research and Development published a study titled Assessment of Separated Bike Lane Applications in North Carolina, which evaluated the impact of separated bicycle lanes across 10 locations in Charlotte and Raleigh, North Carolina (see example in Figure 10) (O’Brien et al. 2023). The study specifically focused on the safety and operational outcomes and found that bicycle lanes reduced the occurrence of avoidance and conflict maneuvers, increased the percent of helmet use and increased the frequency of bicyclists and bikeshare/scooter share in the area. Another study by Bike PGH! performed a before-and-after study along Pennsylvania Avenue in Pittsburgh. The study evaluated 52 months of before data and 52 months of after-bike-lane installation crash data. The results showed that total crashes of all types decreased by 28%, pedestrian crashes decreased by 32%, and aggressive driving instances reduced by 31% (Bike PGH! 2020).
Some state DOTs have developed their own design guidance for the various bicycle facilities. These include District DOT’s 2020 DDOT Bicycle Facility Design Guide (District DOT 2020), Ohio DOT’s 2024 Multimodal Design Guide (Ohio DOT 2024b), and Oregon DOT’s 2024 Bikeway Design Section of their Highway Design Manual (Oregon DOT 2024a), to name a few. These resources document selection criteria, lane width requirements, separation types, buffer width requirements, pavement marking and signing considerations, and intersection treatments. Other state DOTs, such as the Idaho Transportation Department (2013), Nebraska DOT (2022a), and New Mexico DOT (2020) refer designers to AASHTO’s 2012 Guide for the Development of Bicycle Facilities (AASHTO 2012) for complete design details.
Crosswalk Visibility Enhancements
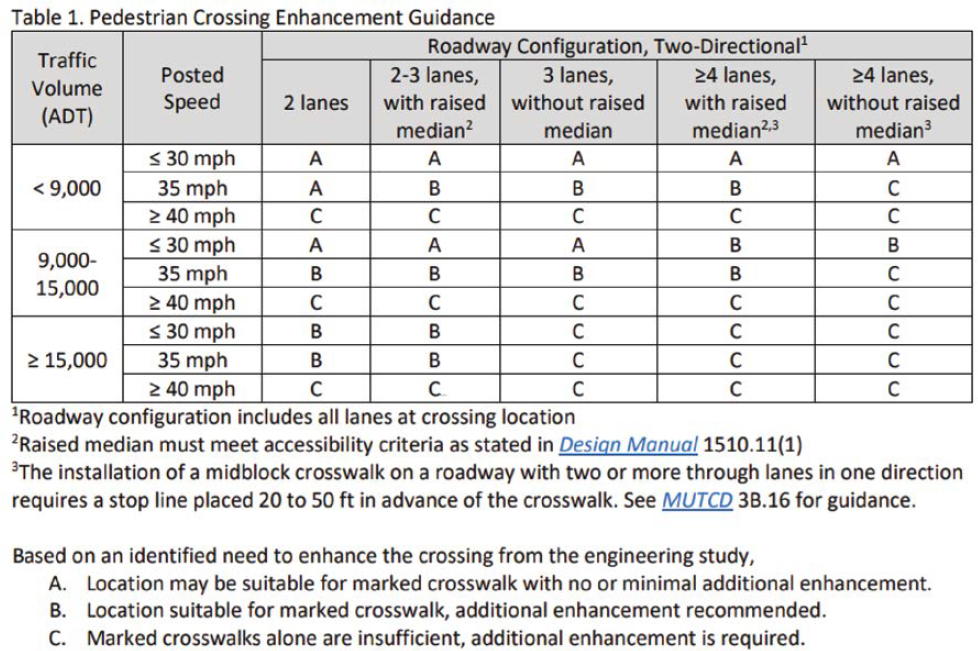
When discussing crosswalk visibility enhancements, many DOTs include this strategy at a high level within a toolbox of other pedestrian safety treatments. These include Hawaii DOT’s 2013 Pedestrian Toolbox (Hawaii DOT 2013), North Carolina DOT’s 2018 Action Plan for Implementing Pedestrian Crossing Countermeasures at Uncontrolled Locations (North Carolina DOT 2018), and South Dakota DOT’s 2020 Safe Travel for Every Pedestrian Decision Guide and Best Practices (South Dakota DOT 2020). These resources commonly recommend the use of high-visibility crosswalk markings at mid-block locations, or where increased pedestrian traffic is expected. Other state DOTs, such as Virginia DOT, require high-visibility markings at specific locations including multilane roundabouts; uncontrolled crossings meeting speed, volume, and lane criteria; and PHB crossings (Virginia DOT n.d.a). Washington State DOT developed pedestrian crossing enhancement guidance that considers volume, speed, and roadway configuration – see Figure 11 (Washington State DOT 2018).
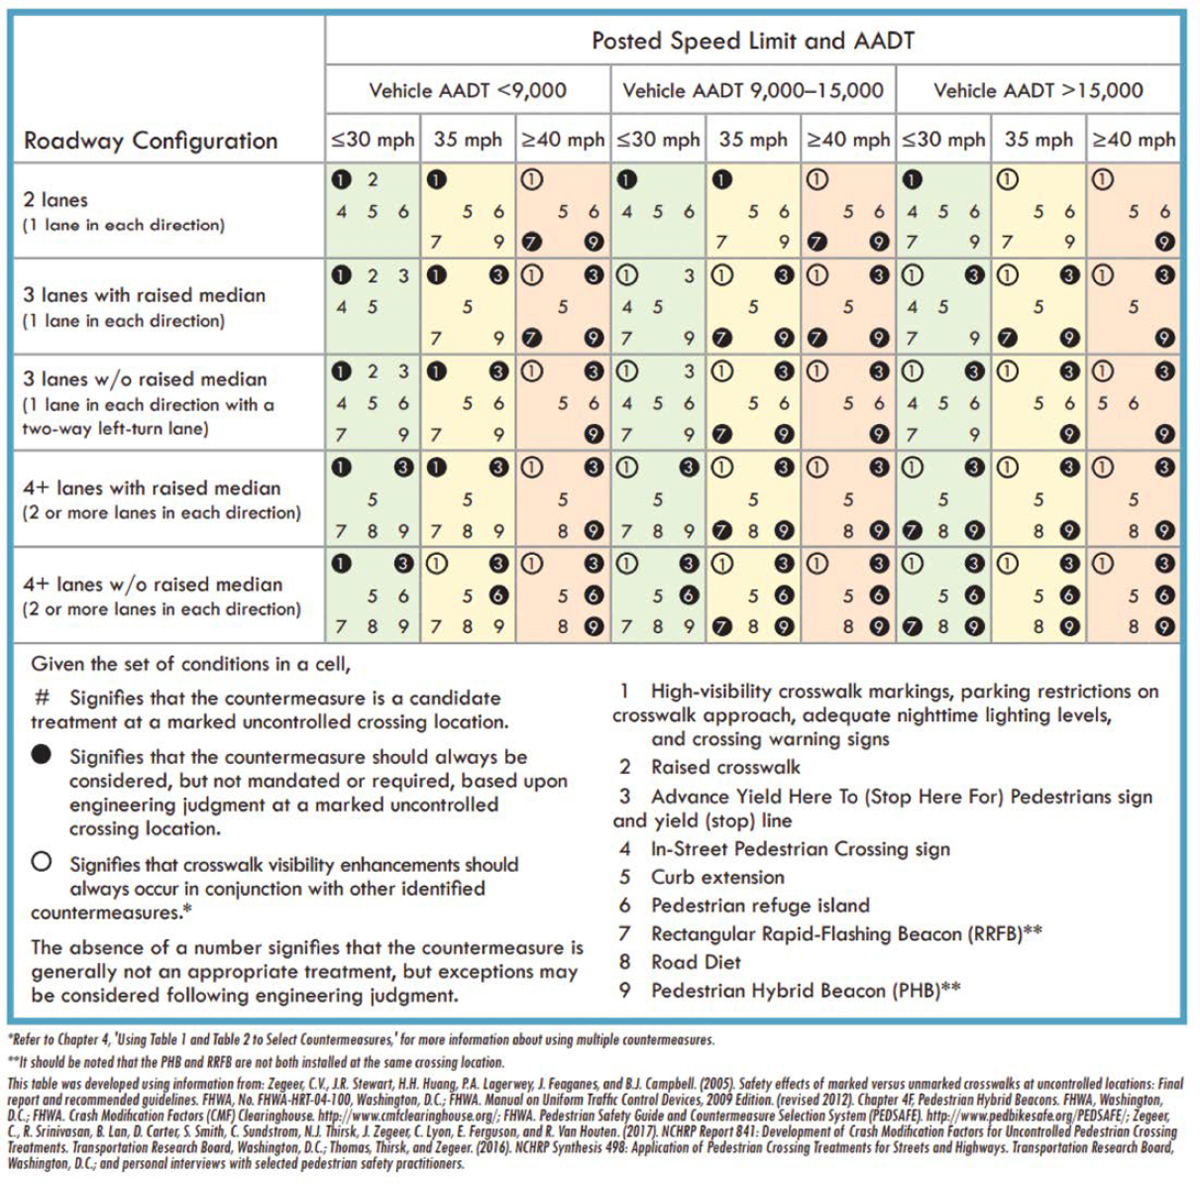
Additionally, DOTs commonly reference the FHWA Safe Transportation for Every Pedestrian (STEP) guide’s Application of Pedestrian Crash Countermeasures by Roadway Feature Table (see Figure 12). These include Arizona DOT (n.d.), North Carolina DOT (2018a), and South Carolina DOT (2021a), to name a few.
In 2013, Michigan DOT installed crosswalk visibility enhancements at 15 locations in southern Michigan. The enhancements included high visibility markings (see an example in Figure 13)
and supplemental signs and were installed at both intersection and midblock locations in locations with speeds less than or equal to 35 mph and annual average daily traffic (AADT) at or below 12,000 vehicles per day. After installation, yielding rates were found to be comparable to if the locations had been upgraded to an RRFB flashing beacon or PHB, increasing from approximately 15% to approximately 75%. Vehicle speeds also dropped between 4 and 10 mph (FHWA n.d.c.).
A study by North Carolina DOT, Yielding Compliance at High Visibility Crosswalks, evaluated concerns about the dilution effect as the number of high visibility crosswalks increases in a community (O’Brien et al. 2022). The study found that driver yielding rates increased by 22% when locations were converted to high visibility and the effectiveness was not negatively impacted as a community’s number of high visibility crosswalks increased to 40% of all locations in a community. The study noted that more research is needed for above 40%, but preliminary findings indicate that dilution should not be a concern (O’Brien et al. 2022).
Some state DOTs such as Michigan DOT (2020), Ohio DOT (2023a), and Texas DOT (2022a) have developed crosswalk standard drawings and specifications. Texas DOT’s standard drawing PM(4)-22A (Crosswalk Pavement Markings), which shows layouts for high-visibility crosswalk markings, may be found at the following link: https://ftp.dot.state.tx.us/pub/txdot-info/cmd/cserve/standard/traffic/pm4-22a.pdf.
Leading Pedestrian Interval
Several state DOTs have published articles or resources that support LPI’s effectiveness at improving pedestrian safety. These include Florida DOT’s 2023 Pedestrian and Bicycle Crash Facts (Florida DOT 2023a), the Kentucky Transportation Cabinet’s 2022 Complete Streets, Roads, and Highway Manual (Kentucky Transportation Cabinet 2022b), and North Carolina DOT’s 2013 WalkBikeNC Design Toolbox (North Carolina DOT 2013).
Other state DOTs, such as Pennsylvania DOT (2021a) have developed LPI implementation guidelines or policies that detail how to analyze intersections to determine if a location could benefit from LPI and how it should be applied. The guidelines consider characteristics such as crash history, pedestrian volumes, vulnerable population, and intersection visibility. Additionally, in 2022, the governor of California approved a bill to require when a state-controlled signalized intersection with crosswalks is replaced or upgraded, it must be programmed with a 3.0- to 7.0-second interval for pedestrians to get a head start (California Legislature 2022).
In 2023, the University of South Florida performed a before-and-after study of LPIs at nine locations across the state. The study found that proper implementation of LPIs reduced the number of vehicle-pedestrian conflicts by 75% and achieved a utilization rate of above 85% at seven of the locations. The study recommended future sites consider using supplemental signage for vehicles, such as “No Turn on Red” or “Turning Vehicles Yield to Pedestrians” (Lin et al. 2023).
Ohio DOT provides design guidance within their Multimodal Design Guide. This includes formulas to calculate the signal timing and characteristics of candidate locations – see Figure 14
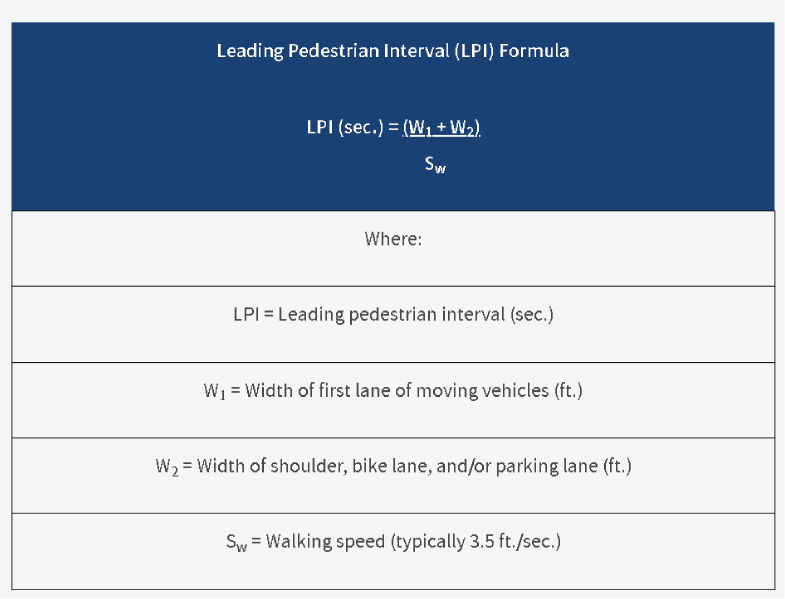
(Ohio DOT 2024b). Arizona DOT recognizes LPIs as a pedestrian safety countermeasure and refers to the MUTCD (FHWA 2023a) for design specifics (Arizona DOT n.d.b.).
Medians and Pedestrian Refuge Islands in Urban and Suburban Areas
Medians and pedestrian refuge islands are commonly supplemented with other pedestrian-focused PSCs such as crosswalk visibility enhancements, RRFBs, or PHBs. State DOTs like Indiana DOT (2013), the Kentucky Transportation Cabinet (n.d.a.), Ohio DOT (2024b), and Washington State DOT (2023) include guidance to help determine where refuge areas may be beneficial. Criteria include speeds, volumes, crossing distance, and surrounding land use.
- Indiana DOT recommends pedestrian refuge islands be provided if the number of lanes to be crossed is greater than three in each direction or the total intersection width is greater than 75 feet (Indiana DOT 2013).
- The Kentucky Transportation Cabinet largely refers to FHWA’s Field Guide for Selecting Countermeasures at Uncontrolled Pedestrian Crossing Locations to determine pedestrian refuge locations (Kentucky Transportation Cabinet 2020e).
- In Ohio DOT’s guidance, crossing islands should be considered where crossing distances are greater than 50 feet (Ohio DOT 2024b).
- Washington State DOT recommends pedestrian refuge islands be provided where crossings meet any of the following conditions: located on a two-way arterial with speeds greater than 35 mph, moderate to high traffic volumes, high pedestrian volumes, significant pedestrian crash history, near a school or other community center, crossing distances exceed 30 feet, or complex or irregularly shaped intersections (Washington State DOT 2023).
DOTs identify minimum dimensions for pedestrian refuge as part of their design manuals and guidelines. Several DOTs mimic Public Right-of-Way Accessibility Guidelines (PROWAG) minimum standards which require at least a 6-foot-wide space with detectable warning surfaces. These include Arizona DOT (2021), South Dakota DOT (2024), New York State DOT (2022a), and Pennsylvania DOT (2024a). Other states have adopted their own stricter standards, including the following:
- Colorado DOT specifies different widths based on location and volumes. Widths range from 4 feet to 10 feet (Colorado DOT 2021).
- Oregon DOT prefers 8-foot width (Oregon DOT 2024a).
- Nevada prefers 14-foot width but will allow a minimum of 6 feet with design variance (Nevada DOT 2017).
State DOTs such as Tennessee DOT (2024), Vermont Agency of Transportation (VTrans) (2022a), and Wyoming DOT (2018) developed standard drawings for pedestrian refuge. Tennessee DOT’s Standard Drawing MM-CR-4 (Pedestrian Refuge) may be found online (https://www.tn.gov/content/dam/tn/tdot/engineering-production-support/documents/standard-drawings/roadway-standard-drawings/current/multimoal/curb-ramps/MMCR4.pdf).
Pedestrian Hybrid Beacons
Many state DOTs require an engineering study to document PHB justification. These include state DOTs such as Colorado DOT (2023b), Maryland DOT (2011), Michigan DOT (2023), Florida DOT (2017b), Texas DOT (2011a), and Wyoming DOT (2014a) which all use MUTCD (FHWA 2023a) guidelines either as a base or direct link. These guidelines consider pedestrian and vehicular volumes, speeds, and crossing distance. See Figure 15, excerpted from Michigan DOT’s 2023 Guidance for Installation of Pedestrian Crosswalks on Michigan State Trunkline Highways (Michigan DOT 2023).
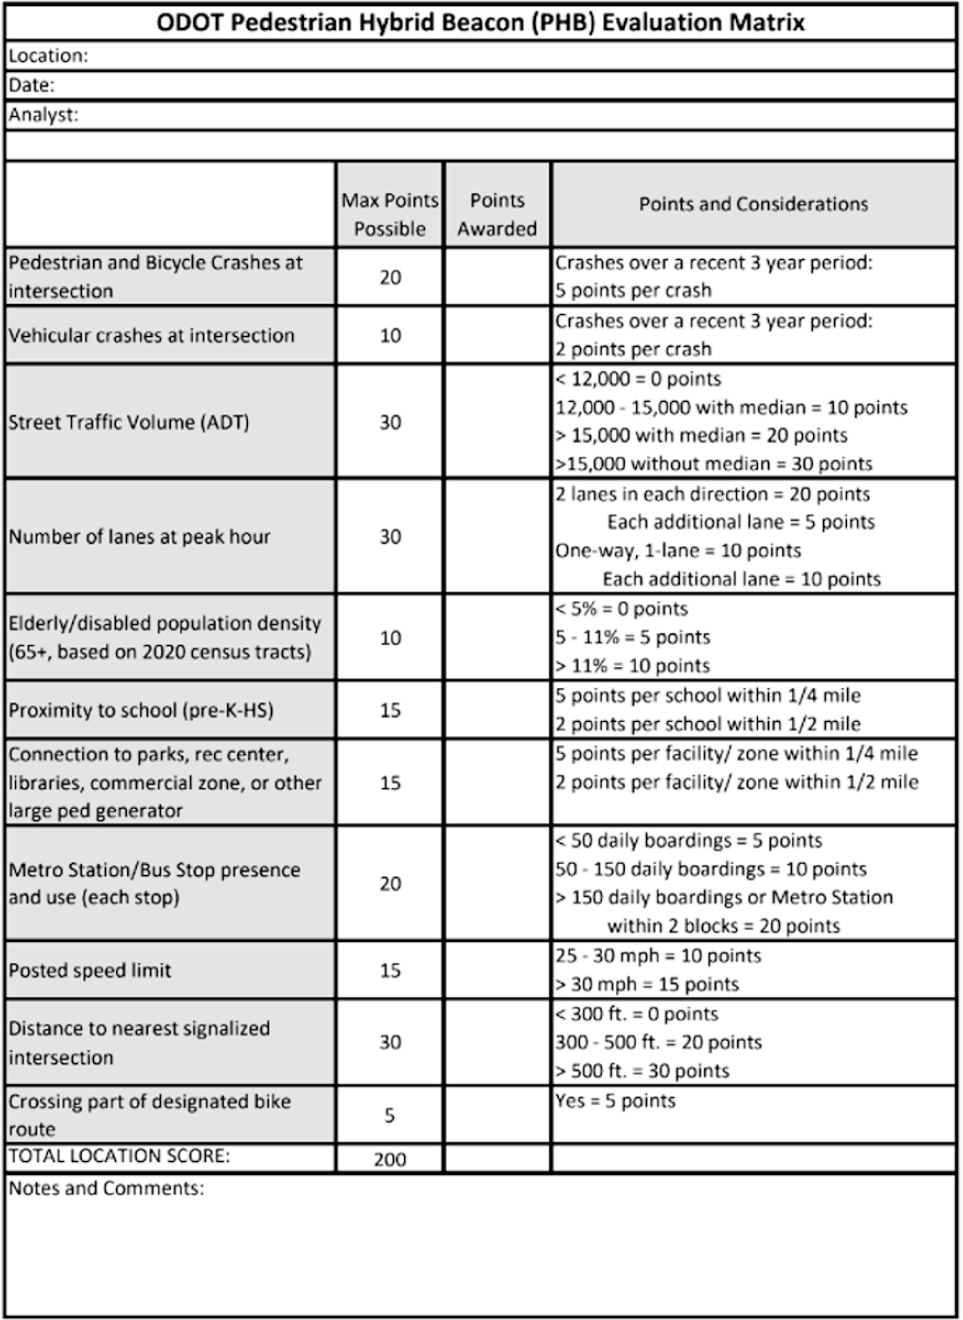
Ohio DOT created an evaluation matrix to evaluate locations under consideration for installation (see Figure 16). The matrix specifies scoring criteria, although scores justifying PHB installation are not publicly available. Ohio DOT’s Traffic Engineering Manual specifies that the completed form should be sent to the Office of Traffic Operations for review and approval (Ohio DOT 2024a). This only applies to locations that will be state owned and maintained.
In 2021, New Jersey DOT published a study that evaluated PHBs in use at 10 locations across the state using video analysis and an online survey (New Jersey DOT 2021). The study found that PHBs are an effective pedestrian safety treatment, but better education is needed regarding the signal phase meanings. Some state DOTs, including Georgia DOT (2018), Montana DOT (n.d.a), and New Hampshire DOT (2024) have published educational material online to help communicate to the public how PHBs function.
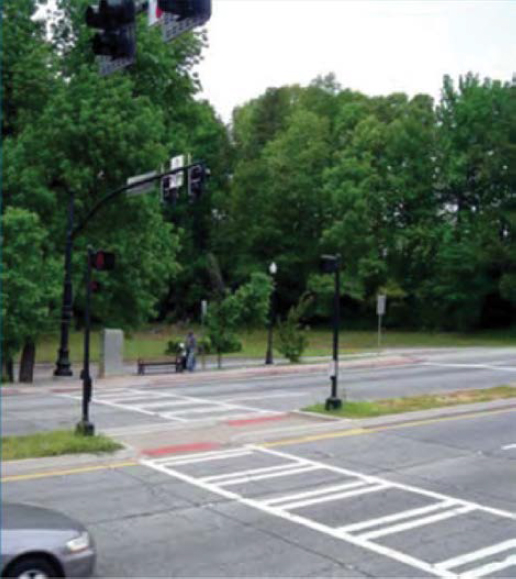
A Georgia case study, presented within FHWA’s Pedestrian Hybrid Beacon Guide – Recommendations and Case Study, reviewed four PHBs installed along Buford Highway, a seven-lane arterial (see example in Figure 17). Each PHB was placed near a transit stop, away from intersecting roads, and supplemented with raised crosswalks. The PHBs resulted in lower vehicular speeds, and ultimately allowed the county and state to lower the speed limit (FHWA 2014c).
Tennessee DOT developed three standard drawings for PHB installations: T-M-4B (Standard Signalized Mid-Block Crossing), T-SG-14 (Pedestrian Hybrid Beacon Detail 2 or 3 Lane Facilities), and T-SG-15 (Pedestrian Hybrid Beacon Detail Multi-Lane Facilities) (Tennessee DOT 2024). These drawings may be found online at the following links:
- https://www.tn.gov/content/dam/tn/tdot/engineering-production-support/documents/standard-drawings/roadway-standard-drawings/current/design-traffic-control/pavement-markings/TM4B.pdf
- https://www.tn.gov/content/dam/tn/tdot/traffic-engineering/2203/TSG14_000000.pdf
- https://www.tn.gov/content/dam/tn/tdot/traffic-engineering/2203/TSG15_000000.pdf
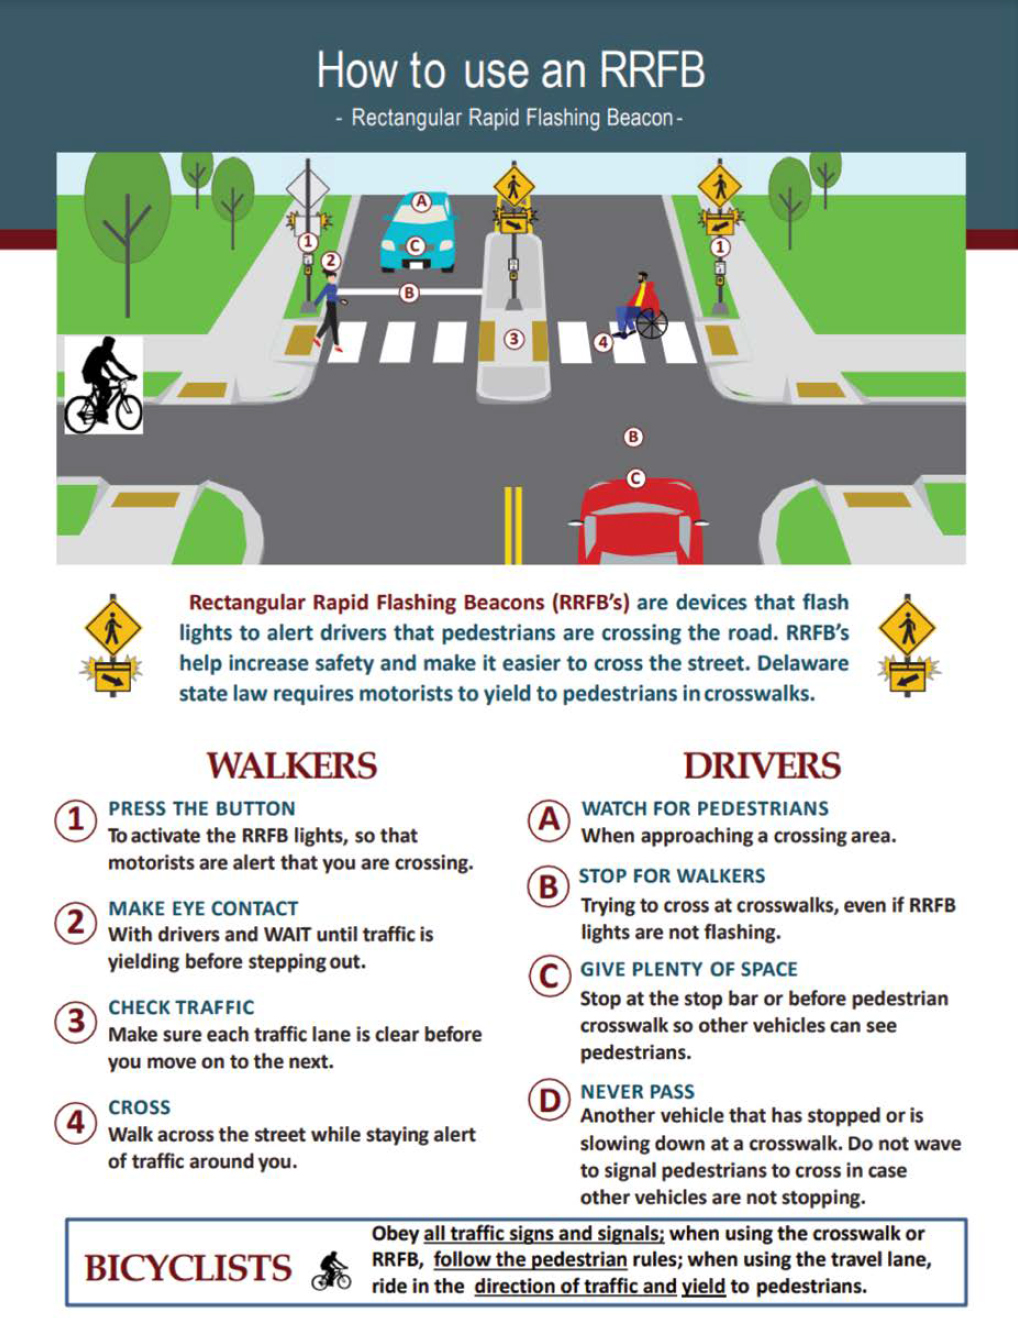
Rectangular Rapid Flashing Beacons
Many state DOTs have recognized conditions that may warrant RRFB installation. For Texas DOT, these conditions include
- Established crosswalk with adequate visibility,
- Posted speed limit of 40 mph or less,
- Pedestrian crossing volumes of at least 20 per hour,
- Location in a high-risk area, and
- The crosswalk is more than 300 feet from an existing traffic-controlled pedestrian crossing (Texas DOT 2018a).
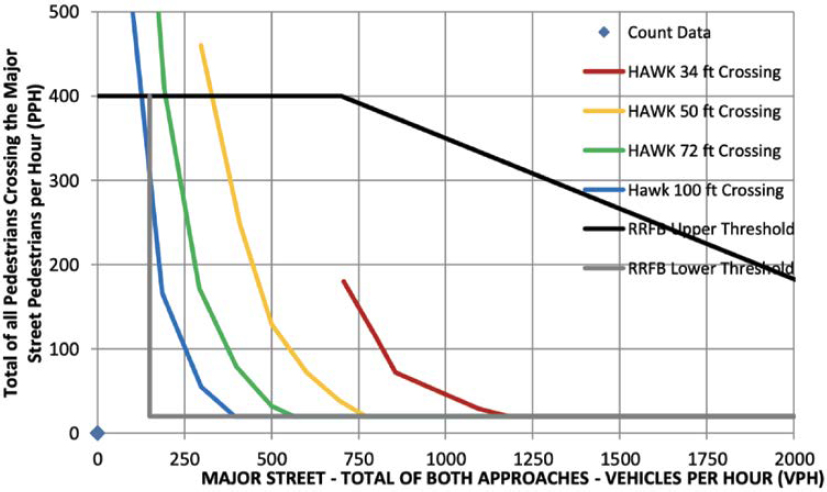
DOTs are mixed in their guidelines regarding whether RRFB may be used at mid-block locations only versus uncontrolled intersection approaches as well. State DOTs like Colorado DOT (2023b) and Tennessee DOT (2020a) recognize RRFB as an effective pedestrian safety countermeasure at mid-block crossings only, citing concerns with conflicts between pedestrians and turning vehicles if located at an intersection. Other state DOTs, like the Idaho Transportation Department (2020), Virginia DOT (n.d.a), Washington State DOT (2018), and Ohio DOT (2024b) recognize use at both mid-block crossings and uncontrolled intersection approaches. Like PHBs, states have developed educational materials to assist the public in better understanding RRFB operations. An example from Delaware DOT (2021) is shown in Figure 18.
A 2012 study by Brewer and Fitzpatrick evaluated RRFB effectiveness by performing a before- and-after study at an RRFB installed near a school crossing in Garland, Texas. The study found that during non-school hours, driver yielding rates at the RRFB increased from less than 1% before installation to nearly 80% after. Yielding rates during school hours stayed relatively similar between the before-and-after periods, largely because of school crossing guard presence (Brewer and Fitzpatrick 2012).
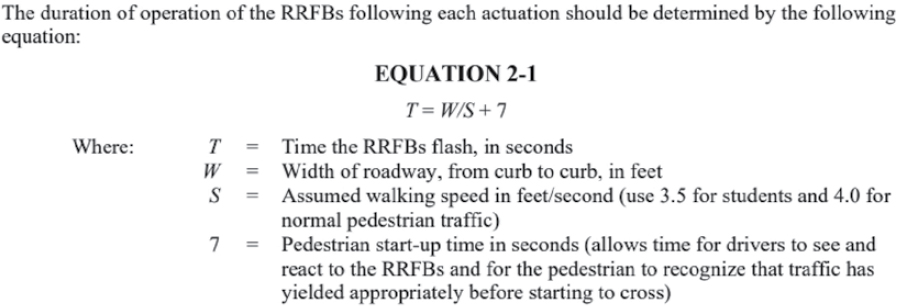
Several DOTs, including the Idaho Transportation Department (2020), Texas DOT (2018a), and Wyoming DOT (2014a), have published guidelines for RRFB flashing sequence and timing, with consideration of those who may be seizure prone. Wyoming also publishes a formula to assist designers in calculating the duration of operation. See Figure 19.
State DOTs with standard construction drawings for RRFB assemblies include, but are not limited to, Ohio DOT (2023d) (Ohio DOT TC-87.10, 2023), Tennessee DOT (2020a) (Tennessee DOT T-M-4A, 2020), VTrans (2022a) (VTrans HSD-678.04, 2022), and Washington State DOT (2018). Some of these drawings detail supplemental signing and pavement marking, while others focus more on specifications for RRFB install.
Road Diets (Roadway Reconfiguration)
Several state DOTs recognize road diets or roadway reconfigurations as an effective safety strategy and publish guidance regarding site characteristics that may warrant roadway reconfiguration through links on their webpages, STEP guides, or Safety toolboxes. These include Arizona DOT’s STEP toolbox (Arizona DOT n.d.a.); the Kentucky Transportation Cabinet’s 2022 Complete Streets, Roads, and Highways Manual (Kentucky Transportation Cabinet 2022b); North Carolina DOT’s 2018 Action Plan for Implementing Pedestrian Crossing Countermeasures at Uncontrolled Locations (North Carolina DOT 2018); North Dakota’s 2019 Active and Public Transportation Facility Planning Best Practices Recommendations (North Dakota DOT 2019), and South Dakota’s 2020 Safe Travel for Every Pedestrian Decision Guide and Best Practices (South Dakota DOT 2020). These state DOTs, and many others, have also published locations where road diets have been completed in their states. Example state DOTs include Arizona DOT (n.d.c.), Delaware DOT (n.d.), Idaho Transportation Department (2017), Iowa DOT (Welch n.d.), Massachusetts DOT (2020b), Minnesota DOT (2024e), and Vermont (VTrans n.d.b.).
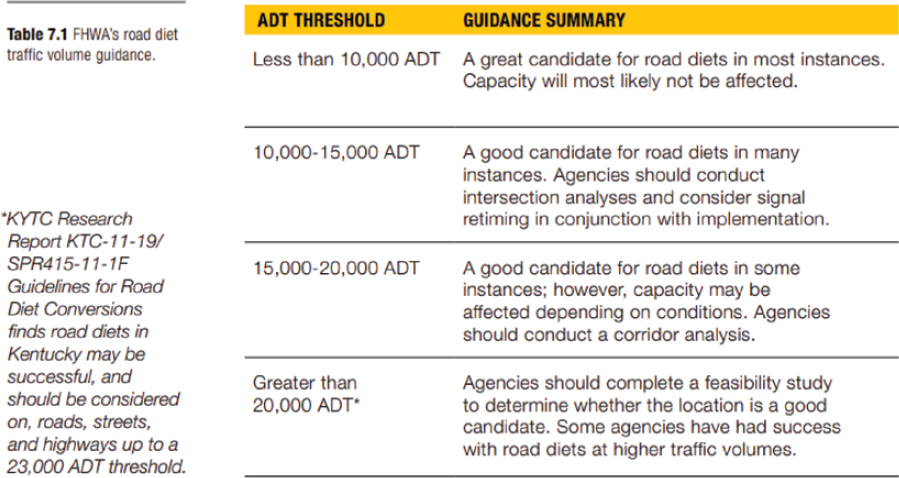
The Kentucky Transportation Cabinet, as well as other state DOTs, use FHWA’s road diet traffic volume guidance as a starting point for considering a road diet. FHWA generally recommends 15,000 average daily traffic (ADT) as a threshold for road diet applicability, while Kentucky has performed state-specific research that suggests a 23,000 ADT threshold is more reasonable on their roadways. The threshold was developed based on simulations that were performed for different scenarios (Stamatiadis et al. 2011). See Figure 20 for excerpt from the Kentucky’s Complete Streets, Roads, and Highways Manual (Kentucky Transportation Cabinet 2022b). Additionally, a 2023 study by the University of Minnesota used traffic simulations to evaluate vehicle delay and motor vehicle speeds on road diet corridors. The study found that guidelines regarding suggested daily traffic volumes can be misleading and should be considered in tandem with other factors such as crossroad traffic volumes and hourly volumes (University of Minnesota 2023).
Pennsylvania DOT recognizes several solutions for roadway reconfigurations as part of Chapter 8 of their Design Manual (Pennsylvania DOT 2024a). The manual also details key site design components that must be considered during the evaluation process. These include sight distance, corridor access management, intersection and driveway design, and bicycle/pedestrian facilities. The guide also highlights operational considerations including speed, level of service, quality of service, ADT, peak hour volumes and turning volumes, on-street parking, impacts on transit and freight, impacts to parallel roads, and the need for public involvement (Pennsylvania DOT 2024a).
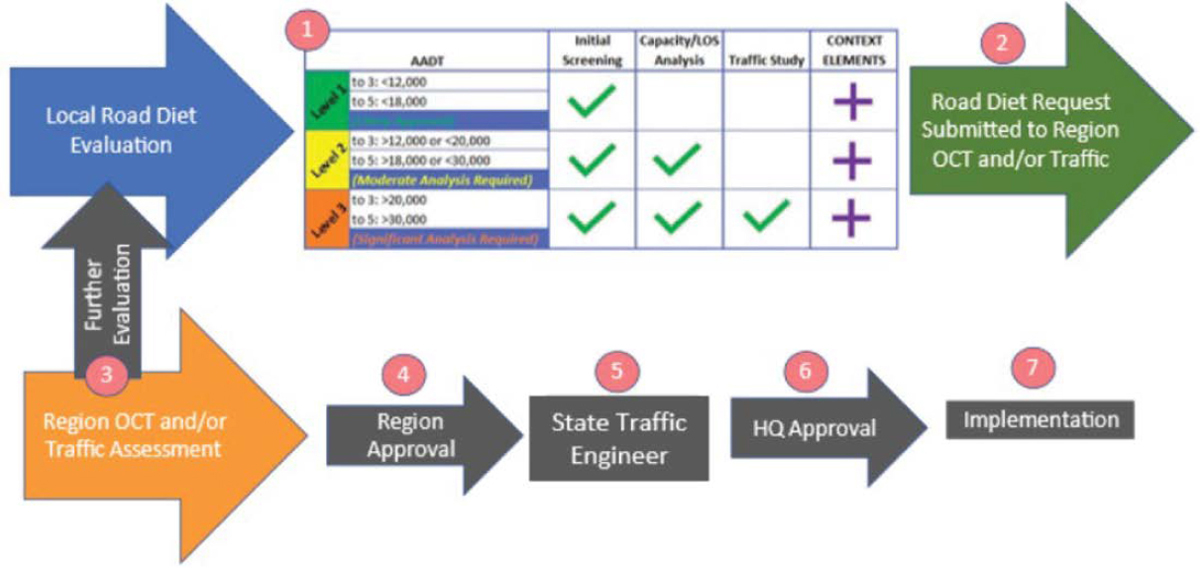
In 2020, Florida DOT published the Lane Repurposing Guidebook, which details the process for local, regional, and state agencies to evaluate and justify lane reallocation on their facilities. It details documentation requirements, key considerations, best practices, and example projects (Florida DOT 2020a). All proposed projects on state-owned roadways must go through a tier of review and approval steps that includes both district and central office approval. Documentation needed for approval must include existing conditions evaluation, concept design, traffic analysis, and safety analysis. In 2023, Tennessee DOT also published a Road Diet Guidance Manual that has similar documentation requirements and approval processes. See Figure 21 for excerpt from Tennessee DOT’s manual (Tennessee DOT 2023a).
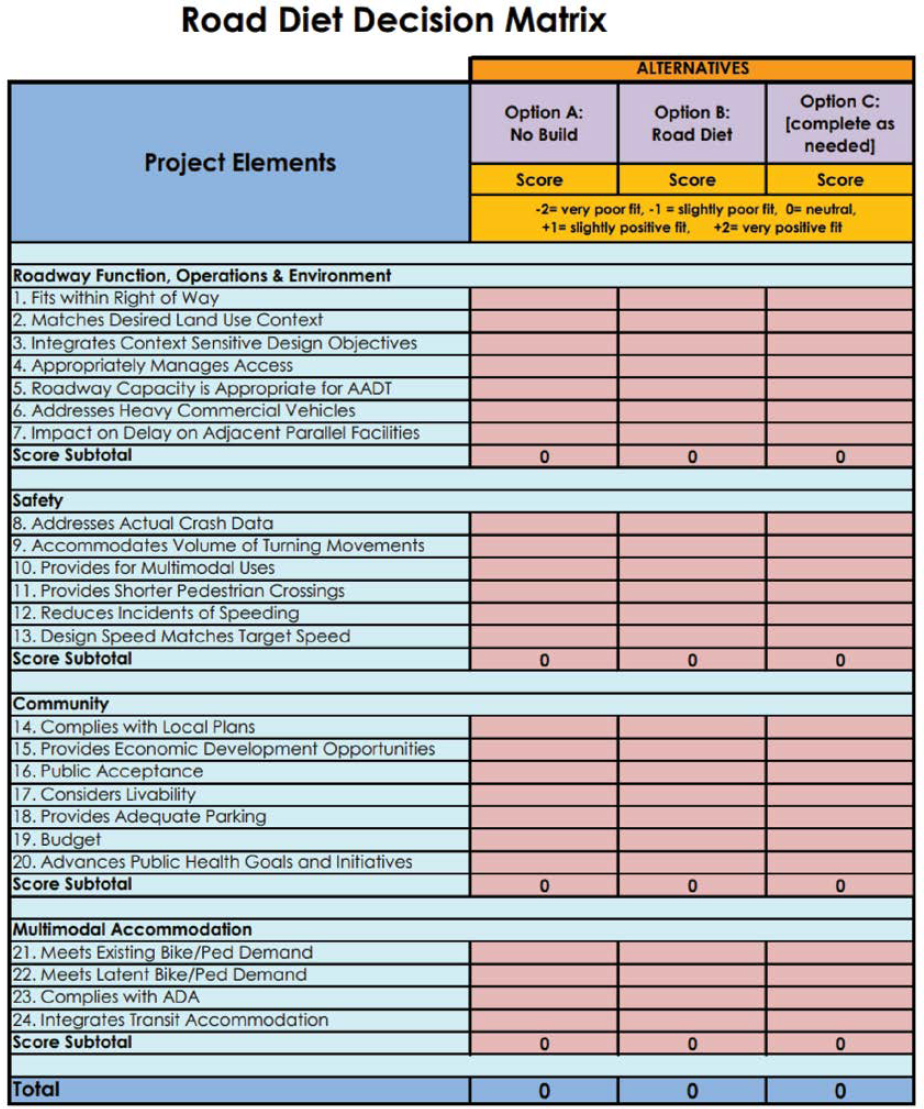
New Mexico DOT developed a Road Diet Decision Matrix that is included in Section 1250 of their Design Manual (New Mexico DOT 2020). See Figure 22.
Walkways
Several DOTs have published guidance that discusses where and when to consider pedestrian and bicycle facilities. In Arizona, the need for walkways is to be assessed for all major construction and reconstruction projects in urban areas. This includes considering community needs and surrounding land use. According to Arizona DOT’s 2016 Complete Transportation Guidebook, pedestrian facilities should be provided on roadways within 1 mile of a school or major public institution (e.g., hospital, park), within all urbanized areas or areas projected to be urbanized by the project’s design years, where there is a history of pedestrian crashes, and any location where engineering/planning judgment or public involvement indicates the need (Arizona DOT 2016).
For Colorado DOT, all new construction projects where pedestrian demand is exhibited must incorporate the appropriate facilities. They note that project budget or limited scope is not an acceptable reason to fail to provide such facilities (Colorado DOT 2023b). VTrans recognizes that all transportation projects in the state should be designed and constructed under the assumption that they will be used by pedestrians and bicyclists, except where specifically prohibited (i.e., limited access highways). The safety of these users should be considered and addressed in design (VTrans 2002).
DOTs have incorporated walkway requirements into their various design manuals that reference the Americans with Disabilities Act and PROWAG guidelines. These include minimum width, buffer areas, grades, and cross slope. Highlights from a few select state DOTs include the following:
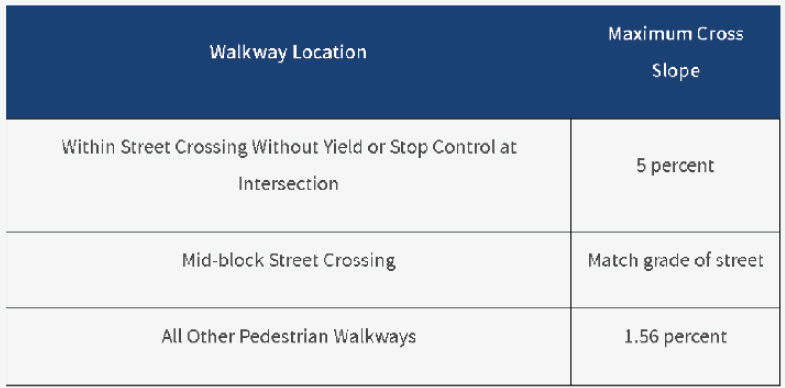
- Florida DOT generally requires separated walking areas on all roadways and bridges within 1 mile of an urban area. If separated from the curb by 2 feet or more, the minimum width of sidewalks is 5 feet. Where adequate buffer cannot be provided, the walkway width should be increased to 6 feet. The maximum grade on sidewalks is 5%, and the maximum cross slope is 2%. Careful consideration should be given to logical termination points. Railing or barrier protection applies for certain drop-off heights and slopes (Florida DOT 2017b).
- Nebraska DOT stipulates a 4-foot minimum width but prefers 5 feet. They recommend walkways be designed with a 1.5% cross slope to allow for tolerances during construction. The sidewalk grade should generally follow the adjacent roadway, not to exceed 5% (Nebraska DOT 2022a).
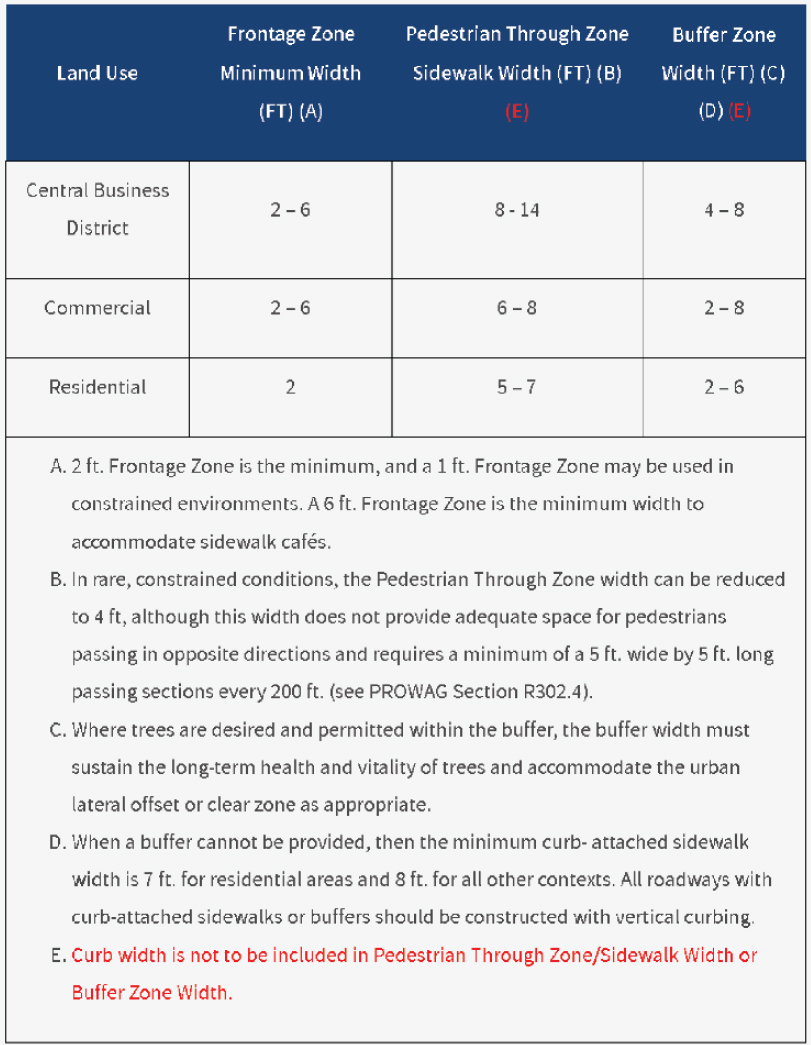
- Ohio DOT makes note that the largest detriment to pedestrian safety is a pedestrian’s proximity to motor vehicles, therefore the more separation or buffer, the better. They specify different walkway widths, buffers, and cross slopes depending on location (Ohio DOT 2024b). See Figure 23 and Figure 24.
- Oregon DOT stipulates that bicycle and pedestrian facilities should be considered as early as possible. They encourage the use of context-sensitive design to determine which facility type
- makes sense. Like Ohio, they recognize different zones within the sidewalk zone and different widths depending on location. Grades should generally follow the adjacent roadway and the maximum cross slope is 2% (Oregon DOT 2024a).
State DOTs commonly pull details from AASHTO’s 2012 Guide for the Development of Bicycle Facilities (AASHTO 2012) when developing standards for shared use paths. Shared use paths are treated differently by DOTs because they are usually designed to accommodate a variety of vulnerable road user types (pedestrians, bicycles, scooters, etc.). In addition to width, grades, and cross slopes, DOTs routinely reference preferred design speeds and
considerations for stopping sight distance as well. Highlights from a few select DOTs include the following:
- Indiana DOT references AASHTO as a resource for specifics not covered in their design resources. They recommend a minimum design speed of 15 mph, although 20 mph is desirable, and 30 mph may make more sense in certain situations where steep slopes are unavoidable. Indiana DOT recommends at least a 10-foot-wide path be provided. Grade and slope requirements should follow PROWAG. The Indiana Design Manual also provides a discussion of intersection treatments. Physical barriers, such as railing, are required where certain slopes and drop-offs occur (Indiana DOT 2013).
- Colorado DOT specifies design speeds in the range of 12 to 30 mph and suggests that 18 mph is generally sufficient. They suggest that the minimum width is 10 feet, although designers
- should reference the FHWA level of service calculator to evaluate appropriate widths on a case-by-case basis. Colorado DOT also notes that at least 11 feet is needed to allow enough space for side-by-side travel and passing. They also specify barrier requirements in accordance with AASHTO. In Colorado, grades should maintain a maximum slope of no more than 5%, recognizing that this may be impractical in certain terrains. Under these circumstances, rest areas should be provided intermittently (Colorado DOT 2023b).
Roadway Departure
Enhanced Delineation for Horizontal Curves
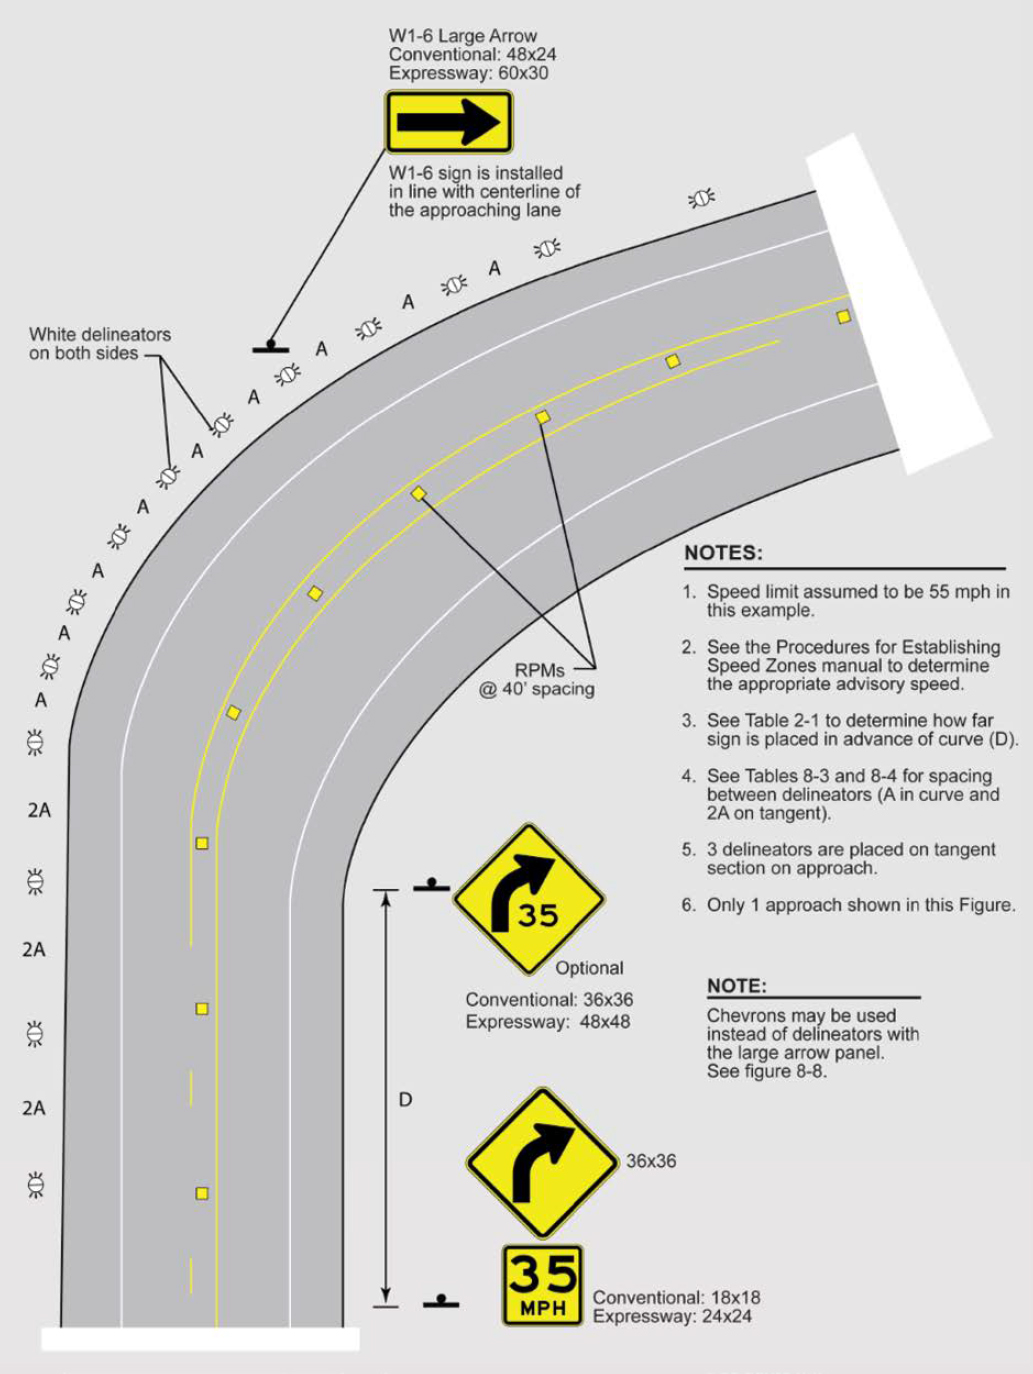
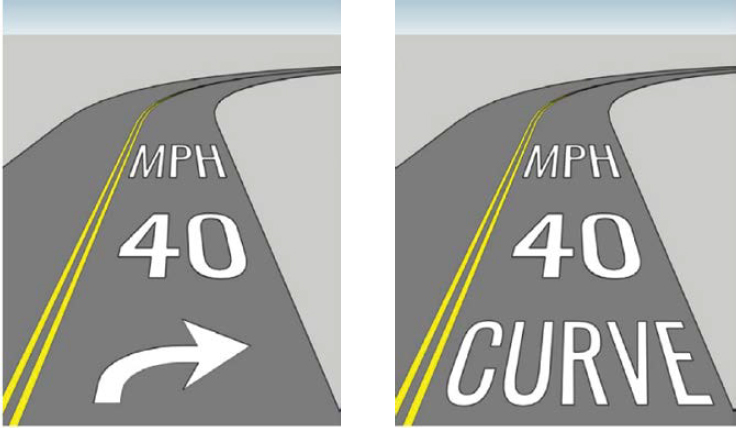
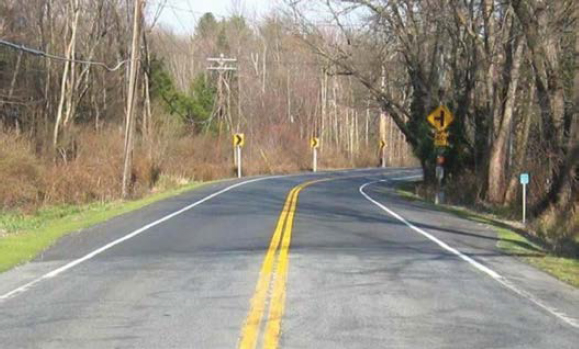
DOTs use various types of strategies for this countermeasure. For example, a countermeasure package developed by VTrans (2023b) to help improve driver awareness at curves includes edge line markings, curve warning signs, and speed feedback signs. Texas DOT provides guidance on the selection of types of warning devices based on the difference between the advisory speed and posted speed (Texas DOT 2018b). As shown in Figure 25, warning devices include an advisory speed sign, a large arrow panel sign, raised pavement markers, and delineators or chevrons when the advisory speed is 15 to 20 mph below the posted speed. Guidance from Wisconsin DOT indicates that chevrons should only be used when there is an existing concern with crashes (Wisconsin DOT 2023a).
Regarding safety performance, an evaluation of sequential dynamic chevrons based on 18 sites in seven states found CMFs of 0.34 for total crashes and 0.49 for injury crashes (Hallmark et al. 2020). A safety evaluation of horizontal curve warning pavement markings (see Figure 26) based on 263 treated curves in Pennsylvania found crash reductions of 34.8% for total crashes and 30.7% for fatal and injury crashes (Donnell et al. 2019).
Longitudinal Rumble Strips and Stripes on Two-Lane Roads
In their policies and standards for rumble strips, DOTs prescribe conditions for which rumble strips should be used, layouts, and dimensions.
- Massachusetts DOT requires centerline rumble strips on undivided roads with a posted speed limit of at least 40 mph (Massachusetts DOT 2020c). On non-freeways and non-expressways, Massachusetts DOT mandates the use of rumble strips on outside shoulders with a width of at least 2 feet (bicycle travel prohibited) or at least 8 feet (if bicycle travel is allowed).
- Connecticut DOT’s criteria for consideration of centerline rumble strips include a speed limit of 35 mph or higher, ADT of 2,000 vpd, pavement in good condition, roadway width of at least 14 feet from centerline to edge of pavement, minimum length of 1 mile, and low residential density (Connecticut DOT 2023a).
- Virginia DOT’s guidance indicates that an engineering study should be performed to assess the need for rumble strips based on factors such as crash history, geometry, traffic volumes, design and posted speeds, pavement conditions, adjacent land use, and traffic control devices (Virginia DOT 2023a).
- Montana DOT provides a table of rumble strip locations and widths based on roadway type and pavement width (Montana DOT 2015).
DOTs have made modifications to rumble strips in efforts to accommodate bicyclists and address noise concerns.
- Delaware DOT has adjusted its rumble strip layout to accommodate bicyclists by reducing their width, moving them closer to the edge line, and incorporating regular gaps (Delaware DOT 2013). Delaware DOT has also implemented sinusoidal rumble strips (mumble strips), which incorporate a wave-like design to decrease the noise impacts.
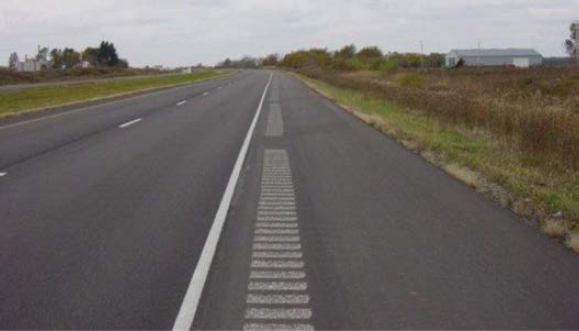
- Iowa DOT utilizes a pattern of 48 feet of rumble strips and a 12-foot gap for highways that legally permit bicyclists (see Figure 27) (Iowa DOT 2024a). In addition, Iowa DOT specifies that at least 4 feet should be provided outside of the rumble strip on the paved shoulder for bicyclists (see Figure 28).
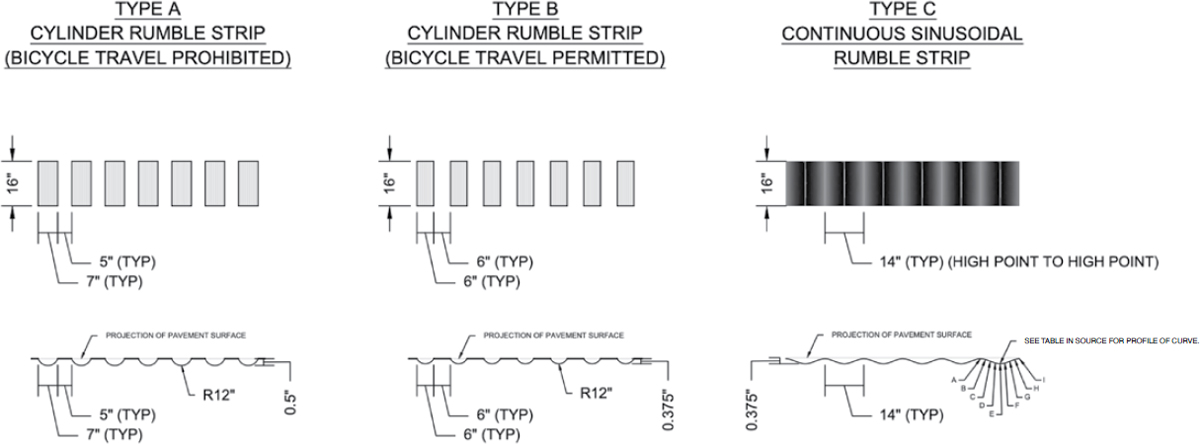
- Massachusetts DOT (2020c) deploys three types of rumble strips: cylinder rumble strips for permitted bicycle travel, cylinder rumble strips for non-permitted bicycle travel, and sinusoidal rumble strips (see Figure 29).
An evaluation of centerline rumble strips using sites in Wyoming found total crash reductions of 25% to 68%, and safety performance improved with increased winter maintenance (Ahmed et al. 2022). A safety assessment of shoulder rumble strips using data from three states (Minnesota, Missouri, and Pennsylvania) indicated reductions in fatal and injury crashes ranging from 7% to 16% (Torbic et al. 2009). Results from an evaluation of the safety performance of sinusoidal rumble strips on rural two-lane undivided roads in Minnesota indicated no significant differences in crash rates between sinusoidal rumble strips and rectangular rumble strips (Storm et al. 2023).

Median Barriers
DOT standards for median barriers contain information on topics such as warrants, barrier types, and design criteria. DOT warrants for median barriers are typically based on median width and ADT.
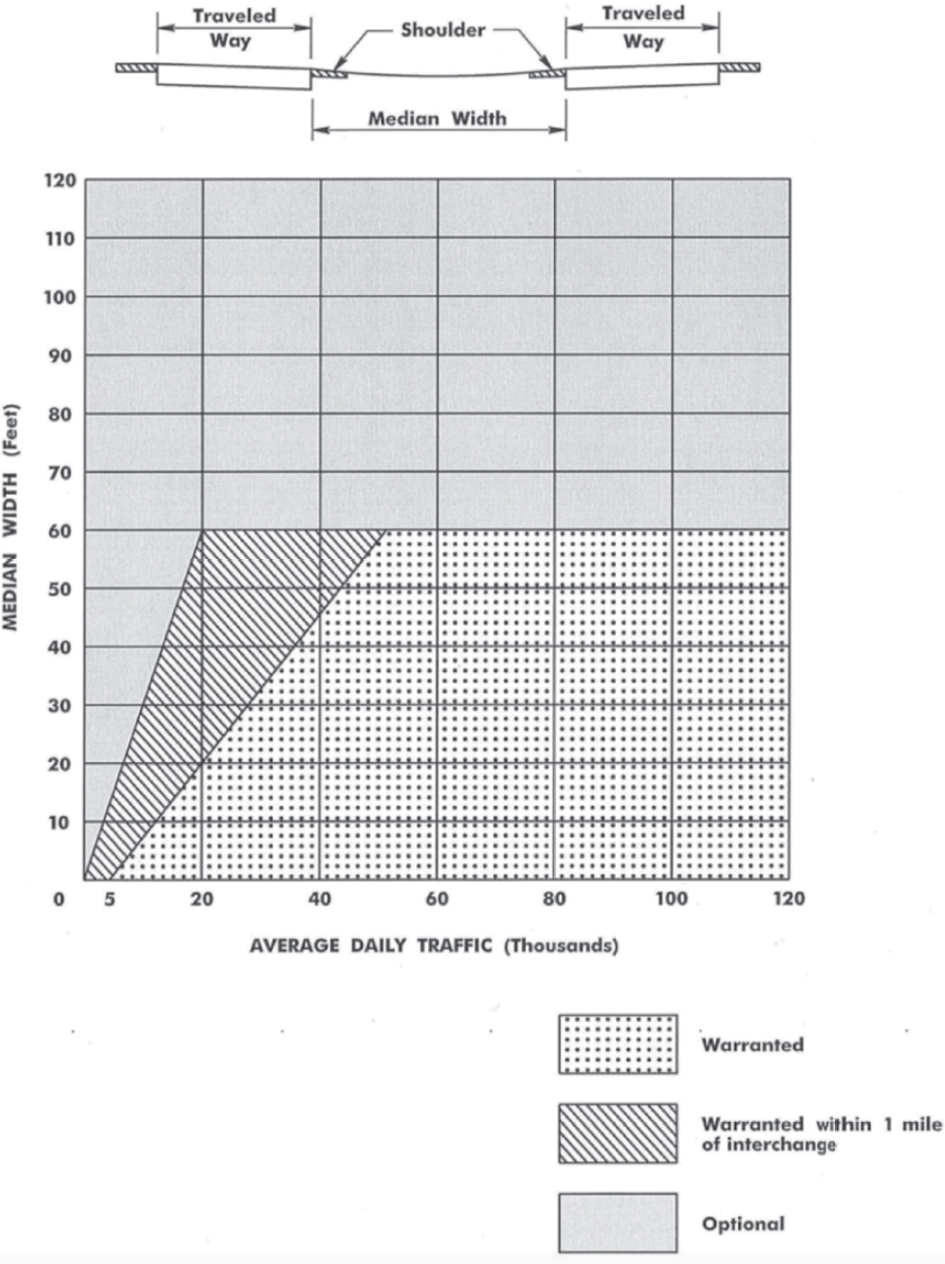
- New Jersey DOT’s median barrier warrants are shown in Figure 30. New Jersey DOT’s guidance also notes that if the need for median barriers is found to be optional based on the provided warrants, median barriers should be provided if there are 0.50 cross-median crashes per mile annually or 0.12 fatal cross-median crashes per mile annually (New Jersey DOT 2015).
- Caltrans provides study warrants for median barriers based on ADT and median width (Caltrans 2019).
- Oregon DOT’s guidance provides information on width requirements and barrier types (Oregon DOT 2024a). Regarding barrier types, Oregon DOT specifies that the use of cable barriers requires at least 8 feet of deflection area.
Multiple DOTs have reported crash reductions associated with the use of median barriers. For example, Michigan DOT indicates that use of cable median barriers in Michigan has led to 90% reduction in cross-median crashes (Michigan DOT n.d.a.). Minnesota DOT’s evaluation found that the use of cable median barriers has eliminated almost all fatal and serious cross-median crashes at locations where it has been implemented (Minnesota DOT 2024a).
An example of a cable median barrier from a Michigan DOT outreach video is shown in Figure 31.
Roadside Design Improvements at Curves
DOTs address various aspects of horizontal curves in their guidance for roadside safety design, such as clear zones and roadside barriers.
- Florida DOT and Maryland DOT State Highway Administration indicate that clear zones may be adjusted for horizontal curvature (Florida DOT 2024a; Maryland DOT State Highway Administration 2021).
- Ohio DOT provides guidance on determining the barrier length of need on horizontal curves (Ohio DOT 2024c).
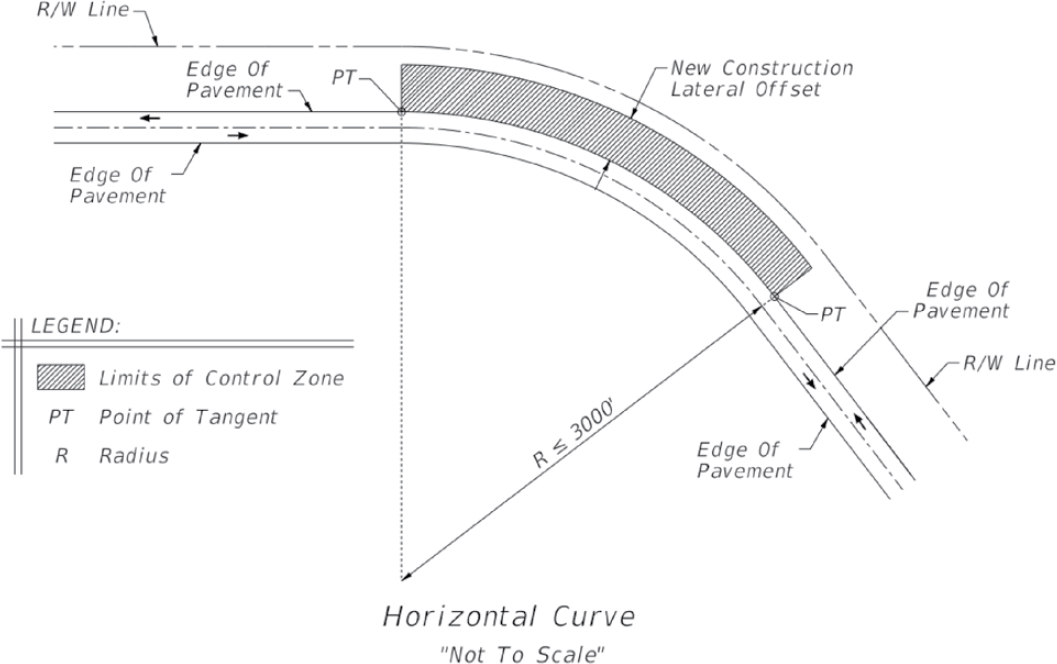
- Florida DOT prescribes that the outside of horizontal curves on resurfacing, restoration, and rehabilitation projects should be designed as a Control Zone (area susceptible to higher frequency of roadway departures) (see Figure 32) based on criteria for new construction when the curve radius is less than 3000 feet and the posted speed is greater than 35 mph (Florida DOT 2024a).
- Maryland DOT State Highway Administration suggests in its guidance on the placement of traffic barrier that median barriers should be placed at a higher offset on the outside of horizontal curves to provide a recovery area for drivers that navigate the curve errantly (Maryland DOT State Highway Administration 2021).
- Missouri DOT allows for the use of engineering judgment to assess roadside alternatives (e.g., clear zone widths, guardrail instead of clear zone, or a combination of clear zone and shielding) for locations on the outside of horizontal curves where the public may not feel secure with the clear zone (Missouri DOT 2024).
Existing research studies regarding safety benefits of this FHWA PSC are limited and may be outdated. NCHRP Report 617: Accident Modification Factors for Traffic Engineering and ITS Improvements presented CMFs for flattening sideslopes (e.g., 0.92 for single-vehicle crashes for
changing 3:1 slope to 4:1) based on expert panel solicitation (Harkey et al. 2008). A Missouri study reported crash reductions for shoulder widening (e.g., 4% total curve crash reduction for widening shoulder by 1 foot), sideslope flattening (e.g., 5% total curve crash reduction for changing 3:1 slope to 4:1), and removal of roadside obstacles (e.g., 9% total curve crash reduction for increasing roadside recovery distance by 5 feet) based on FHWA studies on countermeasure effectiveness for horizontal curves on rural two-lane highways (Virkler et al. 1993).
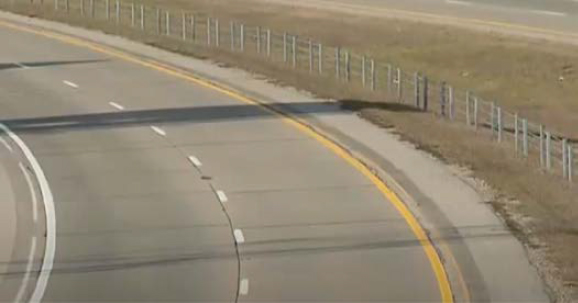
An example of shoulder widening is shown in Figure 33.
SafetyEdge
Many DOTs provide standards or policies for the use of SafetyEdge. These standards or policies often prescribe the conditions that require the use of SafetyEdge, such as proximity to other features, shoulder width, and pavement depth. Examples include the following:
- Caltrans requires SafetyEdge on all projects with pavement items unless an exception is documented (Caltrans 2012a). SafetyEdge is not placed at these locations: within 3 feet of driveways or intersections, on pavement overlays with a thickness less than 0.15 feet, at locations with less than 1 foot between the edge of pavement shoulder and the hinge point, and adjacent to curbs, dikes, guardrail, barrier, walls, and landscape paving.
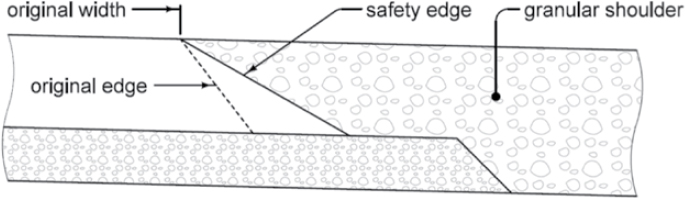
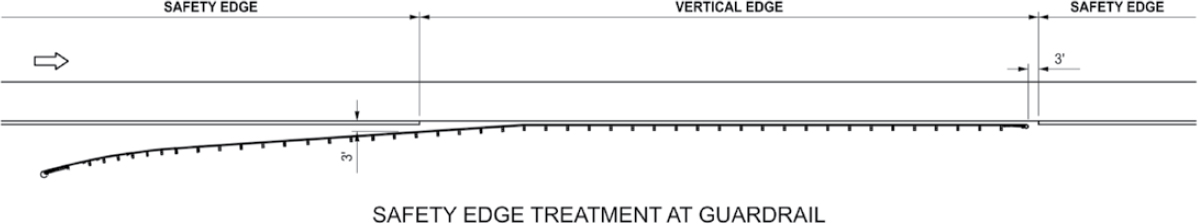
- Iowa DOT mandates the use of SafetyEdge on all primary highways, with the following exceptions: roadway at interchange ramp or loop, roadway or shoulder is curbed, or paved shoulder width is at least 4 feet (Iowa DOT 2024a). Iowa DOT’s typical section for the addition of SafetyEdge is shown in Figure 34.
- Michigan DOT provides details for SafetyEdge for asphalt and concrete pavements (Michigan DOT 2022b). As shown in Figure 35, SafetyEdge is not utilized when guardrail is within 3 feet of the shoulder. In addition, the use of SafetyEdge is optional when the distance between minor roads or driveways is less than 30 feet.
- Minnesota DOT’s traffic manual indicates that SafetyEdge is required if the paving depth of new pavement or shoulder is at least 2 inches and the paved shoulder is less than 8 feet wide (Minnesota DOT 2024f).
- SafetyEdge must be installed on all paving projects on state highways in Ohio that meet criteria as outlined in the Ohio DOT Pavement Design Manual: uncurbed sections only, more than 1.5 inches of new material placed, paved shoulder width less than 4 feet (mainline) or 3 feet (ramps), continuous paving length of at least 1500 feet (unless adjacent pavement already has SafetyEdge), and speed limit higher than 35 mph (Ohio DOT 2024g).
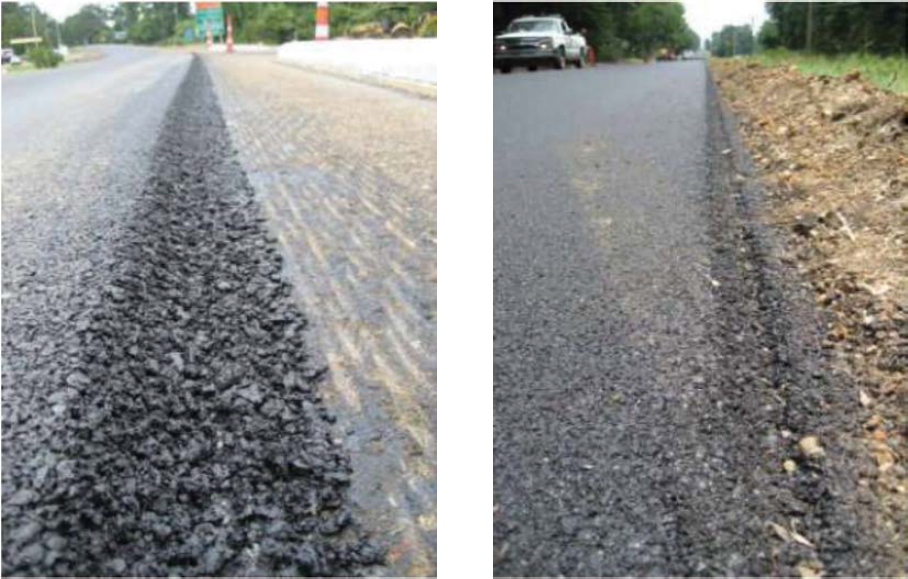
An FHWA study of the safety effects of SafetyEdge found CMFs of 0.892 for fatal injury crashes and 0.79 for run-off-road crashes (FHWA 2017a). The study was based on data from five states (Florida, Iowa, North Carolina, Ohio, and Pennsylvania). An example of SafetyEdge treatment in Mississippi is shown in Figure 36.
Wider Edge Lines
Many DOTs have implemented this FHWA PSC using 6-inch edge lines; however, other widths are used by some DOTs. For example, Alabama and Georgia DOTs use a 5-inch width for edge lines (Alabama DOT 2022d, Georgia DOT 2024b). Nevada DOT requires 8-inch edge line striping
on interstates and freeways and 6-inch edge line striping on the following types of facilities: rural roadways with an AADT higher than 400 vpd, rural roadways with speeds exceeding 40 mph, and a specific list of designated state routes (Nevada DOT 2022a).
Some DOTs only require the 6-inch edge line markings for certain types of roadways based on roadway type, jurisdiction, ADT, or other criteria. DOT examples of this practice include the following:
- Indiana DOT specifies a 6-inch width for edge line markings on state-owned roadways, while edge line markings on Local Public Agency roadways are 4 inches wide (Indiana DOT 2013).
- The Kentucky Transportation Cabinet requires the use of 6-inch striping for all Interstates, parkways, ramps, and other highways on the State Primary Road System and for two-lane highways not on the State Primary Road System with a traveled way width of at least 20 ft and ADT of at least 1,000 vpd (Kentucky Transportation Cabinet 2021).
- For Massachusetts DOT, normal lines are 6 inches wide for roads on the National Highway System and for any roads with a speed limit of 45 mph or higher (Massachusetts DOT 2022b).
- Missouri DOT uses a width of 6 inches for edge lines on all major routes (see Figure 37) (Missouri DOT 2024).
- Virginia DOT calls for the use of 6-inch edge lines on freeways and 4-inch edge lines on all other highways (Virginia DOT 2013; Virginia DOT 2016). However, a width of 6 inches may also be used on other types of facilities based on engineering judgment.
A safety evaluation of wider (6-inch) pavement markings based on sites in Idaho found crash reductions of 17% (total crashes) and 14% (fatal and severe injury crashes) (Abdel-Rahim
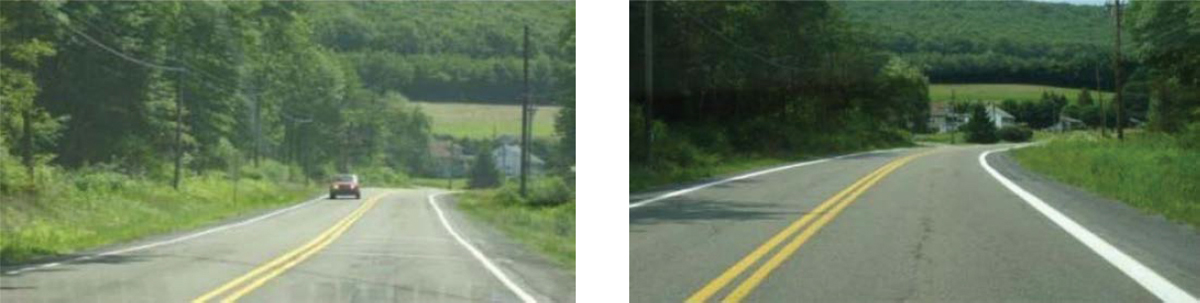
et al. 2018). Results from a research study using data from three states (6-inch markings in Kansas, 6-inch markings in Michigan, and 5-inch markings in Illinois) showed crash reductions of 17.5% to 30.1% (total crashes) and 15.4% to 37.7% (fatal plus injury crashes) (Park et al. 2012). Figure 38 shows a comparison of a 4-inch edge line and 8-inch edge line for the same section of roadway.
Intersections
Backplates with Retroreflective Borders
Many DOTs have adopted policies or standards that require backplates with retroreflective borders (see Figure 39) at all new signalized intersections meeting specific criteria. These include
- Connecticut DOT, which requires backplates with 2-inch-wide retroreflective borders be included on all new state-owned traffic signals (Connecticut DOT n.d.);
- Ohio DOT, which requires backplates with retroreflective borders be included on any signal that is state- or federally-funded (Ohio DOT 2024a);
- South Carolina DOT, which specifies backplates with 2-inch-wide retroreflective borders be installed on all signal heads at intersections with approach speeds equal to or greater than 45 mph (South Carolina DOT 2021b); and
- South Dakota DOT, which requires all new vehicle signal heads be equipped with backplates with 3-inch-wide retroreflective borders (South Dakota DOT 2024).
A few state DOTs have identified policies for upgrading/retrofitting existing signal heads to include backplates with retroreflective borders. These include the following:
- Florida DOT published a 2020 bulletin specifying that all existing signals are to be retrofitted to include backplates where the addition will not necessitate structural modifications. Flexible backplates may be used on existing structures, but rigid is specified for all new structures (Florida DOT 2020b).
- Oregon DOT has declared a high-priority goal to add backplates or change existing backplates to reflectorized backplates for vehicle signals statewide (Oregon DOT 2024b).
In 2005, FHWA and South Carolina DOT completed a before-and-after case study at three locations in Columbia, South Carolina. The results showed a 28.6% reduction in overall crashes after the installation of backplates with retroreflective borders, a 36.7% reduction in injury crashes, and a 49.6% reduction in crashes during dark hours (FHWA 2010).
A similar case study performed by the Kentucky Transportation Cabinet was included in FHWA’s Intersection Proven Safety Countermeasure Technical Summary: Backplates with Retroreflective Borders. Thirty signalized intersections were equipped with backplates and resulted in a total crash reduction of 19.6%, a 44.4% reduction in angle crashes, and a 10% reduction in rear-end crashes. The study notes that backplates currently are not required in Kentucky, but when they are installed, a 2-inch-wide fluorescent yellow reflective border should be applied (FHWA 2015).
In 2021, Caltrans initiated a project to install reflective backplates at more than 5500 signalized intersections across the state. They cited benefits to increased visibility during dark hours and during power outages (Caltrans 2021d).
Corridor Access Management
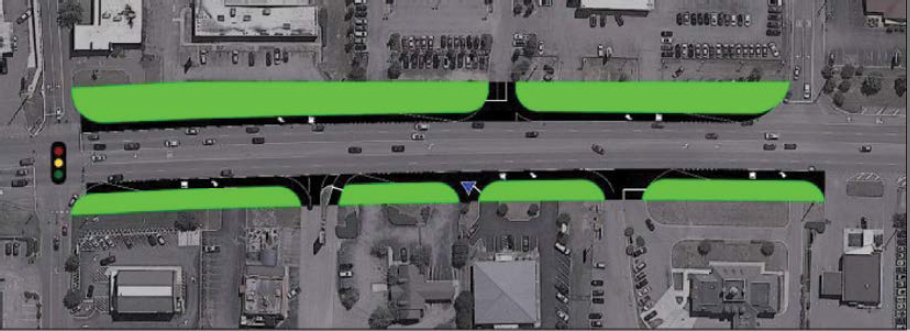
Several DOTs recognize the positive impacts of corridor access management. Alabama DOT’s Access Management Manual (Alabama DOT 2022a) includes a discussion of corridor management safety benefits by highlighting the importance of reduction in conflict points and driving complexity when access points are minimized and adequately spaced. Strategies for corridor access management include developing corridor access management plans to guide decisions and land development along roadway segments, consolidation/reconfiguration of existing driveways, installation of medians, and alternative intersection designs. Alabama is currently developing an Intersection Control Evaluation (ICE) Policy to help with alternative intersection screening (Alabama DOT 2022a). As part of Alabama DOT’s Access Management Manual, they present an example that shows how consolidation and reconfiguration of driveways along a 900’ section of road reduced the number of points from 15 full access driveways to 5 driveways. See Figure 40.
Indiana DOT’s Access Management Guide identifies 14 corridor access management principles that guide decision making. These include limiting direct access to state highways and other major roadways, promoting intersection hierarchy, limiting the number of driveways and other conflict points, removing turning vehicles from through traffic lanes, matching driveway design with operational and safety needs, promoting corridor access management plans, and others. The guide highlights the benefits of proper corridor access management, such as system preservation, economic benefits, environmental impacts, improvements to traffic operations, and safety benefits. Indiana DOT has a driveway permit program, and the design of driveways or access points is based on the roadway’s classification (Indiana DOT 2009).
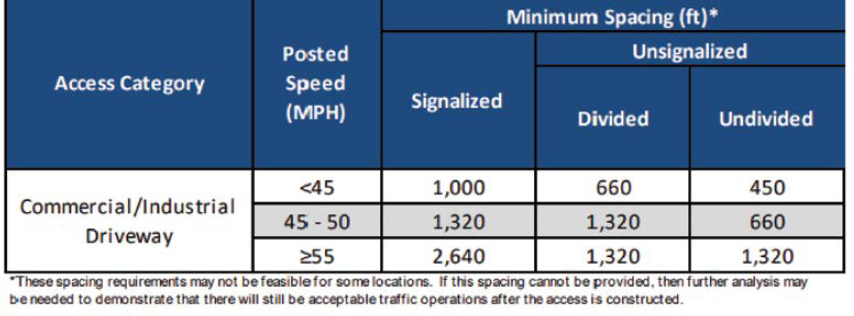
Nevada DOT’s Access Management System and Standards discusses the importance of corridor access management from a safety perspective by detailing the correlation between crash rate and access point density. Nevada DOT also highlights the benefits of proper corridor access management for vulnerable road users. This is because of the reduction in conflict points, and refuge areas provided by medians (Nevada DOT 2017).
In 2006, the Kentucky Transportation Center performed a study to quantify the benefits of corridor access management in the state. The study, Quantification of the Benefits of Access Management for Kentucky, reported a 21% overall reduction in annual crash frequency, a 32% reduction in annual travel delay, and $950 million in annual cost savings because of such reductions (Kirk et al. 2006).
DOTs provide detailed guidance on corridor access management using access management guides or manuals and/or chapters within their roadway design manuals. A few examples include Alabama DOT’s Access Management Manual (Alabama DOT 2022a), Colorado DOT’s Roadway Design Guide Chapter 11 (Colorado DOT 2023b), Indiana DOT’s Access Management Guide (Indiana DOT 2009), Maryland DOT’s MDOT SHA Access Manual (Maryland DOT State Highway Administration 2024), and Nevada DOT’s Access Management System and Standards (Nevada DOT 2017).
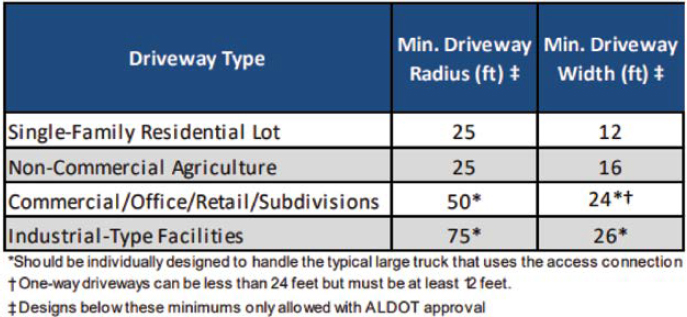
For Alabama DOT, design criteria include spacing, width, and radii. Some highlights from Alabama DOT’s driveway design criteria are shown in Figure 41 and Figure 42 (Alabama DOT 2022a).
Like other DOTs, Nevada DOT has an access request and permit process. Access types and design standards are broken out by roadway classification and access type. The Nevada DOT guide also provides standards for median width, which is based on function (Nevada DOT 2017). An excerpt from the guide is provided in Figure 43.
Dedicated Left- and Right-Turn Lanes at Intersections
Several DOTs have established warrants and design criteria for turn lanes at intersections. A few highlights include the following:
- Arizona DOT established warrants for both right-turn lanes and left-turn lanes as part of their traffic guidelines and processes. The warrants are based on posted speed, number of through lanes, and peak hour volumes (Arizona DOT 2021).
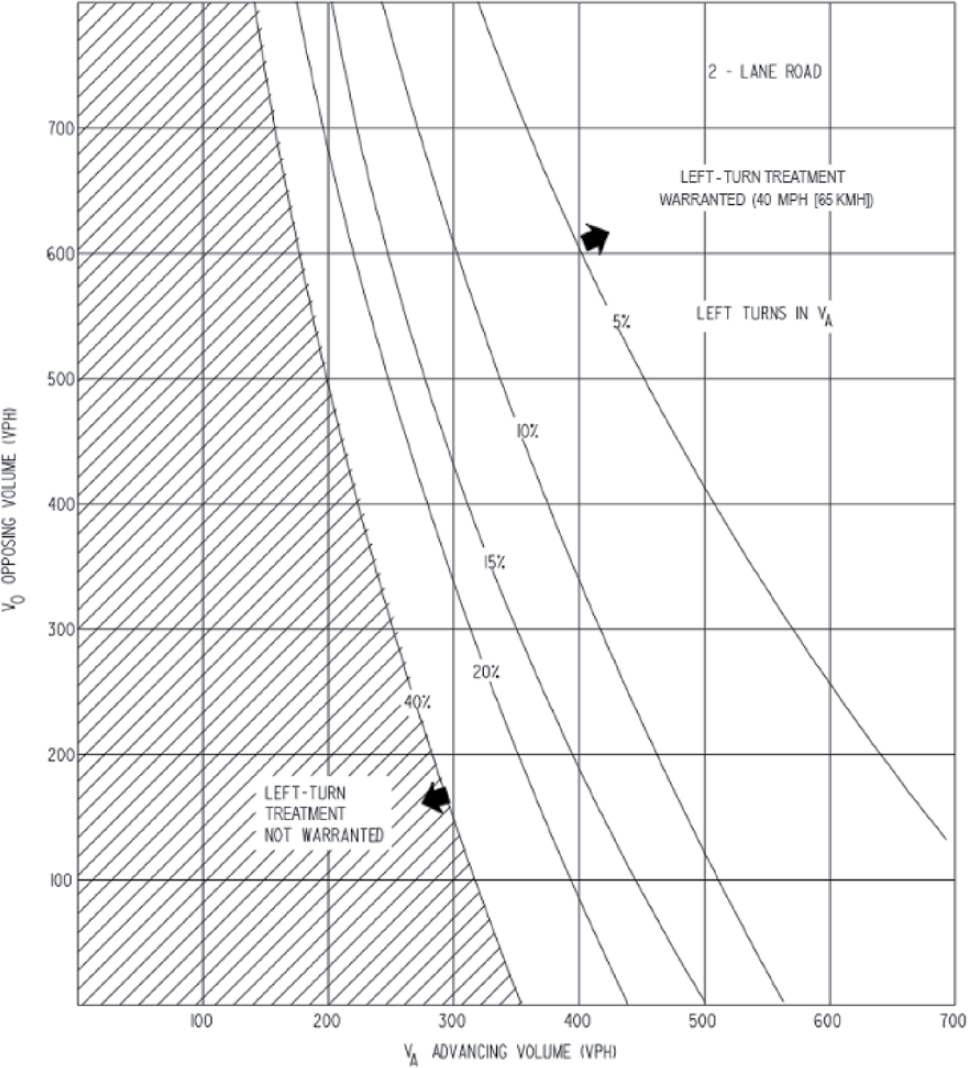
- Delaware DOT’s Road Design Manual provides specifications for left-turn lane warrants. The warrants compare the percentage of turning vehicles against opposing volumes and operating speed (Delaware DOT 2006). A graphical guide for a 40-mph operating speed is provided in Figure 44. Similar graphs have been developed for 50-mph and 60-mph operating speeds.
- Georgia DOT recommends right-turn lanes be provided at all public street intersections and entrances when the posted speed is at least 45 mph. When the posted speed is less than 45 mph, right-turn lanes may still be warranted and are based on volumes. The policy also refers to NCHRP Report 457: Engineering Study Guide for Evaluating Intersection Improvements (Bonneson and Fontaine 2001) for additional guidance on left and right-turn lane warrants (Georgia DOT 2024a).
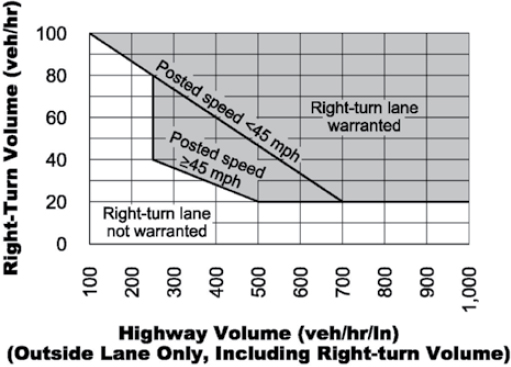
- Idaho Transportation Department utilizes AASHTO’s Green Book (AASHTO 2018) for left-turn lane warrants and Figure 45 for right-turn lane warrants (Idaho Transportation Department 2020).
Florida DOT has developed several exhibits that provide suggested turn lane design based on various roadway widening alternatives, the presence of medians, and the number of through lanes. Design guidance states that storage length should be based on queue lengths calculated as part of a traffic study but also provides minimum lengths for low-volume locations where a study may not be warranted (Florida DOT 2024a). An excerpt for 2-lane roadways is shown in Figure 46.
In addition to taper and storage lengths, Ohio DOT also provides discussion on left-turn lane offsets as part of Section 400 of their Location and Design Manual (Ohio DOT 2024c). They recommend zero offset, meaning opposing left-turn lanes are placed directly opposite one another, at a minimum but note that positive offset improves sight lines and increases visibility. Ohio DOT has developed similar exhibits as those provided by Florida DOT, but instead of relying solely on traffic studies to determine storage length, they have also developed procedures for calculating suggested storage lengths. Storage length is calculated based on traffic control type, design speed, and turn demand volume. Ohio DOT’s Location and Design Manual also provides procedures for checking through storage block to ensure the turn lane will be usable (Ohio DOT 2024c).
Reduced Left-Turn Conflict Intersections
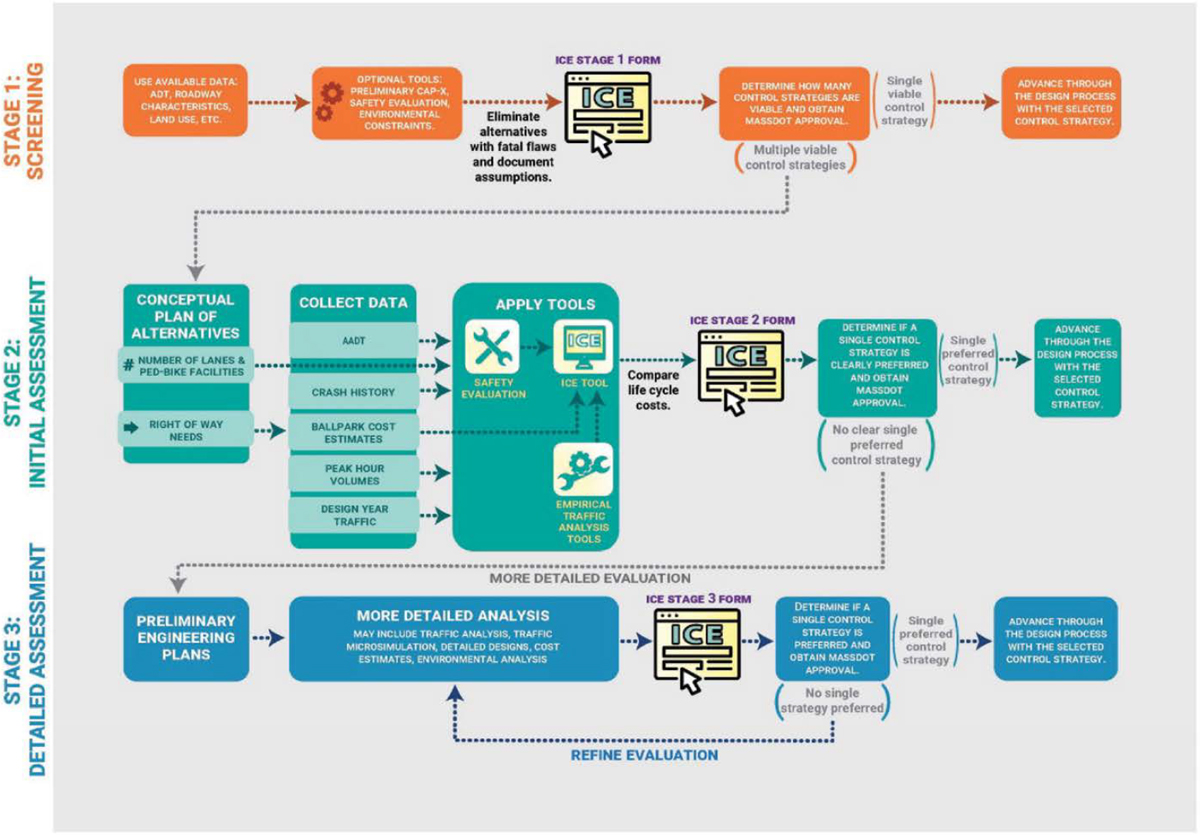
As various ICEs become more prevalent across many DOTs, alternative intersection designs, such as reduced left-turn conflict intersections, are routinely being considered. For example, as part of Massachusetts DOT’s ICE procedure Median U-Turn, Signalized Restricted Crossing U-turn (RCUT) (one type of reduced left-turn conflict intersection), and unsignalized RCUT, among other alternative intersections, are regularly evaluated and considered (Massachusetts DOT 2023b).
Massachusetts DOT requires ICE when a project intersection meets one or more of the criteria that include
- Creating a new intersection;
- Adding a leg to an existing intersection;
- Adding one or more through lanes, turn lanes, or bypass lanes;
- Changing traffic control; and
- High-crash location.
Massachusetts DOT’s ICE follows a three-step process which begins with screening a wide range of control strategies, followed by initial assessment of alternatives determined to be viable during screening, and finishing with detailed assessment and selection of preferred intersection design. A flowchart of the process is provided in Figure 47.
Wisconsin DOT identifies J-Turn intersections (also known as RCUT intersections) as an alternative considered on expressways, although they are only used in pilot settings. A selection must be justified in using their ICE process, which is generally triggered when new traffic control systems or changes to them are being considered, when a new or alternative intersection or interchange is being considered, or when proposed intersections are offset (Wisconsin DOT 2022b).
In August 2021, Moreland et al. (2021) published a study that evaluated the safety impacts at 49 reduced conflict intersections installed across the state of Minnesota between 2010 and 2020. The study results found statistically significant safety benefits including a 69% decrease in fatal and serious injury crashes, a 70% decrease in angle crashes, a 100% decrease in fatal and serious injury angle crashes, along with a 103% increase in rear-end crashes (Moreland et al. 2021).
In North Carolina, the first RCUT intersection was established in 2000, and today there are over 400. In 2023, North Carolina DOT completed a safety study of 31 reduced conflict intersections without signals. Between 2009 and 2017 the intersections saw a 50% reduction in total crashes and an 80% reduction in frontal impact crashes (North Carolina DOT 2023a). A separate study by UNC Wilmington evaluated the economic impacts of RCUT intersections. Findings included the following:
- Some locations experienced greater economic activity, and many experienced no economic impacts.
- Businesses with many customers felt the design makes it easier for customers to travel to their business, especially during peak travel periods.
- RCUTs can help support home values (North Carolina DOT 2023a).
Missouri DOT provides a discussion of directional median openings with downstream U-turns, also known as J-Turns, as part of their Engineering Policy Guide, Section 233.2 At-Grade Intersections with Stop and Yield Control (Missouri DOT 2024). The policy provides a summary of advantages and disadvantages and design considerations. Design considerations include offset lengths and acceleration/deceleration considerations, which are largely based on major and minor road vehicles per hour. It also notes that public acceptance tends to be one of the biggest hurdles during planning stages, so education and public involvement should be initiated as early as possible (Missouri DOT 2024).
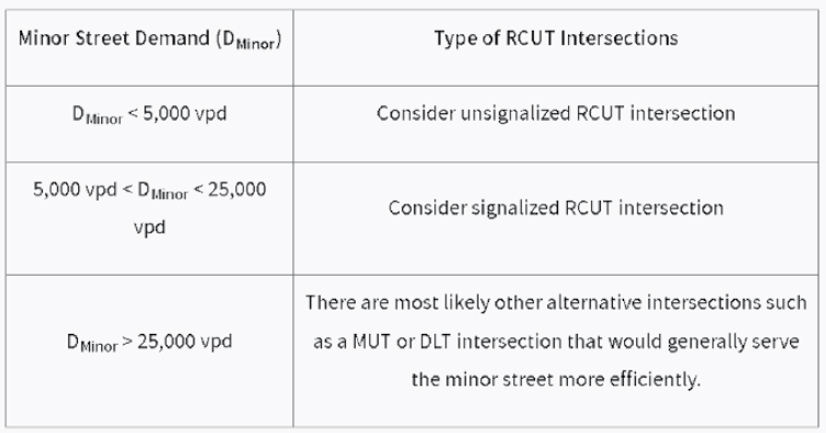
Section 404 of Ohio’s Location and Design Manual provides a discussion of the advantages and disadvantages of RCUT intersections for several categories, including pedestrians and bicycles, safety, traffic operations, corridor access management, traffic calming, footprint, maintenance, aesthetics, costs, construction, and education (Ohio DOT 2024c). The manual also provides suggestions for application criteria. These include
- Intersections with side-street left-turn and through volumes that are relatively low and high major road left-turn volumes (ratio of minor road total volume to total intersection volume less than or equal to 0.2),
- Areas with median widths greater than 40 feet, and
- Intersections with a high number of far-side right-angle crashes.
Feasible demand conditions, as recommended by Ohio DOT, are provided in Figure 48. Discussion is also provided regarding when signalized RCUT intersections may be warranted. Ohio DOT primarily recommends signalization when the percentage of green time on the major approach is 67–75% (Ohio DOT 2024c).
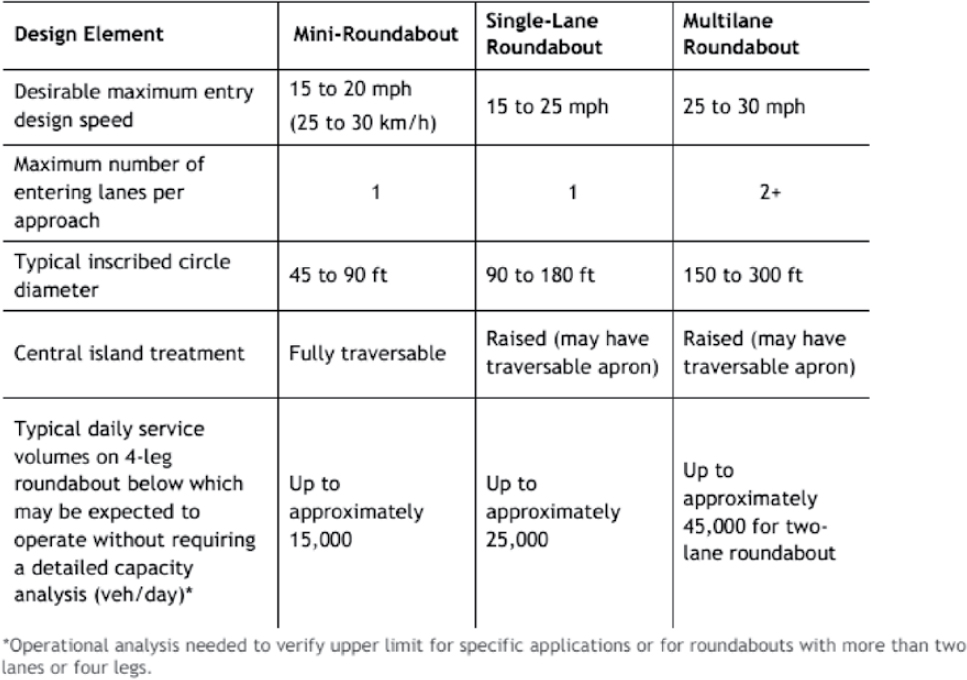
Roundabouts
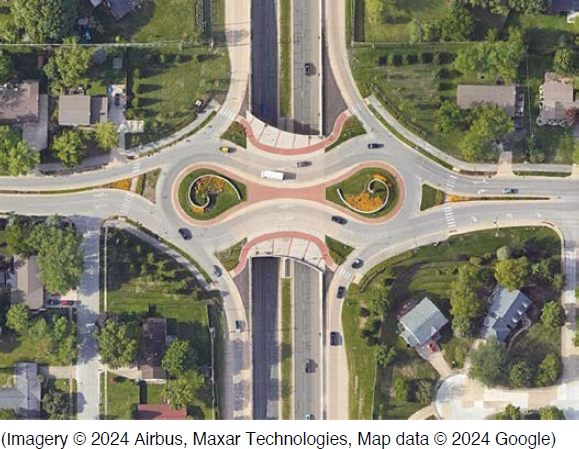
Similar to RCUT intersections, roundabouts are routinely considered as part of DOTs’ ICEs, including DOTs such as Colorado DOT (2023b), Florida DOT (2024a), and Washington State DOT (2023). Additionally, several states have studied the effects of roundabouts in their states. A study by the Georgia Institute of Technology evaluated safety impacts at 23 locations in Georgia converted from stop-controlled to roundabouts. The findings indicated that roundabouts resulted in a 37–48% reduction in average crash frequency for all crashes and a 51–60% reduction in crash frequency for injury and fatal crashes (Gbologah et al. 2019). Carmel, Indiana—often referred to as the Roundabout City—compared crash data 2 years before and 2 years after the installation of both single- and double-lane roundabouts. Injury crashes were reduced by 47% overall (see example roundabout in Figure 49). Multi-lane locations were associated with an increase in total and property-damage-only crashes, but a 15% decrease in injury crashes (Wang and Cicchino 2022).
Several DOTs refer to NCHRP Report 672: Roundabouts: An Informational Guide (Rodegerdts et al. 2010) for specific design guidance, with supplemental state-specific guidance. These include Colorado DOT (2023b), Florida DOT (2024a), the Kentucky Transportation Cabinet (2023a), Maryland State Highway Administration (2012), and Ohio DOT (2024c).
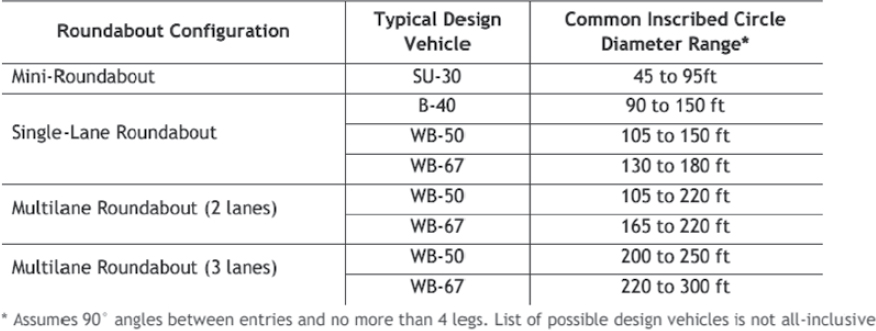
According to Colorado DOT’s Roadway Design Guide, all roundabouts designed at intersections along the State Highway System must be developed and evaluated in accordance with NCHRP Report 672 (Rodegerdts et al. 2010) or the latest edition. The Roadway Design Guide also provides some high-level design elements for three roundabout types – mini, single, and double. Excerpts are shown in Figure 50 and Figure 51. Colorado also identifies key performance checks that must be performed to ensure adequate design. These include fastest path, path alignment, sight distance, and angles of visibility (Colorado DOT 2023b).
To help designers, Florida DOT developed computer-based training on roundabout design. The training provides detailed information on fundamental principles of geometric design, based on NCHRP Report 672: Roundabouts: An Informational Guide and FDOT’s Roundabout Design Course (Florida DOT 2020c). Florida recommends staging construction when traffic operational analysis indicates a multi-lane roundabout will be required in the design year, but a single lane would be acceptable for the next 10 to 15 years. They note negative effects on safety and operations when more lanes than needed are provided. Florida also notes the importance of providing geometry to gradually slow down drivers and recommends
- Prominent landscaping in the central island to increase visibility,
- Raised splitter islands and roadside curb to establish a speed transition zone, and
- Geometric features that introduce deflection and curvature into the driver’s path.
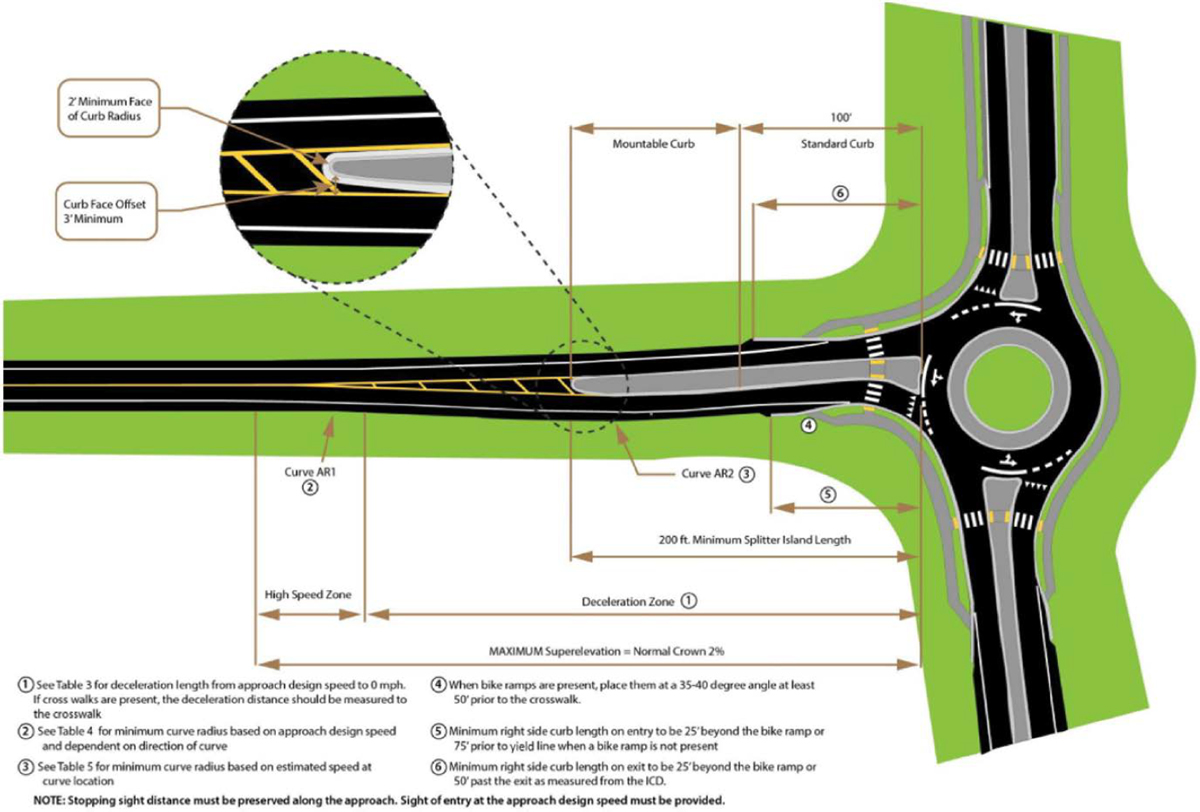
Florida also provides state-specific details regarding the desired geometry for a high-speed two-lane undivided highway approaching a single-lane roundabout (Florida DOT 2024a).
The Kentucky Transportation Cabinet states that roundabouts warrant consideration on projects that include a new intersection, where major reconstruction of an existing signalized intersection is proposed, or on widening/reconstruction or corridor projects. Highway Capacity
Manual methodology should be used to determine the number of lanes and lane arrangements needed. Like Florida DOT, the Kentucky Transportation Cabinet recommends a stepped approach if the Highway Capacity Manual determines that a multi-lane roundabout will be needed in the future, but a single lane is adequate today. Design performance checks in Kentucky include entry angle, entry deflection, exit curves, speed differential, and other multi-lane-specific considerations. The Kentucky Transportation Cabinet’s guidance also provides discussion on the various roundabout shapes. The guidance notes that circular designs are preferred but oval and asymmetric designs may be used if site constraints render circular designs impractical. The guide summarizes other designs such as ellipse, peanut, barbell or dog bone, and teardrop, and provides high-level details about when each might be beneficial. Design vehicles are largely governed by roadway classifications (Kentucky Transportation Cabinet 2023a). Their Highway Design Guidance Manual also provides additional details for high-speed approaches (greater than 45 mph) (Kentucky Transportation Cabinet 2023a). See Figure 52 for an excerpt.
Maryland State Highway Administration first began implementing modern roundabouts in 1993. Maryland State Highway Administration has adopted NCHRP Report 672: Roundabouts: An Informational Guide (Rodegerdts et al. 2010) and developed supplemental design guidance that includes where approach speeds are greater than 30 mph. Maryland State Highway Administration’s Roundabout Design Guidelines (Maryland State Highway Administration 2012) also notes that post-construction speed studies shall be performed to confirm that all constructed roundabouts with approach speeds of greater than 30 mph are exhibiting the desired deceleration characteristics. Maryland State Highway Administration also highlights the importance of coordinating with District Traffic Offices and the Travel Forecasting and Analysis division to select an appropriate design vehicle. For most situations, a WB-67 is preferred although there may
be special circumstances. Performance checks in Maryland include fastest path, vehicle speed estimation, stopping sight distance, and intersection sight distance (Maryland State Highway Administration 2012).
Both Ohio DOT (2024c) and North Carolina DOT (2023b) reference the updated NCHRP Research Report 1043: Guide for Roundabouts in their design resources. NCHRP Report 1043: Guide for Roundabouts (Kittelson & Associates 2023) was published in 2023 as an update to NCHRP Report 672: Roundabouts: An Informational Guide. Like other DOTs, Ohio DOT also recommends a phased approach for locations that warrant multi-lane designs in the future but where a single lane is acceptable now and provides information on expansion techniques. They note benefits to improving safety and driver/public acceptance with this approach (Ohio DOT 2024c).
Systemic Application of Multiple Low-Cost Countermeasures at Stop-Controlled Intersections
Between 2008 and 2013, FHWA collaborated with 20 states to help develop intersection safety improvement plans using the systemic approach (FHWA 2017b, FHWA 2020c). Many ultimately included recommendations for low-cost countermeasures at stop-controlled intersections. Most notably, South Carolina implemented such countermeasures at over 400 intersections with the program. A safety evaluation of the signing and pavement marking intersection improvements in South Carolina found CMF values of 0.917 (total crashes) and 0.899 (fatal and injury crashes) for stop-controlled intersections. The Louisiana Department of Transportation and Development saw similar success with the program. They installed low-cost safety treatments at 89 stop-controlled intersections across the state and noted a 56% reduction in fatal and injury crashes at three-legged intersections and a 64% reduction in fatal and injury crashes at four-legged intersections.
Minimal resources from DOTs were found regarding the systemic application of multiple low-cost countermeasures at stop-controlled intersections. Some DOTs, such as Ohio DOT and West Virginia DOT, have developed standards for retroreflective sheeting on signposts (see Figure 53).
Ohio DOT notes that red signpost reflectors shall be installed with all post-mounted stop, yield, do not enter, and wrong way signs. Other requirements exist for yellow signpost reflectors (Ohio DOT 2024a).
West Virginia DOT notes that retroreflective sheeting is typically installed on stop signs on exit ramps diverging from roadways with posted speed 50 mph or greater and multiple through lanes in each direction, and all stop signs at intersections where one of the intersecting roadways has multiple through lanes in each direction and posted speed of 50 mph or greater. Red retroreflective strips are also required for all yield, do not enter, and wrong way signs. Other requirements exist for fluorescent white, yellow, and yellow-green strips (West Virginia DOT 2021).
Although not limited to intersections only, VTrans advertises their roadside vegetation management program that can help with sight distance (VTrans n.d.c.). In 2022, Connecticut DOT published a press release detailing plans to systemically implement low-cost countermeasures at 173 stop-controlled intersections across the state, but details were not provided regarding status or results of project (Connecticut DOT 2022a).
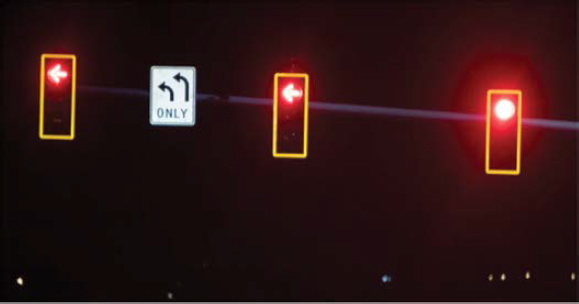
Yellow Change Intervals
Several state DOTs have recognized the safety benefits of accurately timed yellow change intervals (see example photo in Figure 54), including Connecticut DOT and Texas DOT. In late 2023, Connecticut DOT announced a plan to re-evaluate the yellow and red change interval timings for existing municipal-owned traffic control signals in the state. This came after the success they experienced by re-evaluating timing on their state-owned signals, citing a nearly 50% reduction in red light running and crash reductions (Connecticut DOT 2023b).
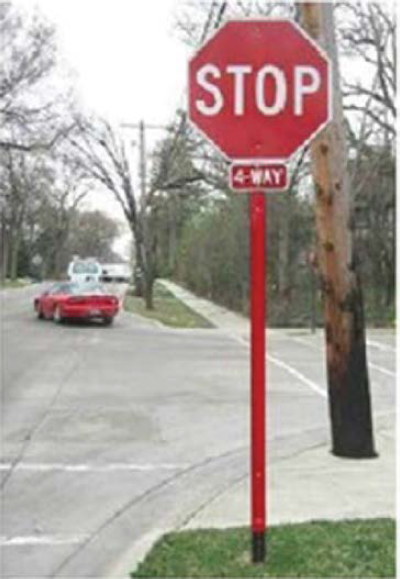
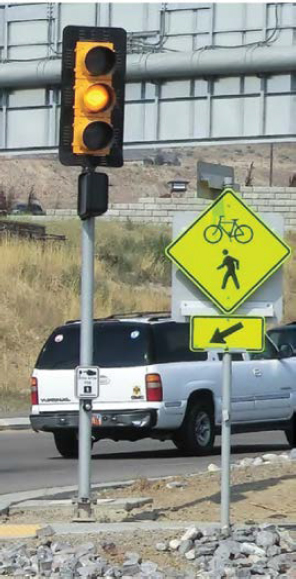
The city of Denton, Texas performed an experiment at one of its signalized intersections with a record-high level of red light running. After increasing the yellow light time by 1.0 second, the intersection reduced the occurrence of red light running by over one half (Gilboy 2019).
Many DOTs provide guidance for calculating yellow change intervals that references Formula 3.6-1 of the Institute of Transportation Engineers’ (ITE) Traffic Engineering Handbook (Wolshon and Pande 2016). These include Florida DOT (2017b), the Kentucky Transportation Cabinet (2021), Pennsylvania DOT (2010), Rhode Island DOT (2004), Texas DOT (2011a), and Wisconsin DOT (2004). In accordance with ITE, state DOTs generally agree that the yellow change interval should be no less than 3.0 seconds and no greater than 6.0 seconds, although some states have developed stricter preferences to be used where feasible. For example, the Kentucky Transportation Cabinet states that yellow change intervals for through movements should normally be between 3.5 and 5.0 seconds; however, intervals as low as 3.0 seconds and as high as 6.0 seconds may be used based on engineering judgment (Kentucky Transportation Cabinet 2021).
In 2012, the Transportation Research Board published NCHRP Report 731: Guidelines for Timing Yellow and All-Red Intervals at Signalized Intersections (McGee et al. 2012), which provided additional guidance for calculating yellow change intervals. This resource includes recommendations for the speed, grade, and intersection width variables. State DOTs such as Tennessee DOT (2020b) and VTrans (2020a) reference both the ITE formula and NCHRP Report 731 for yellow change interval calculations.
State DOTs including Ohio DOT and South Carolina DOT have developed Excel spreadsheet tools to help streamline the calculations for engineers. These spreadsheets can be found on their websites (Ohio DOT 2024d; South Carolina DOT 2021b).
A few additional findings that are specific to certain states include the following:
- Florida DOT recommends using a perception-reaction time of 1.4 seconds, citing recent research in this space. The exact research report was not provided (Florida DOT 2017b).
- New Jersey DOT recognizes the ITE formula but uses a simplified, conservative form where the yellow change (in seconds) equals speed (in mph) divided by 10 (New Jersey DOT n.d.b.).
Crosscutting
Lighting
DOT guidance documents for lighting address topics such as warrants and lighting design areas. Some examples of DOT practices include the following:
- Indiana DOT specifies criteria for when lighting should be considered based on factors such as the night-to-day ratio of crashes, cost effectiveness, and locations with a high potential for crashes (Indiana DOT 2022a).
- New Jersey DOT requires the completion of a form to assess the need for lighting at locations that meet the AASHTO warrants for lighting (New Jersey DOT 2015).
- Ohio DOT has developed state-specific warrants for freeway and interchange lighting based on factors such as ADT, number of lanes, interchange spacing, and interchange type (Ohio DOT 2024a).
- Washington State DOT specifies required lighting design areas for various types of facilities, such as basic intersections, roundabouts, diverging diamond interchanges (see Figure 55), transit stops, railroad crossings, ramps, and rest areas (Washington State DOT 2023).
An example of roadway lighting is shown in Figure 56.
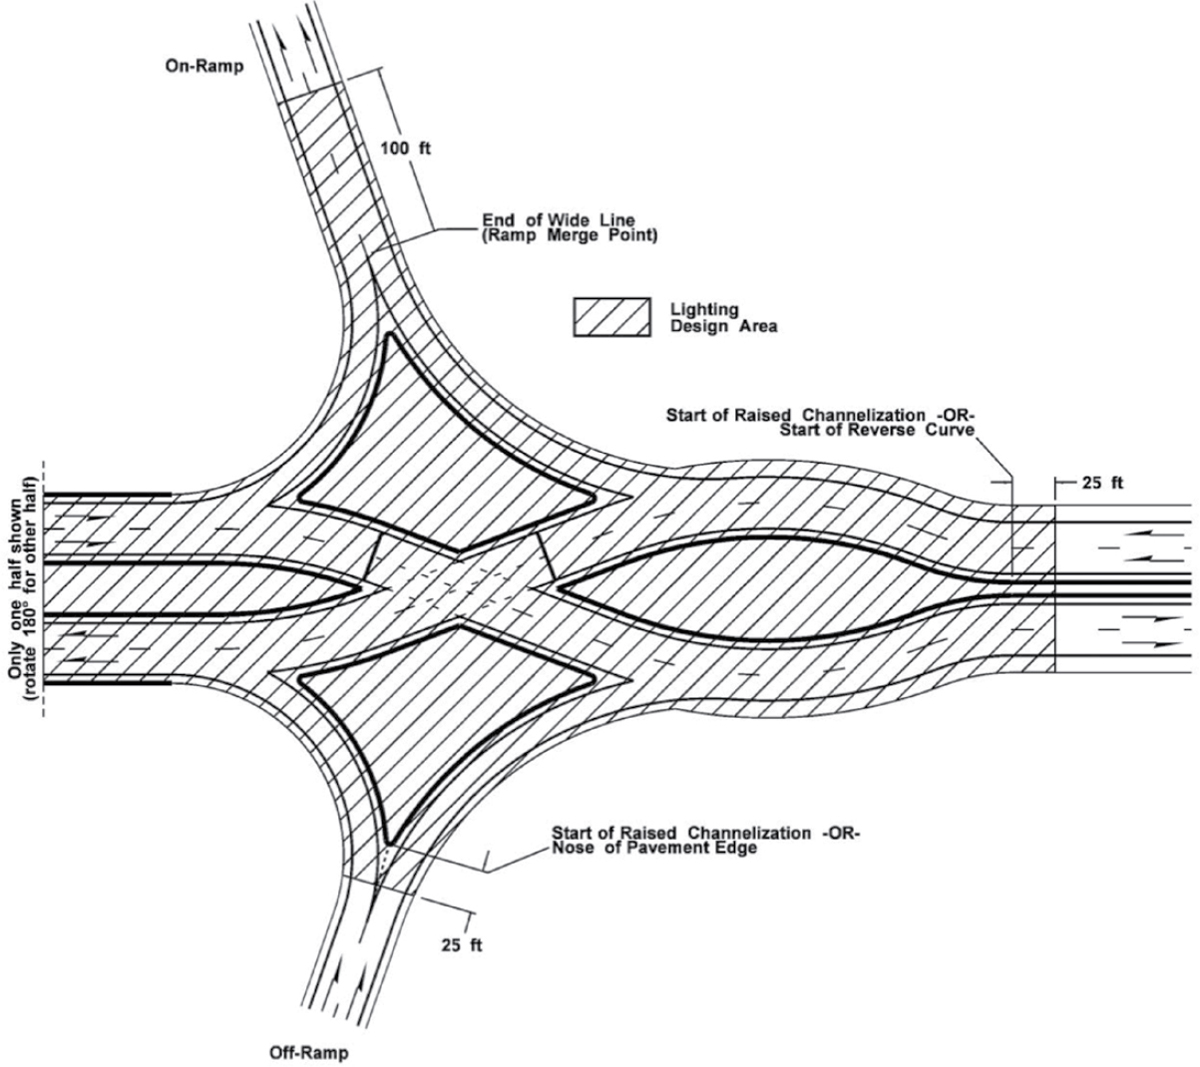
Research has shown nighttime crash reductions of 33% to 38% associated with the use of lighting (Elvik and Vaa 2004; Ye et al. 2009).
Local Road Safety Plans
DOT resources for LRSPs address procedures and guidance. Example DOT procedures are summarized as follows:
- Alabama DOT prioritizes project applications for these safety countermeasures in descending order: reducing the potential for drivers to leave their lane, reducing the potential of crashes when drivers leave their lane, and reducing crash severity (Alabama DOT 2023). Alabama DOT’s LRSP program covers various types of safety projects (e.g., SafetyEdge, rumble strips, enhanced curve signing, HFST).

- Nevada DOT provides a link to a form that local agencies can use to indicate interest in LRSPs, with allocation of funds on a first-come, first-served basis (Nevada DOT n.d.a.).
Guidance on LRSPs is available from several DOTs.
- Ohio DOT provides an LRSP report template organized into sections that cover the following topics: introduction, safety partners, existing conditions, prioritized focus areas, and implementation and action plan (Ohio DOT 2021). Emphasis areas for Ohio DOT are shown in Figure 57.
- Washington State DOT provides a seven-step process and associated plan elements for the development of LRSPs (Washington State DOT 2021).
- Massachusetts DOT published a primer on safety action planning in 2024. The primer covers topics such as goal setting, safety analysis, goal setting, strategy, and project selections (see example in Figure 58), and monitoring of plan implementation (Massachusetts DOT 2024).
According to FHWA’s PSC information page for LRSPs, Minnesota experienced a 25% reduction in county road fatalities after the implementation of LRSPs (Albee and Bobitz 2021).
Pavement Friction Management
DOT guidance for the use of HFST covers various topics such as criteria for use, pavement surface preparation, materials, and performance. Example DOT practices for HFST include the following:
- Florida DOT’s guidelines on HFST include a table with criteria for when to use and when not to use HFST based on roadway applications and pavement conditions (Florida DOT n.d.a.). The guidelines provide an overview of materials used for HFST and emphasize the importance of proper preparation of the pavement surface and mixing and application. Failure mechanisms include aggregate loss, delamination, uncured binder failure, and substrate failure. As noted in the Florida DOT guidelines, HFST has reduced wet weather crashes on tight curves by 75%.
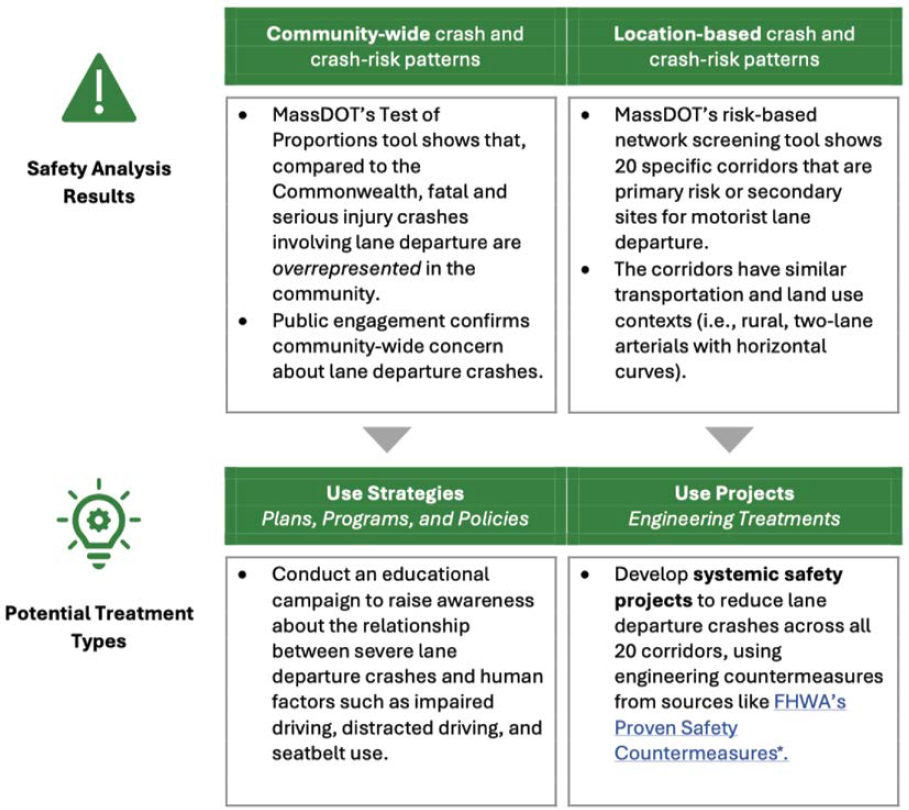
- Georgia DOT tested a market-ready safety assessment device with an electronic ball bank indicator instead of a traditional ball bank indicator to identify potential locations for the installation of HFST (FHWA 2020a).
- New Jersey DOT’s guidance on HFST indicates that pavement should be in good condition to be considered for HFST (New Jersey DOT n.d.a.). The maximum age of pavement should be 2 years for asphalt pavement and 10 years for concrete pavement. In addition, HFST should not be placed on surface treatments with a thickness of less than 1 inch (New Jersey DOT n.d.a.). Figure 59 shows an example of HFST on asphalt pavement.
- South Dakota DOT only applies HFST at isolated locations (e.g., horizontal curves, bridge decks, and intersections) because of cost considerations (South Dakota DOT 2023). South Dakota DOT has observed an 80% reduction in road departure crashes (with winter road conditions as a contributing factor) because of the use of HFST at over 30 locations.
- Wisconsin DOT’s guidance indicates that HFST is the preferred method for enhancing pavement friction to mitigate roadway departure crashes at spot locations (Wisconsin DOT 2023a). Example factors utilized to assess the need for HFST include crash locations, driver speeds, heavy vehicle use, and the presence of intersections. A two-layer application is required for bridge decks. A table of suggested HFST placement distances in advance of the curve based on approach speed and curve advisory speed is provided.
An evaluation of HFST sponsored by FHWA found a CMF of 0.515 for injury crashes on curves and benefit-cost ratio of 6.0:1 for total crashes on curves (Merritt et al. 2020). The evaluation was based on data from Kentucky, Pennsylvania, and West Virginia. A safety assessment of HFST using Pennsylvania data found CMF values of 0.444 for total crashes and 0.500 for fatal injury crashes (Gayah et al. 2024).
Road Safety Audit
An NCHRP synthesis on RSAs, NCHRP Synthesis 615: DOT Practices on Road Safety Audits, was completed in 2024 (Brown et al. 2024). The synthesis found that DOTs typically follow the eight-step process for RSAs from FHWA (FHWA 2006) and sometimes make modifications to this process. As noted in the synthesis, examples of other processes utilized by DOTs include walkability RSAs that emphasize pedestrian safety and health equity, minimal RSAs for paving projects, and group RSAs for the review of multiple project locations.
DOT guidelines address various aspects of RSAs, such as the selection of RSA projects or locations, RSA processes, and funding. Some example DOT practices are noted as follows:
- Massachusetts DOT requires RSAs for projects located in or adjacent to a High Crash Cluster or projects with HSIP funding (Massachusetts DOT 2015a).
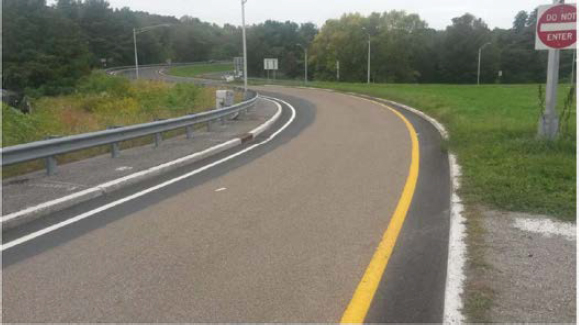
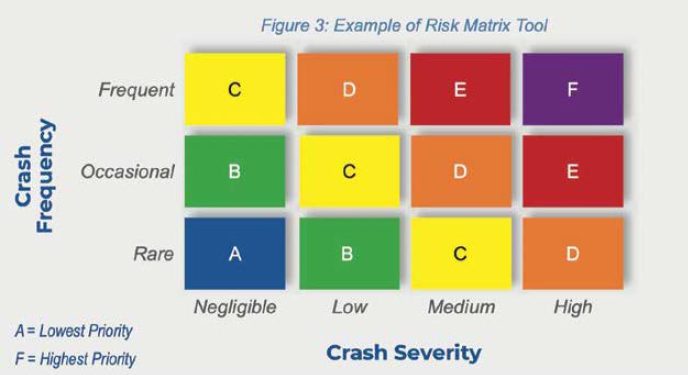
- Factors considered by South Carolina DOT in the process of prioritizing RSA potential locations include fatal and serious injury crashes, financial viability, and public safety (South Carolina DOT 2018a). A list of candidate locations is generated based on the 1-mile segments with the highest number of fatal and serious injury crashes.
- Michigan DOT’s guidance provides lists of types of projects for which RSAs are required (e.g., environmental impact statements, new construction/reconstruction rural non-freeway projects on the 5% transparency list or high crash list) or optional (e.g., corridor access management and resurfacing, restoration, and rehabilitation urban freeway non-interchange projects) (Michigan DOT 2016a).
- New Mexico DOT suggests the use of a risk matrix (see Figure 60) as one tool to help prioritize countermeasures on an RSA (New Mexico DOT 2024).
Benefit-cost ratios for implemented countermeasures for five RSA sites ranged from 1.2:1 to 116:1 in an evaluation of RSA programs and projects from FHWA (Nabors et al. 2012).


