Implementation of Federal Highway Administration Proven Safety Countermeasures (2025)
Chapter: 3 Survey Results
CHAPTER 3
Survey Results
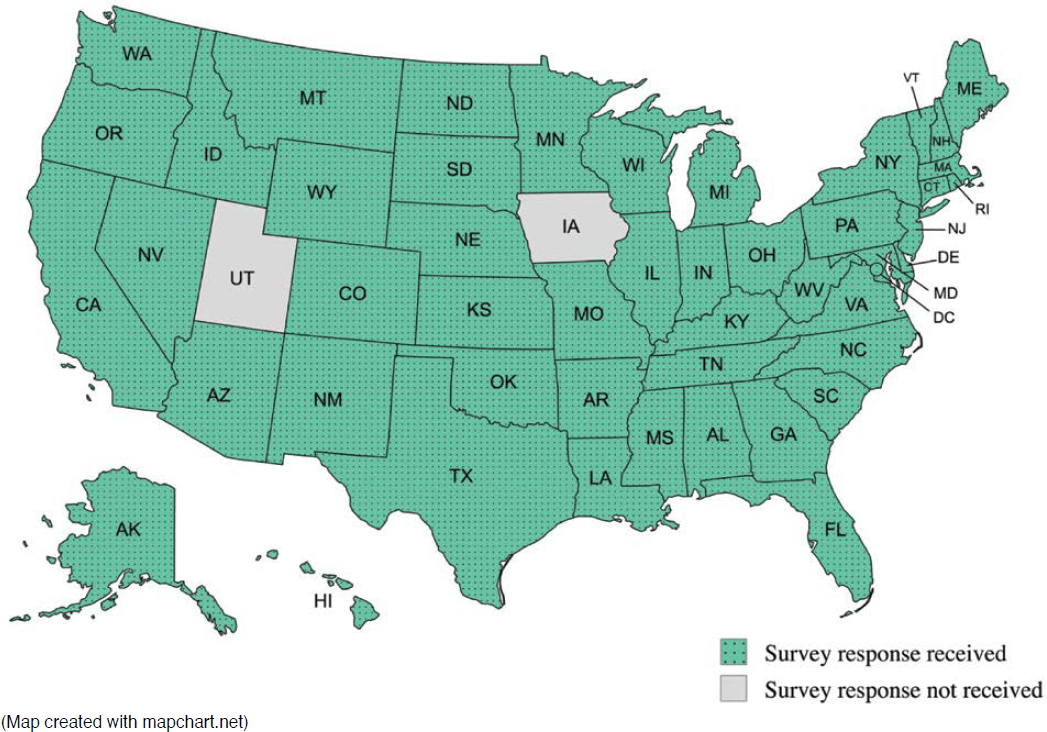
A survey was developed and administered to gain greater understanding of the state of the practice for the use of FHWA PSCs in the United States. The survey, which included 14 questions, was reviewed by the topic panel before being sent to each DOT via Qualtrics Survey Software (Qualtrics 2024). The survey was sent to one respondent from each DOT. The contact list for the survey was primarily developed based on the membership list of the AASHTO Committee on Safety, and an effort was made to identify the appropriate person at each DOT to complete the survey. In addition, respondents were encouraged to collaborate with others at their DOT and to forward the survey to the staff who would be most capable of answering the questions and providing the most accurate information. Responses were received from 49 DOTs for a response rate of 96%. A map showing the survey respondents is provided in Figure 61.
Topics related to FHWA PSCs that were covered by the survey include the extent of implementation of each FHWA PSC, frequency of consideration and use, resources and evaluation studies, implementation challenges, and modifications and implementation strategies. The survey utilized skip logic and display logic to show pertinent questions and answer choices based on previous responses. In some cases, responding DOTs did not answer all the answer choices shown for each question. Several of the multiple-choice questions included an option for “other” with a text entry field. A copy of the full survey can be found in Appendix A. A list of responding DOTs and survey responses, including other text responses and resources submitted, are provided in Appendix B.
This chapter is organized into the following sections: Extent of Use of FHWA PSCs by DOTs (survey questions 1–3), DOT Challenges to Implementing FHWA PSCs (survey questions 4, 10, 11, 14), DOT Modifications or Strategies for FHWA PSCs (survey question 7), Implementation Considerations of FHWA PSCs by DOTs (survey questions 8 and 9), DOT Resources and Evaluation Studies for FHWA PSCs (survey questions 5, 6, and 12), and Participation in Case Example (survey question 13). Key survey findings are summarized at the end of this chapter by topic and by FHWA PSC.
Survey Results for Extent of Use of FHWA PSCs by DOTs
Questions 1–3 of the survey sought information from DOTs regarding levels of implementation and frequency of use or consideration for FHWA PSCs. Question 1 asked about the implementation stage for each FHWA PSC. The definitions of the implementation stages used for the survey include the following:
- Not Implemented - The state has not started planning to use the FHWA PSC.
- Development Stage - The state is developing an implementation process and building support by participating in webinars and peer exchanges and collecting guidance and best practices.
- Demonstration Stage - The state is testing/piloting the FHWA PSC.
- Assessment Stage - The state is assessing the performance of the FHWA PSC and adjusting any processes for deployment.
- Institutionalized - The state has adopted the FHWA PSC and uses it to some extent.
An FHWA PSC that is Institutionalized may or may not be Standard Practice for a given DOT.
The results for Question 1, regarding the implementation stage for each PSC, are shown in Table 4. The results indicate that the FHWA PSCs most frequently categorized as Institutionalized by responding DOTs are longitudinal rumble strips and stripes on two-lane roads, median barriers, enhanced delineation for horizontal curves, and roundabouts. The most prevalent FHWA PSCs for the other implementation stages are
- Not Implemented: SSCs and VSLs;
- Development Stage: appropriate speed limits for all users and reduced left-turn conflict intersections;
- Demonstration Stage: LPI and corridor access management; and
- Assessment Stage: systemic application of multiple low-cost countermeasures at stop-controlled intersections and medians and pedestrian refuge islands in urban and suburban areas.
The values of the average stage index, shown in Table 4 and Figure 62, are the highest for longitudinal rumble strips and stripes on two-lane roads, roundabouts, and dedicated left- and right-turn lanes at intersections (indicating a higher level of implementation) and lowest for appropriate speed limits for all road users, VSLs, and SSCs (indicating a lower level of implementation).
Table 4. Implementation stage of each FHWA PSC (Question 1).
| FHWA PSC | Not Implemented | Development Stage | Demo. Stage | Assessment Stage | Institutionalized | Average Stage Index* | Total Responses |
|---|---|---|---|---|---|---|---|
| Longitudinal Rumble Strips and Stripes on Two-Lane Roads | 0 | 1 | 0 | 4 | 43 | 3.85 | 48 |
| Roundabouts | 0 | 0 | 1 | 7 | 39 | 3.81 | 47 |
| Median Barriers | 0 | 2 | 1 | 3 | 41 | 3.77 | 47 |
| Enhanced Delineation for Horizontal Curves | 0 | 3 | 2 | 4 | 39 | 3.65 | 48 |
| Dedicated Left- and Right-Turn Lanes at Intersections | 0 | 3 | 4 | 4 | 37 | 3.56 | 48 |
| Backplates with Retroreflective Borders | 2 | 2 | 1 | 5 | 38 | 3.56 | 48 |
| RRFBs | 0 | 3 | 6 | 6 | 33 | 3.44 | 48 |
| Crosswalk Visibility Enhancements | 1 | 2 | 9 | 4 | 32 | 3.33 | 48 |
| RSA | 3 | 4 | 5 | 2 | 34 | 3.25 | 48 |
| Walkways | 3 | 6 | 1 | 6 | 31 | 3.19 | 47 |
| Road Diets (Roadway Configuration) | 2 | 3 | 7 | 9 | 27 | 3.17 | 48 |
| Roadside Design Improvements at Curves | 2 | 6 | 4 | 6 | 29 | 3.15 | 47 |
| Yellow Change Intervals | 4 | 6 | 2 | 2 | 33 | 3.15 | 47 |
| Lighting | 2 | 6 | 7 | 2 | 31 | 3.13 | 48 |
| Systemic Application of Multiple Low-Cost Countermeasures at Stop-Controlled Intersections | 1 | 6 | 5 | 11 | 25 | 3.10 | 48 |
| Medians and Pedestrian Refuge Islands in Urban and Suburban Areas | 1 | 7 | 4 | 11 | 25 | 3.08 | 48 |
| Wider Edge Lines | 2 | 5 | 9 | 4 | 27 | 3.04 | 47 |
| Bicycle Lanes | 4 | 4 | 8 | 4 | 28 | 3.00 | 48 |
| Corridor Access Management | 1 | 5 | 10 | 8 | 23 | 3.00 | 47 |
| SafetyEdge | 9 | 5 | 1 | 0 | 32 | 2.87 | 47 |
| Pavement Friction Management | 4 | 5 | 8 | 7 | 23 | 2.85 | 47 |
| PHBs | 7 | 4 | 8 | 2 | 26 | 2.77 | 47 |
| LRSPs | 3 | 9 | 8 | 5 | 21 | 2.70 | 46 |
| Reduced Left-Turn Conflict Intersections | 5 | 11 | 4 | 7 | 21 | 2.58 | 48 |
| LPI | 8 | 3 | 11 | 6 | 20 | 2.56 | 48 |
| Appropriate Speed Limits for All Road Users | 13 | 14 | 4 | 1 | 16 | 1.85 | 48 |
| VSLs | 21 | 7 | 6 | 8 | 6 | 1.40 | 48 |
| SSCs | 29 | 6 | 4 | 0 | 8 | 0.98 | 47 |
| Average Across All 28 FHWA PSCs | 4.54 | 4.93 | 5.00 | 4.93 | 28.14 | 2.99 | 47.5 |
* Calculated based on these values: 0 = Not Implemented, 1 = Development Stage, 2 = Demonstration Stage, 3 = Assessment Stage, 4 = Institutionalized.
NOTE: Demo. = Demonstration, Sort order = Average Stage Index (high to low).
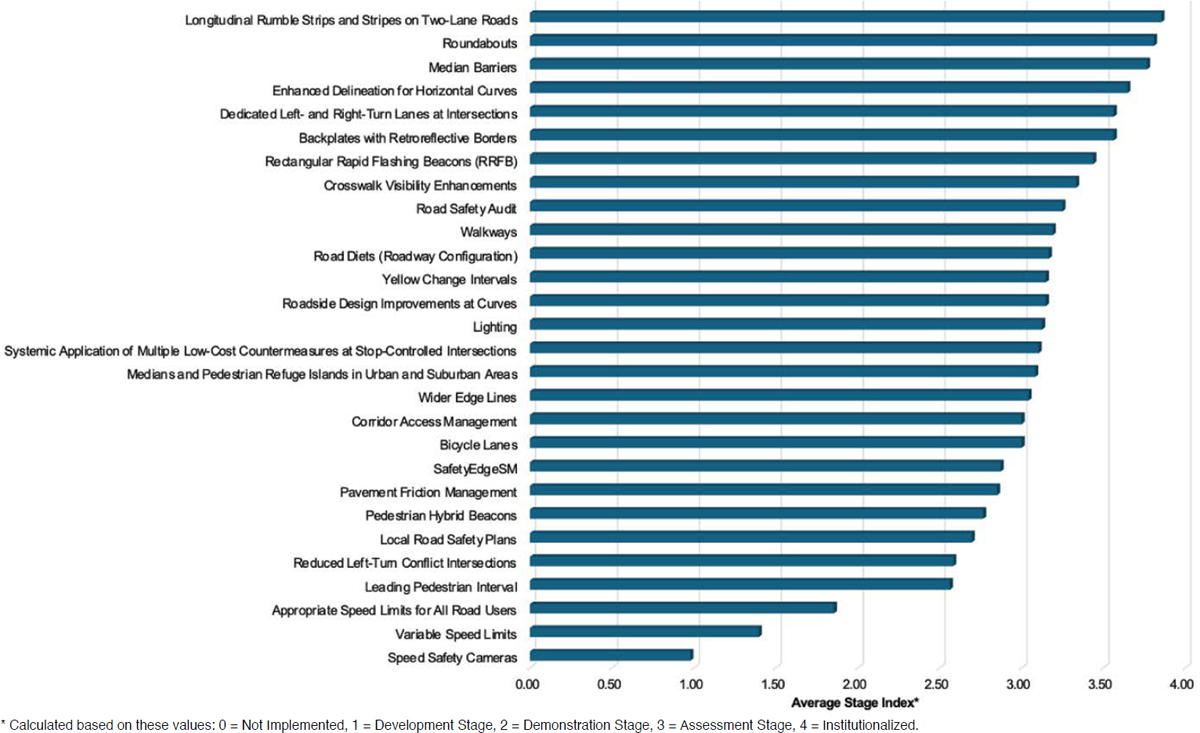
The average number of responses by implementation stage across all 28 FHWA PSCs, shown in the bottom row of Table 4, indicates a high overall level of implementation of FHWA PSCs, as the highest average number of responses is for the Institutionalized stage. The overall average stage index across all 28 FHWA PSCs is 2.99, indicating that responding DOTs are overall at the assessment stage for FHWA PSCs.
The total responses by PSC shown in Table 4 do not equal 49 DOTs for each PSC because some DOTs did not answer the question for each PSC.
Question 2 of the survey focused on the frequency of use of FHWA PSCs that are Institutionalized by DOTs. As shown in Table 5, longitudinal rumble strips and stripes on two-lane
Table 5. Frequency of use of Institutionalized FHWA PSCs (Question 2).
| FHWA PSC | Standard Practice (May Be Based on Predefined Criteria) | Often | Sometimes | Rarely | Other | Average Use Index* | Total Responses |
|---|---|---|---|---|---|---|---|
| Yellow Change Intervals | 27 | 4 | 2 | 0 | 0 | 3.76 | 33 |
| SafetyEdge | 26 | 2 | 4 | 0 | 0 | 3.69 | 32 |
| Backplates with Retroreflective Borders | 30 | 4 | 4 | 0 | 0 | 3.68 | 38 |
| Wider Edge Lines | 21 | 2 | 4 | 0 | 0 | 3.63 | 27 |
| Longitudinal Rumble Strips and Stripes on Two-Lane Roads | 30 | 9 | 4 | 0 | 0 | 3.60 | 43 |
| Appropriate Speed Limits for All Road Users | 11 | 3 | 2 | 0 | 0 | 3.56 | 16 |
| Dedicated Left- and Right-Turn Lanes at Intersections | 19 | 16 | 2 | 0 | 0 | 3.46 | 37 |
| Enhanced Delineation for Horizontal Curves | 20 | 14 | 4 | 0 | 0 | 3.42 | 38 |
| Median Barriers | 21 | 13 | 6 | 0 | 0 | 3.38 | 40 |
| SSCs | 2 | 0 | 1 | 0 | 5 | 3.33 | 8 |
| Systemic Application of Multiple Low-Cost Countermeasures at Stop-Controlled Intersections | 11 | 9 | 4 | 0 | 1 | 3.29 | 25 |
| Crosswalk Visibility Enhancements | 14 | 12 | 6 | 0 | 0 | 3.25 | 32 |
| Lighting | 16 | 9 | 3 | 3 | 0 | 3.23 | 31 |
| Walkways | 13 | 12 | 5 | 1 | 0 | 3.19 | 31 |
| Pavement Friction Management | 11 | 5 | 5 | 1 | 1 | 3.18 | 23 |
| LPI | 9 | 4 | 5 | 1 | 0 | 3.11 | 19 |
| LRSPs | 7 | 7 | 5 | 0 | 2 | 3.11 | 21 |
| Roundabouts | 14 | 15 | 9 | 1 | 0 | 3.08 | 39 |
| Bicycle Lanes | 10 | 6 | 10 | 0 | 1 | 3.00 | 27 |
| RSA | 13 | 8 | 12 | 1 | 0 | 2.97 | 34 |
| Roadside Design Improvements at Curves | 10 | 10 | 6 | 3 | 0 | 2.93 | 29 |
| Corridor Access Management | 7 | 7 | 7 | 1 | 1 | 2.91 | 23 |
| VSLs | 3 | 1 | 0 | 2 | 0 | 2.83 | 6 |
| Reduced Left-Turn Conflict Intersections | 5 | 8 | 7 | 1 | 0 | 2.81 | 21 |
| Medians and Pedestrian Refuge Islands in Urban and Suburban Areas | 7 | 6 | 11 | 1 | 0 | 2.76 | 25 |
| RRFBs | 9 | 6 | 16 | 2 | 0 | 2.67 | 33 |
| Road Diets (Roadway Configuration) | 5 | 7 | 13 | 2 | 0 | 2.56 | 27 |
| PHBs | 7 | 2 | 12 | 5 | 0 | 2.42 | 26 |
| Average across all 28 FHWA PSCs | 13.50 | 7.18 | 6.04 | 0.89 | 0.39 | - | 28.0 |
* Calculated based on these values: 1 = Rarely, 2 = Sometimes, 3 = Often, 4 = Standard Practice (May Be Based on Predefined Criteria); Excludes Other.
NOTE: Sort order = Average Use Index (high to low).
roads and backplates with retroreflective borders are each implemented as standard practice by 30 responding DOTs. Yellow change intervals are standard practice for 27 responding DOTs, while SafetyEdge is standard practice for 26 responding DOTs. The most prevalent FHWA PSCs in the other categories for frequency of use are
- Often: dedicated left- and right-turn lanes at intersections and roundabouts;
- Sometimes: RRFBs and road diets; and
- Rarely: PHBs.
In the other text responses, three DOTs noted the existence of legislation to allow the use of SSCs by state or local agencies.
The values of the average use index, shown in Table 5 and Figure 63, are the highest for yellow change intervals, SafetyEdge, and backplates with retroreflective borders (indicating a higher level of use) and lowest for RRFBs, road diets, and PHBs (indicating a lower level of use).
The average number of responses across all 28 FHWA PSCs, shown in the bottom row of Table 5, indicates a high overall level of use of FHWA PSCs, as responding DOTs deploy an average of 13.5 FHWA PSCs as standard practice.
Question 3 asked DOTs to select up to five FHWA PSCs (categorized as Institutionalized but not Standard Practice for a given DOT based on the responses to Questions 1 and 2) that are most frequently considered for use on projects. As shown in Table 6, the FHWA PSCs most frequently considered by responding DOTs are enhanced delineation for horizontal curves, roundabouts, and crosswalk visibility enhancements.
Survey Results for DOT Challenges to Implementing FHWA PSCs
Questions 4, 10, 11, and 14 sought information regarding challenges encountered by DOTs in implementing FHWA PSCs. The results for Question 4, concerning factors that hinder implementation of FHWA PSCs (categorized as Not Implemented, Development Stage, or Demonstration Stage), are shown in Table 7. SSCs, VSLs, and appropriate speed limits for all road users were cited most frequently by responding DOTs for factors that hinder efforts to implement FHWA PSCs, while longitudinal rumble strips and stripes on two-lane roads and roundabouts were cited least frequently. The most frequently cited FHWA PSCs for each factor are
- Staffing or Funding Constraints: lighting and LRSPs;
- Implementation Concerns: VSLs, appropriate speed limits for all road users, SSCs, and reduced left-turn conflict intersections;
- Lack of Available Guidance: appropriate speed limits for all road users;
- Lack of Information on Safety Benefits: SSCs and appropriate speed limits for all road users; and
- Regulatory Barriers: SSCs, VSLs, and appropriate speed limits for all road users.
Examples of other challenges noted in the text responses include the following:
- SSCs and VSLs: a need for legislative changes;
- PHBs: lack of pedestrian and bicyclist data to determine the need for PHBs;
- Reduced left-turn conflict intersections: lack of public support;
- Lighting: cost;
- Pavement friction management: material availability and cost; and
- Bicycle lanes, PHBs, and SafetyEdge: maintenance concerns.
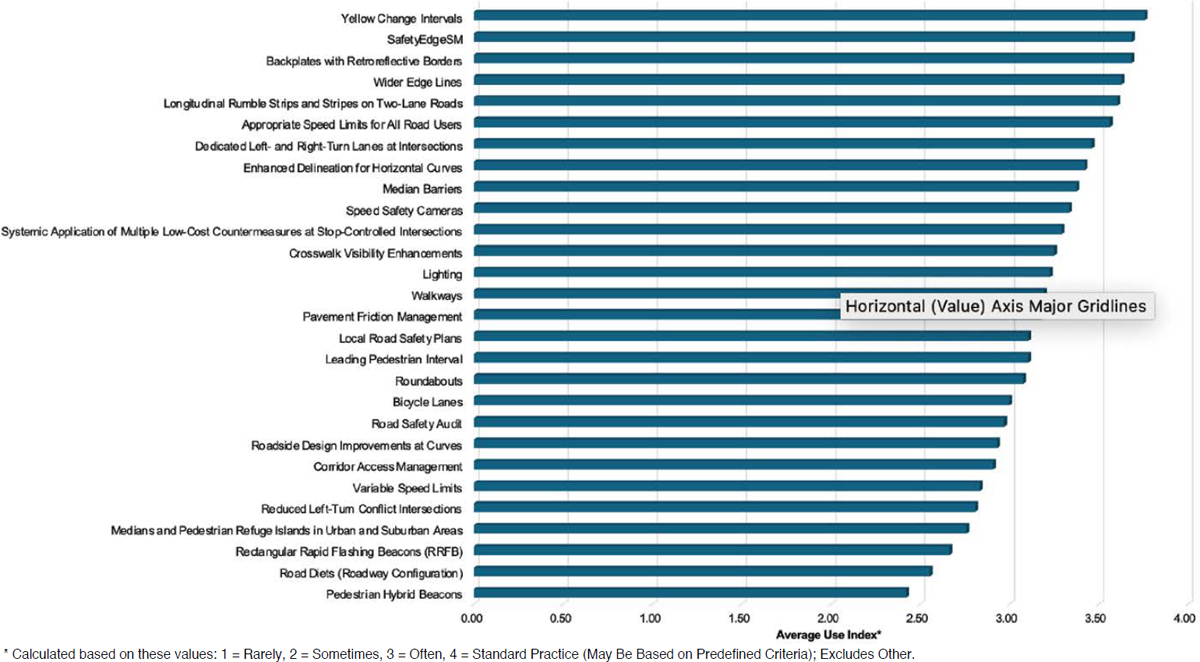
Table 6. Most frequently considered FHWA PSCs that are Institutionalized (but not Standard Practice) (Question 3).
| FHWA PSC | Count |
|---|---|
| Enhanced Delineation for Horizontal Curves | 14 |
| Roundabouts | 14 |
| Crosswalk Visibility Enhancements | 12 |
| Longitudinal Rumble Strips and Stripes on Two-Lane Roads | 10 |
| Road Diets (Roadway Configuration) | 8 |
| Dedicated Left- and Right-Turn Lanes at Intersections | 8 |
| Lighting | 8 |
| Walkways | 7 |
| Median Barriers | 7 |
| Roadside Design Improvements at Curves | 7 |
| Reduced Left-Turn Conflict Intersections | 7 |
| Bicycle Lanes | 6 |
| RRFBs | 6 |
| Systemic Application of Multiple Low-Cost Countermeasures at Stop-Controlled Intersections | 6 |
| RSA | 6 |
| LPI | 5 |
| Backplates with Retroreflective Borders | 5 |
| Corridor Access Management | 4 |
| Medians and Pedestrian Refuge Islands in Urban and Suburban Areas | 3 |
| SafetyEdge | 3 |
| Wider Edge Lines | 2 |
| LRSPs | 2 |
| Pavement Friction Management | 2 |
| Appropriate Speed Limits for All Road Users | 1 |
| PHBs | 1 |
| SSCs | 0 |
| VSLs | 0 |
| Yellow Change Intervals | 0 |
| Number of DOTs Responded | 42 |
NOTES: Respondents could select up to five FHWA PSCs for this question. Sort order = Count (high to low).
The results for this question indicate that responding DOTs perceive a wide range of factors as challenges to the implementation of the FHWA PSCs related to speed management. In general, implementation concerns are perceived by responding DOTs as the greatest challenge to the use of FHWA PSCs.
Questions 10 and 11 related to FHWA PSCs that DOTs have stopped implementing and the results of this are provided in Table 8. Twenty-nine responding DOTs indicated that they have not stopped using any FHWA PSCs, and responding DOTs reported that they have stopped using seven of the 28 FHWA PSCs. Four responding DOTs indicated that they no longer use each of the following FHWA PSCs: SSCs, VSLs, PHBs, and pavement friction management. Some responding DOTs also have stopped using appropriate speed limits for all users, SafetyEdge, and backplates with retroreflective borders.
Results for the factors contributing to the cessation of use of FHWA PSCs are shown in Table 8. These results show that stakeholder concerns were noted as a factor for all seven FHWA PSCs except for SafetyEdge. Lack of information on benefits was only noted as a factor for one FHWA PSC (VSLs). FHWA PSCs cited for the other answer choices are
- Increased emphasis on other Safety Countermeasures (SC) or initiatives: VSLs and backplates with retroreflective borders; and
- Cost to implement: VSLs, SafetyEdge, backplates with retroreflective borders, and pavement friction management.
Table 7. Factors that hinder efforts to implement FHWA PSCs (Not Implemented, Development Stage, or Demonstration Stage) (Question 4).
| FHWA PSC | Staffing or Funding Constraints | Implement. Concerns | Lack of Available Guidance | Lack of Info. on Safety Benefits | Reg. Barriers | Other | None | No. of DOTs with Factors that Hinder Implement.* | No. DOTs Responded |
|---|---|---|---|---|---|---|---|---|---|
| SSCs | 5 | 13 | 2 | 1 | 33 | 2 | 2 | 37 | 39 |
| VSLs | 6 | 19 | 3 | 6 | 13 | 5 | 1 | 32 | 33 |
| Appropriate Speed Limits for All Road Users | 6 | 14 | 9 | 5 | 9 | 2 | 2 | 29 | 31 |
| Reduced Left-Turn Conflict Intersections | 7 | 11 | 3 | 0 | 0 | 5 | 2 | 19 | 21 |
| LPI | 3 | 10 | 3 | 2 | 1 | 0 | 7 | 12 | 19 |
| PHBs | 4 | 10 | 1 | 1 | 2 | 6 | 5 | 14 | 19 |
| Pavement Friction Management | 7 | 10 | 3 | 3 | 0 | 1 | 3 | 15 | 18 |
| Corridor Access Management | 6 | 8 | 2 | 1 | 4 | 3 | 1 | 16 | 17 |
| LRSPs | 8 | 5 | 1 | 0 | 0 | 4 | 6 | 10 | 16 |
| Bicycle Lanes | 6 | 7 | 1 | 2 | 1 | 3 | 3 | 13 | 16 |
| SafetyEdge | 1 | 8 | 0 | 0 | 0 | 4 | 2 | 13 | 15 |
| Lighting | 8 | 2 | 2 | 1 | 4 | 3 | 3 | 12 | 15 |
| Wider Edge Lines | 7 | 5 | 1 | 1 | 0 | 3 | 5 | 10 | 15 |
| RSA | 7 | 3 | 2 | 0 | 1 | 2 | 3 | 9 | 12 |
| Systemic Application of Multiple Low-Cost Countermeasures at Stop-Controlled Intersections | 4 | 4 | 1 | 1 | 0 | 2 | 2 | 10 | 12 |
| Road Diets (Roadway Configuration) | 1 | 7 | 0 | 1 | 1 | 0 | 4 | 8 | 12 |
| Yellow Change Intervals | 2 | 4 | 0 | 1 | 0 | 4 | 4 | 7 | 11 |
| Medians and Pedestrian Refuge Islands in Urban and Suburban Areas | 1 | 7 | 1 | 1 | 0 | 2 | 3 | 8 | 11 |
| Roadside Design Improvements at Curves | 5 | 4 | 1 | 0 | 0 | 1 | 3 | 8 | 11 |
| Crosswalk Visibility Enhancements | 5 | 4 | 1 | 2 | 0 | 1 | 4 | 7 | 11 |
| RRFBs | 3 | 4 | 1 | 0 | 0 | 0 | 3 | 6 | 9 |
| Walkways | 2 | 3 | 0 | 1 | 2 | 3 | 3 | 6 | 9 |
| Dedicated Left- and Right-Turn Lanes at Intersections | 3 | 2 | 1 | 0 | 0 | 0 | 3 | 4 | 7 |
| Enhanced Delineation for Horizontal Curves | 1 | 3 | 0 | 0 | 0 | 0 | 2 | 3 | 5 |
| Backplates with Retroreflective Borders | 0 | 1 | 0 | 1 | 0 | 1 | 3 | 2 | 5 |
| Median Barriers | 1 | 1 | 1 | 1 | 0 | 1 | 1 | 2 | 3 |
| Longitudinal Rumble Strips and Stripes on Two-Lane Roads | 0 | 1 | 0 | 0 | 0 | 0 | 0 | 1 | 1 |
| Roundabouts | 0 | 1 | 0 | 0 | 0 | 0 | 0 | 1 | 1 |
* Number of DOTs Responded – None.
NOTE: Implement. = Implementation, Info. = Information, Reg. = Regulatory, No. = Number. Respondents could select multiple answers for each FHWA PSC. Sort order = Number of DOTs with Factors that Hinder Implementation (high to low).
Table 8. FHWA PSCs that DOTs have stopped using and factors contributing to DOTs’ decisions to stop using them (Questions 10 and 11).
| Answer Choice | Lack of Info. on Benefits | Increased Emphasis on Other SCs or Initiatives | Cost to Implement | Stakeholder Concerns | Other | No. DOTs Responded |
|---|---|---|---|---|---|---|
| Appropriate Speed Limits for All Road Users | 0 | 0 | 0 | 1 | 1 | 1 |
| SSCs | 0 | 0 | 0 | 2 | 3 | 4 |
| VSLs | 1 | 2 | 2 | 1 | 1 | 4 |
| PHBs | 0 | 0 | 0 | 4 | 2 | 4 |
| SafetyEdge | 0 | 0 | 1 | 0 | 1 | 2 |
| Backplates with Retroreflective Borders | 0 | 2 | 1 | 2 | 1 | 2 |
| Pavement Friction Management | 0 | 0 | 1 | 2 | 3 | 4 |
NOTE: Info. = Information, SC = Safety Countermeasure, No. = Number. Respondents could select multiple answers for each FHWA PSC. Only FHWA PSCs that DOTs have stopped using are shown in this table. Twenty-nine responding DOTs indicated that they have not stopped using any FHWA PSCs.
Factors described in the text responses include
- Appropriate speed limits for all users: results similar to current DOT process;
- VSLs: cost versus perceived benefit;
- SSCs: need for legislation;
- PHBs: potential for driver confusion;
- SafetyEdge: lack of adequate pavement thickness;
- Backplates with retroreflective borders: need for more research regarding safety outcomes; and
- Pavement friction treatment: delamination issues and adverse effects on the pavement life cycle.
Question 14 was designed for DOTs that have not implemented any FHWA PSCs; however, this question was not displayed to any respondents, as all responding DOTs have implemented at least one FHWA PSC to some extent.
Survey Results for DOT Modifications or Strategies for FHWA PSCs
The results for Question 7, regarding types of modifications or alternative strategies for FHWA PSCs (Development Stage, Demonstration Stage, Assessment Stage, or Institutionalized) are shown in Table 9. These results indicate that the most prevalent FHWA PSCs for each type of modification or alternative strategy are
- Physical Changes: roundabouts;
- Change in Approach or Method to Implement: appropriate speed limits for all road users, bicycle lanes, and backplates with retroreflective borders;
- Alternative Delivery Mechanisms or Funding Sources: systemic application of multiple low-cost countermeasures at stop-controlled intersections, enhanced delineation for horizontal curves, and backplates with retroreflective borders;
- Pilot Projects: RRFBs, SSCs, VSLs, and road diets;
- Change in Approach to Public Outreach: roundabouts, reduced left-turn conflict intersections, corridor access management, and road diets; and
- None: yellow change intervals, RSAs, and dedicated left- and right-turn lanes at intersections.
Table 9. Types of modifications or alternative strategies for FHWA PSCs (Development Stage, Demonstration Stage, Assessment Stage, or Institutionalized) (Question 7).
| FHWA PSC | Physical Changes | Change in Approach or Method to Implement | Alt. Delivery Mech. or Funding Sources | Pilot Projects | Change in Approach to Public Outreach | Other | None | No. of DOTs with Mods. or Alt. Strat. | No. DOTs Responded |
|---|---|---|---|---|---|---|---|---|---|
| Roundabouts | 11 | 7 | 6 | 7 | 15 | 1 | 12 | 28 | 40 |
| Road Diets (Roadway Configuration) | 10 | 7 | 5 | 8 | 12 | 2 | 14 | 25 | 39 |
| Longitudinal Rumble Strips and Stripes on Two-Lane Roads | 10 | 10 | 4 | 4 | 6 | 2 | 18 | 23 | 41 |
| RRFBs | 7 | 10 | 7 | 10 | 5 | 1 | 19 | 22 | 41 |
| Backplates with Retroreflective Borders | 6 | 11 | 8 | 5 | 1 | 2 | 17 | 22 | 39 |
| Crosswalk Visibility Enhancements | 10 | 10 | 6 | 7 | 5 | 3 | 19 | 21 | 40 |
| Enhanced Delineation for Horizontal Curves | 6 | 9 | 8 | 3 | 0 | 0 | 19 | 20 | 39 |
| Systemic Application of Multiple Low-Cost Countermeasures at Stop-Controlled Intersections | 6 | 8 | 9 | 5 | 2 | 0 | 19 | 20 | 39 |
| Bicycle Lanes | 9 | 11 | 3 | 4 | 9 | 3 | 16 | 19 | 35 |
| Reduced Left-Turn Conflict Intersections | 9 | 4 | 4 | 5 | 12 | 1 | 16 | 19 | 35 |
| Appropriate Speed Limits for All Road Users | 6 | 11 | 1 | 7 | 8 | 0 | 14 | 18 | 32 |
| Medians and Pedestrian Refuge Islands in Urban and Suburban Areas | 10 | 4 | 1 | 5 | 5 | 2 | 21 | 17 | 38 |
| Walkways | 9 | 5 | 5 | 3 | 2 | 1 | 21 | 17 | 38 |
| Corridor Access Management | 6 | 4 | 1 | 3 | 12 | 1 | 21 | 17 | 38 |
| Roadside Design Improvements at Curves | 8 | 6 | 1 | 3 | 0 | 1 | 23 | 16 | 39 |
| Dedicated Left- and Right-Turn Lanes at Intersections | 10 | 2 | 2 | 3 | 2 | 1 | 26 | 15 | 41 |
| Lighting | 8 | 9 | 5 | 3 | 0 | 0 | 24 | 15 | 39 |
| Median Barriers | 5 | 3 | 5 | 4 | 2 | 1 | 22 | 15 | 37 |
| Wider Edge Lines | 4 | 6 | 4 | 5 | 0 | 0 | 23 | 14 | 37 |
| PHBs | 5 | 9 | 2 | 3 | 2 | 0 | 18 | 14 | 32 |
| SafetyEdge | 6 | 5 | 1 | 3 | 0 | 0 | 18 | 13 | 31 |
| VSLs | 2 | 3 | 1 | 8 | 2 | 2 | 8 | 13 | 21 |
| RSA | 2 | 4 | 3 | 4 | 7 | 1 | 26 | 12 | 38 |
| Pavement Friction Management | 4 | 3 | 3 | 7 | 1 | 0 | 24 | 12 | 36 |
| SSCs | 1 | 2 | 0 | 8 | 3 | 1 | 4 | 12 | 16 |
| LRSPs | 2 | 2 | 2 | 4 | 3 | 1 | 24 | 11 | 35 |
| LPI | 3 | 5 | 2 | 7 | 3 | 1 | 22 | 11 | 33 |
| Yellow Change Intervals | 5 | 4 | 0 | 3 | 1 | 0 | 28 | 9 | 37 |
* Number of DOTs Responded - None.
NOTE: Alt. = Alternative, Mech. = Mechanism, Mods. = Modifications, Strat. = Strategies, No. = Number. Respondents could select multiple answers for each FHWA PSC. Sort order = Number of DOTs with Modifications or Strategies (high to low). Table is based on responding DOTs.
Examples of modifications described in the other text responses include wider and decorative crosswalks and use of SSCs only being allowed in school zones or at the municipal level.
The FHWA PSCs with the highest number of responding DOTs that have implemented modifications or alternative strategies are roundabouts and road diets. In general, physical changes and changes in approach or method to implement are the most common types of modifications or alternative strategies used by state DOTs for FHWA PSCs.
Survey Results for Implementation Considerations of FHWA PSCs by DOTs
Questions 8 and 9 sought information regarding implementation considerations of FHWA PSCs. For Question 8, 21 responding DOTs indicated that their approach to implementation of FHWA PSCs varies based on different regions or areas of the state. In a follow-up question (see results in Table 10), all 21 of these DOTs selected context or area type as a factor influencing their implementation of FHWA PSCs in different regions or areas of the state. Thirteen responding DOTs selected land use context and differences in District or Region policies, while only nine responding DOTs indicated topography as a factor. Other factors mentioned in the text responses include AADT, population, seasonal activities, financial and staffing constraints of local jurisdictions, and the importance of acceptance of alternative intersection types in some regions.
Survey Results for DOT Resources and Evaluation Studies for FHWA PSCs
Questions 5, 6, and 12 asked DOTs about resources developed and evaluation studies conducted for FHWA PSCs.
Question 12 asked DOTs if they have developed general policies, processes, procedures, or tools that consider and prioritize FHWA PSCs for implementation. In response to this question, 28 responding DOTs indicated that they have established such resources.
Question 5 sought information regarding the development of PSC-specific resources (policies, standards, guidelines, or training materials) for PSCs categorized as Assessment Stage or Institutionalized by each DOT in the survey responses. The results for this question, shown in Table 11, indicate that responding DOTs have most frequently established these types of resources for the following FHWA PSCs: implementation of longitudinal rumble strips and stripes on two-lane roads, SafetyEdge, and median barriers. SSCs and VSLs received the fewest responses for this question.
Table 10. Factors affecting the implementation of FHWA PSCs within different areas or regions of the state (Question 9).
| Factor | Count |
|---|---|
| Context/area type (urban, rural, and suburban) | 21 |
| Input from local agencies | 18 |
| Differences in district or region policies | 13 |
| Land use context | 13 |
| Safety performance (e.g., crash history and network screening) | 13 |
| Climate | 11 |
| Topography | 9 |
| Other | 3 |
| Number of DOTs That Responded | 21 |
NOTE: Respondents could select multiple answers. Sort order = Count (high to low).
Table 11. Development of policies, standards, guidelines, or training materials for implementation of FHWA PSCs (Assessment Stage or Institutionalized) (Question 5).
| FHWA PSC | Count |
|---|---|
| Longitudinal Rumble Strips and Stripes on Two-Lane Roads | 33 |
| SafetyEdge | 26 |
| Median Barriers | 25 |
| Crosswalk Visibility Enhancements | 24 |
| Backplates with Retroreflective Borders | 24 |
| Roundabouts | 22 |
| Enhanced Delineation for Horizontal Curves | 21 |
| Wider Edge Lines | 21 |
| Bicycle Lanes | 19 |
| RRFBs | 19 |
| Walkways | 19 |
| Dedicated Left- and Right-Turn Lanes at Intersections | 19 |
| Lighting | 19 |
| RSA | 18 |
| Yellow Change Intervals | 16 |
| PHBs | 15 |
| Road Diets (Roadway Configuration) | 15 |
| Corridor Access Management | 15 |
| Roadside Design Improvements at Curves | 14 |
| Medians and Pedestrian Refuge Islands in Urban and Suburban Areas | 13 |
| Reduced Left-Turn Conflict Intersections | 13 |
| Systemic Application of Multiple Low-Cost Countermeasures at Stop-Controlled Intersections | 13 |
| Pavement Friction Management | 13 |
| LPI | 12 |
| Appropriate Speed Limits for All Road Users | 11 |
| LRSPs | 11 |
| SSCs | 6 |
| VSLs | 4 |
| None of the above | 1 |
| Number of DOTs Responded | 47 |
NOTE: Respondents could select multiple FHWA PSCs. Sort order = Count (high to low).
As shown in Table 12, responding DOTs have most frequently conducted evaluation studies for roundabouts, longitudinal rumble strips and stripes on two-lane roads, road diets, median barriers, and pavement friction management. Responding DOTs have not completed evaluation studies for LPI, walkways, and LRSPs. One responding DOT has completed evaluation studies for each of the following PSCs: SafetyEdge, backplates with retroreflective borders, dedicated left- and right-turn lanes at intersections, and systemic application of multiple low-cost countermeasures at stop-controlled intersections. In addition, 12 responding DOTs indicated that they have not completed evaluation studies for any of the 28 FHWA PSCs.
Survey Results for Participation in a Case Example
In response to Question 13 of the survey, 24 DOTs stated they would be willing to participate in a case example.
Summary of Key Survey Findings by Topic
Key findings from the survey are summarized as follows and organized by topic. Individual survey responses for all questions, including other text responses, are available in Appendix B.
Table 12. Evaluation studies of FHWA PSCs (Assessment Stage or Institutionalized) (Question 6).
| FHWA PSC | Count |
|---|---|
| Roundabouts | 18 |
| Longitudinal Rumble Strips and Stripes on Two-Lane Roads | 16 |
| None of the above | 12 |
| Median Barriers | 11 |
| Road Diets (Roadway Configuration) | 10 |
| Pavement Friction Management | 10 |
| Reduced Left-Turn Conflict Intersections | 8 |
| Enhanced Delineation for Horizontal Curves | 6 |
| PHBs | 5 |
| RRFBs | 5 |
| SSCs | 3 |
| Wider Edge Lines | 3 |
| Lighting | 3 |
| RSA | 3 |
| Appropriate Speed Limits for All Road Users | 2 |
| VSLs | 2 |
| Bicycle Lanes | 2 |
| Crosswalk Visibility Enhancements | 2 |
| Medians and Pedestrian Refuge Islands in Urban and Suburban Areas | 2 |
| Roadside Design Improvements at Curves | 2 |
| Corridor Access Management | 2 |
| Yellow Change Intervals | 2 |
| SafetyEdge | 1 |
| Backplates with Retroreflective Borders | 1 |
| Dedicated Left- and Right-Turn Lanes at Intersections | 1 |
| Systemic Application of Multiple Low-Cost Countermeasures at Stop-Controlled Intersections | 1 |
| LPI | 0 |
| Walkways | 0 |
| LRSPs | 0 |
| Number of DOTs Responded | 41 |
NOTE: Respondents could select multiple FHWA PSCs. Sort order = Count (high to low).
Key Survey Findings for Extent of Use of FHWA PSCs by DOTs
- All 49 responding DOTs use FHWA PSCs to some extent. Responding DOTs implement a wide range of FHWA PSCs to various degrees. The FHWA PSCs that are most frequently Institutionalized by responding DOTs are longitudinal rumble strips and stripes on two-lane roads, median barriers, enhanced delineation for horizontal curves, and roundabouts. The number of Institutionalized FHWA PSCs per responding DOT varies from one to 27.
- The most prevalent FHWA PSCs for the other implementation stages are
- Not Implemented: SSCs and VSLs;
- Development Stage: appropriate speed limits for all users and reduced left-turn conflict intersections;
- Demonstration Stage: LPI and corridor access management; and
- Assessment Stage: systemic application of multiple low-cost countermeasures at stop-controlled intersections and medians and pedestrian refuge islands in urban and suburban areas.
- As indicated by the average stage index, overall implementation levels are the highest for longitudinal rumble strips and stripes on two-lane roads, roundabouts, and dedicated left- and right-turn lanes at intersections and lowest for appropriate speed limits for all road users, VSLs, and SSCs.
- Responding DOTs deploy an average of 13.5 FHWA PSCs as standard practice. The FHWA PSCs that are most frequently implemented as standard practice by responding DOTs are longitudinal rumble strips and stripes on two-lane roads, backplates with retroreflective borders, yellow change intervals, and SafetyEdge.
- The most frequently considered FHWA PSCs that are Institutionalized (but not standard practice for a given responding DOT) for use on projects are enhanced delineation for horizontal curves, roundabouts, and crosswalk visibility enhancements.
Key Survey Findings for DOT Challenges to Implementing FHWA PSCs
- Responding DOTs perceive a wide range of factors as challenges to the implementation of the FHWA PSCs related to speed management. In general, implementation concerns are perceived by state DOTs as the greatest challenge to the use of FHWA PSCs. SSCs, VSLs, and appropriate speed limits for all road users were cited most frequently by responding DOTs for having factors that hinder efforts to implement FHWA PSCs, while longitudinal rumble strips and stripes on two-lane roads and roundabouts were cited least frequently. The most frequently cited FHWA PSCs for each factor are
- Staffing or funding constraints: lighting and LRSPs;
- Implementation concerns: VSLs, appropriate speed limits for all road users, SSCs, and reduced left-turn conflict intersections;
- Lack of available guidance: appropriate speed limits for all road users;
- Lack of information on safety benefits: SSCs and appropriate speed limits for all road users; and
- Regulatory barriers: SSCs, VSLs, and appropriate speed limits for all road users.
- Twenty-nine responding DOTs indicated that they have not stopped using any FHWA PSCs. The following FHWA PSCs are no longer utilized by at least one responding DOT: appropriate speed limits for all users, SSCs, VSLs, PHBs, SafetyEdge, backplates with retroreflective borders, and pavement friction management. Responding DOTs noted stakeholder concerns as a factor in their decision to stop using each of these seven FHWA PSCs except for SafetyEdge. Other reasons cited include
- Appropriate speed limits for all users: results similar to current DOT process;
- SSCs: the need for legislation;
- VSLs: increased emphasis on other SCs or initiatives, cost to implement;
- PHBs: potential for driver confusion;
- SafetyEdge: lack of adequate pavement thickness, cost to implement;
- Backplates with retroreflective borders: increased emphasis on other SCs or initiatives, cost to implement, need for more research regarding safety outcomes; and
- Pavement friction treatment: cost to implement, delamination issues, and adverse effects on pavement life cycle.
Key Survey Findings for DOT Modifications or Alternative Strategies for FHWA PSCs
- Responding DOTs pursue various types of modifications or alternative strategies when implementing FHWA PSCs and/or overcoming barriers to implementation. The FHWA PSCs with the highest number of responding DOTs that have implemented modifications or alternative strategies are roundabouts and road diets. The most prevalent FHWA PSCs for each type of modification or alternative strategy are
- Physical changes: roundabouts;
- Change in approach or method to implement: appropriate speed limits for all road users, bicycle lanes, and backplates with retroreflective borders;
- Alternative delivery mechanisms or funding sources: systemic application of multiple low-cost countermeasures at stop-controlled intersections, enhanced delineation for horizontal curves, and backplates with retroreflective borders;
- Pilot projects: RRFBs, SSCs, VSLs, and road diets;
- Change in approach to public outreach: roundabouts, reduced left-turn conflict intersections, corridor access management, and road diets; and
- None: yellow change intervals, RSAs, and dedicated left- and right-turn lanes at intersections.
Key Survey Findings for Implementation Considerations of FHWA PSCs by DOTs
- Approaches to implementation of FHWA PSCs vary based on different regions or areas of the state for 21 responding DOTs.
- All 21 of these DOTs noted context or area type as a factor influencing their implementation of FHWA PSCs in different areas or regions of the state, while 13 of these DOTs also indicated that land use and safety performance are influential factors.
Key Survey Findings for DOT Resources and Evaluation Studies for FHWA PSCs
- Twenty-eight responding DOTs have developed general policies, processes, procedures, or tools that consider and prioritize FHWA PSCs for implementation.
- Regarding PSC-specific resources for PSCs categorized as Assessment Stage or Institutionalized by each DOT in the survey responses, responding DOTs have most frequently developed policies, standards, guidelines, or training materials for the following FHWA PSCs: implementation of longitudinal rumble strips and stripes on two-lane roads, SafetyEdge, and median barriers. SSCs and VSLs are the PSCs least frequently noted by responding DOTs as having resources developed.
- Responding DOTs have most frequently conducted evaluation studies for the following FHWA PSCs: roundabouts, longitudinal rumble strips and stripes on two-lane roads, road diets, median barriers, and pavement friction management.
- As noted in the survey responses, no responding DOTs have completed evaluation studies for LPI, walkways, and LRSPs. One responding DOT has completed evaluation studies for each of the following PSCs: SafetyEdge, backplates with retroreflective borders, dedicated left- and right-turn lanes at intersections, and systemic application of multiple low-cost countermeasures at stop-controlled intersections.
Summary of Key Survey Findings by FHWA PSC
A summary of key survey findings by FHWA PSC is provided in Table 13. Shading in Table 13 is a color gradient based on values (green = high; red = low). The table shows that responding DOTs have developed modifications or strategies for a wide range of FHWA PSCs, regardless of the number of responding DOTs that perceive hindrances to the implementation of the PSC. FHWA PSCs with a low average stage index (e.g., appropriate speed limits for all users, VSLs, and SSCs) tend to have more factors that hinder implementation.
Table 13. Summary of key survey findings by FHWA PSC.
| FHWA PSC | Avg. Stage Index* | No. of DOTs with Factors that Hinder Implement. | No. of DOTs with Mods. or Alt. Strat. | No. of DOTs Developed Resources | No. of DOTs Conducted Evaluations |
|---|---|---|---|---|---|
| Longitudinal Rumble Strips and Stripes on Two-Lane Roads | 3.85 | 1 | 23 | 33 | 16 |
| Roundabouts | 3.81 | 1 | 28 | 22 | 18 |
| Median Barriers | 3.77 | 2 | 15 | 25 | 11 |
| Enhanced Delineation for Horizontal Curves | 3.65 | 3 | 20 | 21 | 6 |
| Backplates with Retroreflective Borders | 3.56 | 2 | 22 | 24 | 1 |
| Dedicated Left- and Right-Turn Lanes at Intersections | 3.56 | 4 | 15 | 19 | 1 |
| RRFBs | 3.44 | 6 | 22 | 19 | 5 |
| Crosswalk Visibility Enhancements | 3.33 | 7 | 21 | 24 | 2 |
| RSA | 3.25 | 9 | 12 | 18 | 3 |
| Walkways | 3.19 | 6 | 17 | 19 | 0 |
| Road Diets (Roadway Configuration) | 3.17 | 8 | 25 | 15 | 10 |
| Roadside Design Improvements at Curves | 3.15 | 8 | 16 | 14 | 2 |
| Yellow Change Intervals | 3.15 | 7 | 9 | 16 | 2 |
| Lighting | 3.13 | 12 | 15 | 19 | 3 |
| Systemic Application of Multiple Low-Cost Countermeasures at Stop-Controlled Intersections | 3.10 | 10 | 20 | 13 | 1 |
| Medians and Pedestrian Refuge Islands in Urban and Suburban Areas | 3.08 | 8 | 17 | 13 | 2 |
| Wider Edge Lines | 3.04 | 10 | 14 | 21 | 3 |
| Bicycle Lanes | 3.00 | 13 | 19 | 19 | 2 |
| Corridor Access Management | 3.00 | 16 | 17 | 15 | 2 |
| SafetyEdge | 2.87 | 13 | 13 | 26 | 1 |
| Pavement Friction Management | 2.85 | 15 | 12 | 13 | 10 |
| PHBs | 2.77 | 14 | 14 | 15 | 5 |
| LRSPs | 2.70 | 10 | 11 | 11 | 0 |
| Reduced Left-Turn Conflict Intersections | 2.58 | 19 | 19 | 13 | 8 |
| LPI | 2.56 | 12 | 11 | 12 | 0 |
| Appropriate Speed Limits for All Road Users | 1.85 | 29 | 18 | 11 | 2 |
| VSLs | 1.40 | 32 | 13 | 4 | 2 |
| SSCs | 0.98 | 37 | 12 | 6 | 3 |
* Calculated based on these values: 0 = Not Implemented, 1 = Development Stage, 2 = Demonstration Stage, 3 = Assessment Stage, 4 = Institutionalized.
NOTE: Avg. = Average, No. = Number, Implement. = Implementation, Mods. = Modifications, Alt. = Alternative, Strat. = Strategies. Sort order = Average Stage Index (high to low). Table based on responding DOTs.


