Census Data Field Guide for Transportation Applications (2025)
Chapter: 1 Introduction

CHAPTER 1
Introduction
The central role that transportation plays in the U.S. economy is reflected in this comment from the National Surface Transportation Policy and Revenue Study Commission (2007):
The American economy works, in large measure, because shippers, manufacturers, and service providers have a transportation system that provides many ways to access labor and move raw materials and finished products. Individuals are able to travel to workplaces, shopping, educational institutions, recreation, medical care, and other locations critical to their quality of life.
The changes brought about by technology—especially the smartphone revolution with its impacts on online shopping and the emergence of transportation network companies (TNCs)—have upended the way people live, work, shop, and play, with profound implications for transportation investment, policy, and operational decisions. One example of this change is the decrease in the proportion of licensed drivers among the 55-and-under age cohorts in 2014 as compared to 1983 (Sivak and Schoettle 2016). These changes in travel behavior need to be measured accurately to ensure that policy decisions happen in a data-driven context.
Collecting data on travel behavior is also becoming more challenging and is hampered by low survey response rates and high rates of survey attrition. Therefore, it is critical to consult different sources of travel behavior data to provide estimates in a consistent, reliable, and sustainable manner. An FHWA report on data availability and gaps related to our understanding of travel behavior highlights the need for data fusion techniques to overcome these gaps (Tawfik and Zohdy 2017). Census data, even in this age of big data, offer tremendous value and insights to help overcome the data availability and gaps identified by FHWA. The various data products released by the Census Bureau and its extensions provide information and insights that will help in making data-driven policy decisions to address changes in travel behavior.
This report is organized in 19 chapters as follows. The remainder of this chapter discusses the history of the Census. Chapter 2 focuses on the American Community Survey (ACS), and Chapter 3 outlines the features of the AASHTO Census Transportation Solutions (ACTS) program, formerly known as the Census Transportation Planning Products (CTPP) program. Chapter 4 covers the Public Use Microdata Sample (PUMS), and Chapter 5 discusses the Longitudinal Employer-Household Dynamics (LEHD) program. Chapter 6 is devoted to the National Household Travel Survey (NHTS) and the American Time Use Survey (ATUS).
Chapter 7 focuses on differential privacy and its implications for data products used by transportation planners and modelers while Chapter 8 discusses the various uses of census data. Chapter 9 describes a TRB workshop conducted in January 2020 to solicit input on the expectations and need for a field guide. Chapter 10 discusses the COVID-19 crisis and its impact on the availability and use of census data for transportation and other industries in the coming years.
The results of Phase 2 of this research are presented in the remainder of this report. Chapter 11 presents a detailed framework and an annotated outline of the field guide developed in the research.
Chapters 12 through 18 present a series of scenarios using these various data sources. The report concludes in Chapter 19 with a discussion about resources and guidelines for practitioners.
1.1 History of the Census
The Census is enshrined in the U.S. Constitution, as stated in Article I, Section 2, Clause 3: “For a government of the people to function, the people must be counted.” The founders wanted an “enumeration” to occur “within three Years after the first Meeting of Congress” and then “within every subsequent Term of ten Years, in such Manner as they shall by Law direct.” The “History” section of the U.S. Census Bureau website (U.S. Census Bureau n.d.-c), the source of much of the following information, states that
On March 1, 1790, President George Washington signed legislation into law—the “1790 Census Act”—assigning U.S. marshals the task of conducting the nationʼs first Census. Marshals and their assistants traveled throughout the 13 states, districts of Kentucky, Maine, Vermont, and the Southwest Territory (Tennessee) using rudimentary forms of their own design to collect the name of each head of household along with a numeric count of every householdʼs free White males aged 16 and older, free White males under 16, free White females, all other free persons, and slaves as of the first Monday of August 1790. At its conclusion, the 1790 Census found that the United States was home to 3,929,214 people. The largest urban places were New York City, NY (33,131 residents); Philadelphia, PA (28,522); Boston, MA (18,320); and Baltimore, MD (13,503).
For the 1810 census, Congress added the collection of manufacturing data. The Census evolved over a period of 40 years, from 1810 to 1850. During this period, in addition to collecting data on manufacturing, the Census expanded to include data on agriculture (1820); schools and school attendance (1840); and individual-level information such as name, profession, place of birth, and marital status (1850).
The Census Act of 1880 replaced the U.S. marshals and their assistants with specially hired and trained enumerators. Due to the volume of data collected by these enumerators, a decade passed before the 1880 census data were tabulated and published. In preparing for the 1890 census, former Census Bureau employee and inventor Herman Hollerith received a contract to supply mechanical tabulators to speed data processing and tabulation (see Figure 1.1). The 1890 census used separate schedules for each family and gathered even more detailed information about each individualʼs family, employment, health, education, and home ownership compared to previous years. By 1890, a century after the first U.S. Census, the nationʼs population had grown to nearly 63 million.
In 1902, Congress established the U.S. Census Bureau as a permanent agency, acknowledging the need for a dedicated and specially trained workforce to collect the nationʼs demographic, economic, agricultural, and government data. This change allowed the Census Bureau to plan decennial population censuses, as well as mid-decade censuses and surveys. The Census Bureau could also conduct more frequent censuses of manufacturers and special censuses of war commodities during World War I.
The 1930 census, conducted after the stock market crash of 1929 and the onset of the Great Depression, included, in addition to the “standard” questionnaire that collected data on demographics, a supplemental questionnaire to gather more information about the impact of the economic crisis on American workers. Statistical sampling was introduced in the 1940 census to allow enumerators to collect additional data such as parentsʼ place of birth, mother tongue, and veteran status from 5 percent of the nationʼs population without increasing respondent burden and overwhelming the data processing system. Subsequent censuses added sample questions on various topics such as transportation to work, occupation history, ancestry, and grandparents as caregivers. The ACS, introduced in 2005, replaced the decennial censusʼs sample questions, resulting in a simplified 10-question form for the 2010 census, which counted nearly 309 million people.

Source: Encyclopedia Britannica, n.d.
Long Description.
The cover page from the August 30, 1890, edition of Scientific American includes six illustrated scenes related to the use of the Hollerith Census Tabulator. In the top left scene, a man operates a punch card machine. In the top right, another man examines a large paper sheet. In the center left, a horse-drawn wagon carries stacked equipment. In the center right, a woman works with a tabulating device beside piles of punch cards. In the bottom left, a group of people sorts through a large number of cards or documents. In the bottom right, a box and an open tray of punch cards are placed side by side. Each scene presents steps and tools used in the tabulation of census data in 1890.
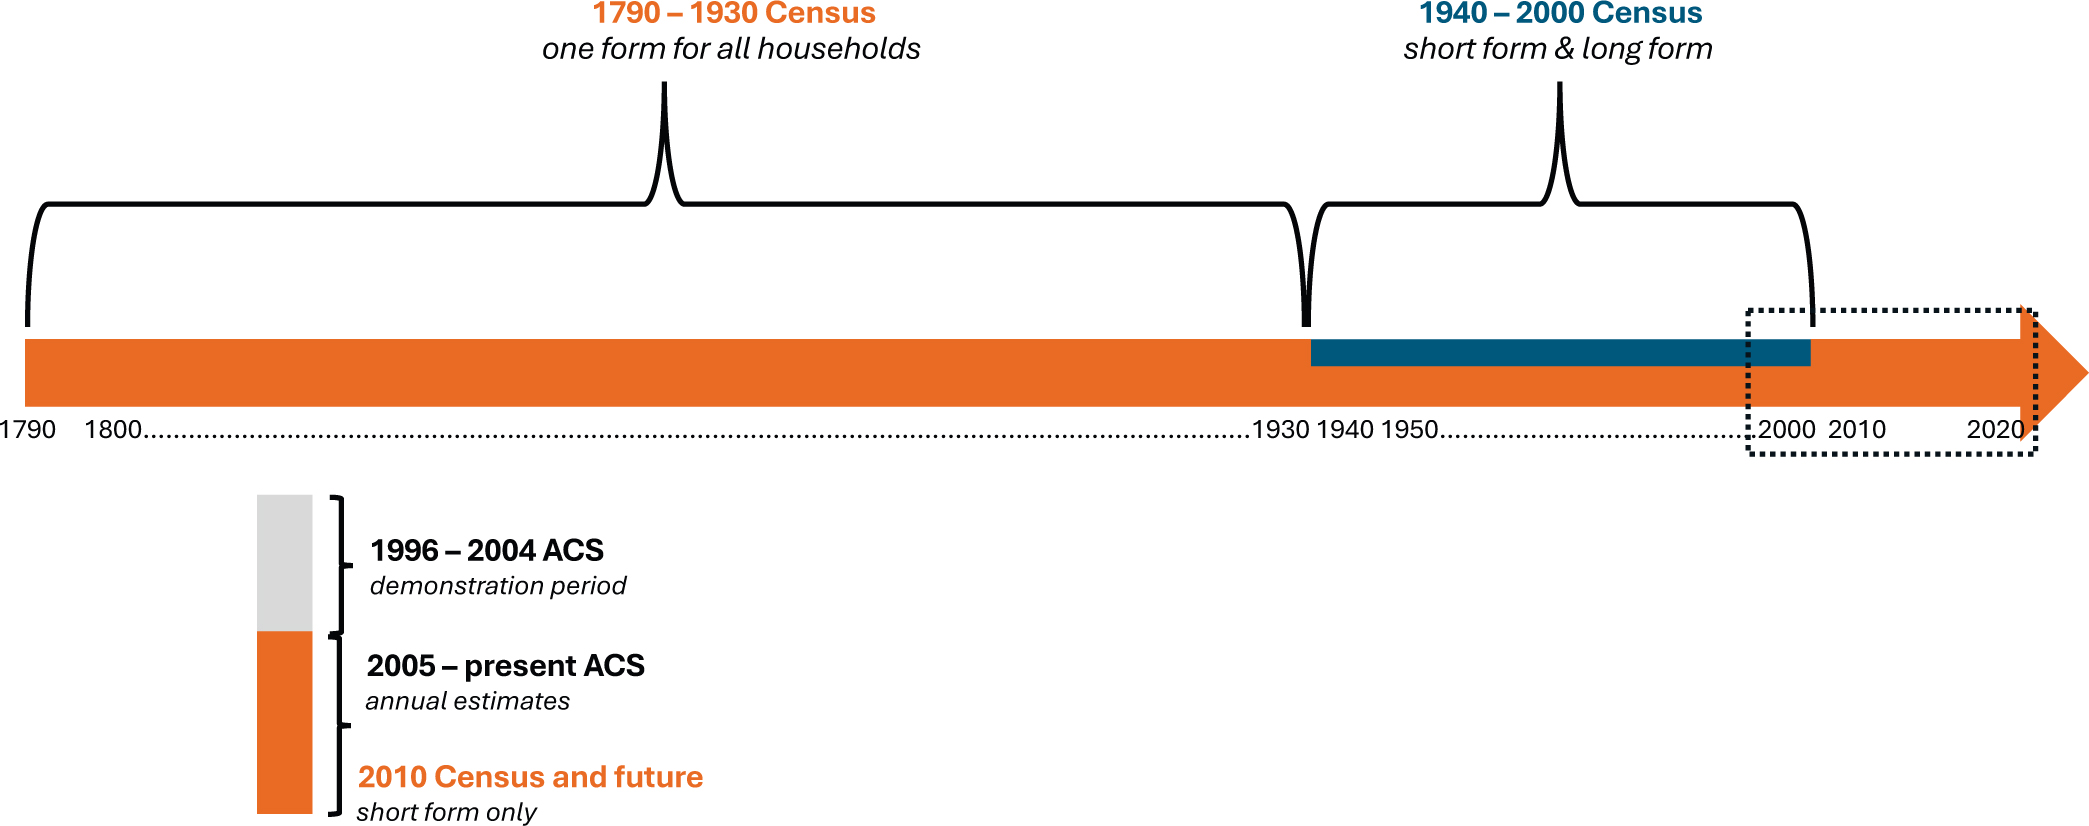
Over its 230-year history, the decennial census has documented the transformation of the United States from a rural, agrarian nation in 1790 to the worldʼs third most populous country (after China and India), with a gross domestic product of $21.73 trillion in the fourth quarter of 2019. Figure 1.2 shows a timeline of the Census from 1790 to 2020.
1.2 History of Transportation in the Census
The inclusion of transportation-related questions in the decennial census is a relatively recent development that started in 1960 when three such questions were asked on a 25-percent sample basis. These questions focused on each workerʼs place of work, means of transportation to work, and the number of automobiles available to each household (see Figure 1.3). The primary reason for including the question on place of work was to gather data on commuting patterns between large cities and their suburbs, which served as an indicator of economic integration and helped delineate metropolitan statistical areas (MSAs). Although the commuting data were of interest to transportation planners, urban transportation planning in the early 1960s still relied on locally conducted origin-destination surveys (National Research Council 1995).
The 1960 census was the first one that asked questions on three transportation-related topics: (1) number of vehicles available in the household, (2) place of work, and (3) means of transportation to work.
The development by the Census Bureau of address coding guides (ACGs) and Dual Independent Map Encoding (DIME) files in the 1960s led to considerable interest in the census as a source of transportation planning data. These tools enabled the geographic coding of place-of-work
Long Description.
The timeline spans from 1790 to 2020 and highlights changes in the U S census process. From 1790 to 1930, the census included a single form for all households. From 1940 to 2000, the census included both short form and long form. A bar runs across the full timeline to represent the decennial census. Another bar appears from 1996 to 2004 to mark the testing period of ACS. Another bar begins in 2005 and continues to the present to indicate the ongoing use of the ACS. A marker labels the 2010 census and features noting the ACS only use. The timeline is laid out with arrows and labeled periods to separate changes in census form and data collection methods.
addresses down to the census block level within the urbanized portions of metropolitan areas. The 1970 census asked for the actual street addresses of respondentsʼ workplaces, which were then coded to census blocks within the areas covered by ACGs and DIME files. The U.S. DOT collaborated with the Census Bureau to create special tabulations in a transportation planning package, which metropolitan planning organizations (MPOs) could obtain for their traffic zones on a cost-reimbursable basis.
Between 1970 and 1980, there was a significant expansion in the number of transportation items included in the decennial census. The energy crisis of the early 1970s led to a sharp increase in the need for statistics to support transportation planning and policy formulation. From 1975 to 1977, with sponsorship from the U.S. DOT, the Census Bureau conducted the first time journey-to-work surveys in 60 metropolitan areas and a national survey in 1975 as part of the American Housing Survey.
Recognizing the growing need for analysis of these transportation-related data, the Census Bureau created a Journey-to-Work Statistics Branch within the Population Division to carry out

Source: https://usa.ipums.org/usa/voliii/items1960.shtml.
Long Description.
The form includes three transportation questions from the 1960 census. Question P 28 asks for the city and county where the person worked last week. It includes prompts for the city or town name, whether the person worked inside city limits, and the name of the county and state. Question P 29 asks how the person got to work last week, with check boxes to mark options including railroad, subway or elevated, bus or streetcar, taxicab, private auto or carpool, walk only, worked at home, or other means with a write-in line. Question H 36 asks how many passenger automobiles are owned or regularly used by people living in the home. It lists response choices as 0 automobiles, 1 automobile, 2 automobiles, or 3 automobiles, or more. Each item includes checkboxes for selection.
all the work associated with the planning, collection, and analysis of journey-to-work data from the decennial census and periodic surveys. With the cost of conducting metropolitan origin-destination surveys increasing rapidly, the U.S. DOT began to encourage use of the decennial census as an alternative source for cost-effective transportation-planning data.
The 1980 census included eight transportation items, with six population questions and two housing questions. The population questions covered place of work, means of transportation to work, carpooling arrangements, number of riders in the carpool, travel time from home to work, and whether respondents had a disability that limited or prevented their use of public transportation. The housing questions included automobile availability and an additional question on the number of light trucks and vans available for use by household members.
The U.S. DOT contracted with the Census Bureau to create special tabulations in a transportation-planning package that MPOs could obtain for their traffic analysis zones (TAZs) on a cost-reimbursable basis. To enhance the usefulness of census data for local transportation planning, the Census Bureau developed procedures to assign incomplete place-of-work responses to census blocks, enabling tabulation at the TAZ level.
In contrast to the 1980 census, the 1990 decennial census did not break up the question on household vehicle availability into two separate questions but treated it as a single question and included information about travel mode, work location, and carpool along with two new questions on departure time to work and travel time to work. The 2000 decennial census, the last year of the long form, had the same transportation-related questions as the 1990 decennial census, questions that were asked of 1 in 6 households.
Since 2000, the long form has not been available, and transportation-related questions are included in the ACS, which samples 1 in 40 households on a rolling basis. An overview of the ACS is provided in the next chapter.


