Census Data Field Guide for Transportation Applications (2025)
Chapter: 2 American Community Survey

CHAPTER 2
American Community Survey
The ACS is a nationwide survey that provides communities with reliable and timely social, economic, housing, and demographic data every year. It is supplemented by the Puerto Rico Community Survey (PRCS), which collects similar population and housing unit data in Puerto Rico. The Census Bureau uses data collected in the ACS and the PRCS to provide estimates on a broad range of sociodemographic characteristics at different geographies—from block groups to the nation (U.S. Census Bureau 2018b).
The ACS is designed to provide estimates of the characteristics of the population, not to provide counts of the population in different geographic areas or population subgroups.
This chapter cites information included in Understanding and Using American Community Survey Data: What All Data Users Need to Know (U.S. Census Bureau 2018b), hereafter referred to as the “ACS General Handbook.” The ACS has an annual sample size of about 3.5 million households, with survey information collected nearly every day of the year. Unlike the decennial census, data are pooled across a calendar year to produce estimates for that year. As a result, ACS estimates reflect data collected over a period of time instead of data collected at a single point in time.
ACS 1-year estimates are available for geographic areas with a population of at least 65,000 people. The Census Bureau combines 5 consecutive years of ACS data to produce estimates for geographic areas with fewer than 65,000 residents. The Census Bureau previously released 3-year estimates based on 36 months of data collection. In 2015, the 3-year products were discontinued. The 2011–2013 ACS 3-year estimates, released in 2014, are the last release of this product. Since 2014, the Census Bureau has also produced “1-year supplemental estimates,” which are simplified versions of selected ACS tables for geographic areas with a population of at least 20,000 people.
There is a sampling error in the ACS estimates since they are based on a sample of housing units and people rather than the universe. The sampling error is inversely related to the sample size—the larger the sample, the smaller the sampling error. The Census Bureau publishes the margin of error (MOE) for each ACS estimate to help users understand the impacts of sampling on data reliability. Combining the ACS estimate with the MOE gives users a range of values within which the actual “real-world” value is likely to fall.
As discussed in the ACS General Handbook, social, economic, housing, and demographic ACS estimates are generated (shown in Figure 2.1). Each ACS table has its own unique “universe” or base reference totals against which all other characteristics are compared. The tables provide information on population and housing characteristics. Some of the population tables cover the entire population (such as tables of the population by age), while some cover a subset of the population (such as tables of employment status, which include data only for the population aged 16 and older).
The transportation-related questions in the ACS ask respondents about their workplace location, transportation mode, carpool characteristics, departure time, and travel time to work

Source: U.S. Census Bureau 2018b.
Long Description.
Four grouped lists describing data topics in ACS data products. Social Characteristics include ancestry, citizenship status, disability status, educational attainment, fertility, grandparents as caregivers, language spoken at home, marital history, marital status, migration/residence 1 year ago, period of military service, place of birth, school enrollment, undergraduate field of degree, veteran status, and year of entry. Economic Characteristics include class of worker, commuting, employment status, food stamp or supplemental nutrition assistance program, health insurance coverage, income and earnings, industry and occupation, poverty status, work status last year. Housing Characteristics include computer and internet use, home heating fuel, kitchen facilities, occupancy or vacancy status, occupants per room, plumbing facilities, rent, rooms and bedrooms, selected monthly owner costs, telephone service available,, tenure, units in structure, value of home, vehicles available, when the householder moved into unit, and year structure built. Demographic Characteristics include age and sex, group quarters population, Hispanic or Latino origin, race, relationship to householder, and total population. A footnote explains that some items were added or removed in certain years, including major wording changes in 2008 and the removal of specific items in 2016.
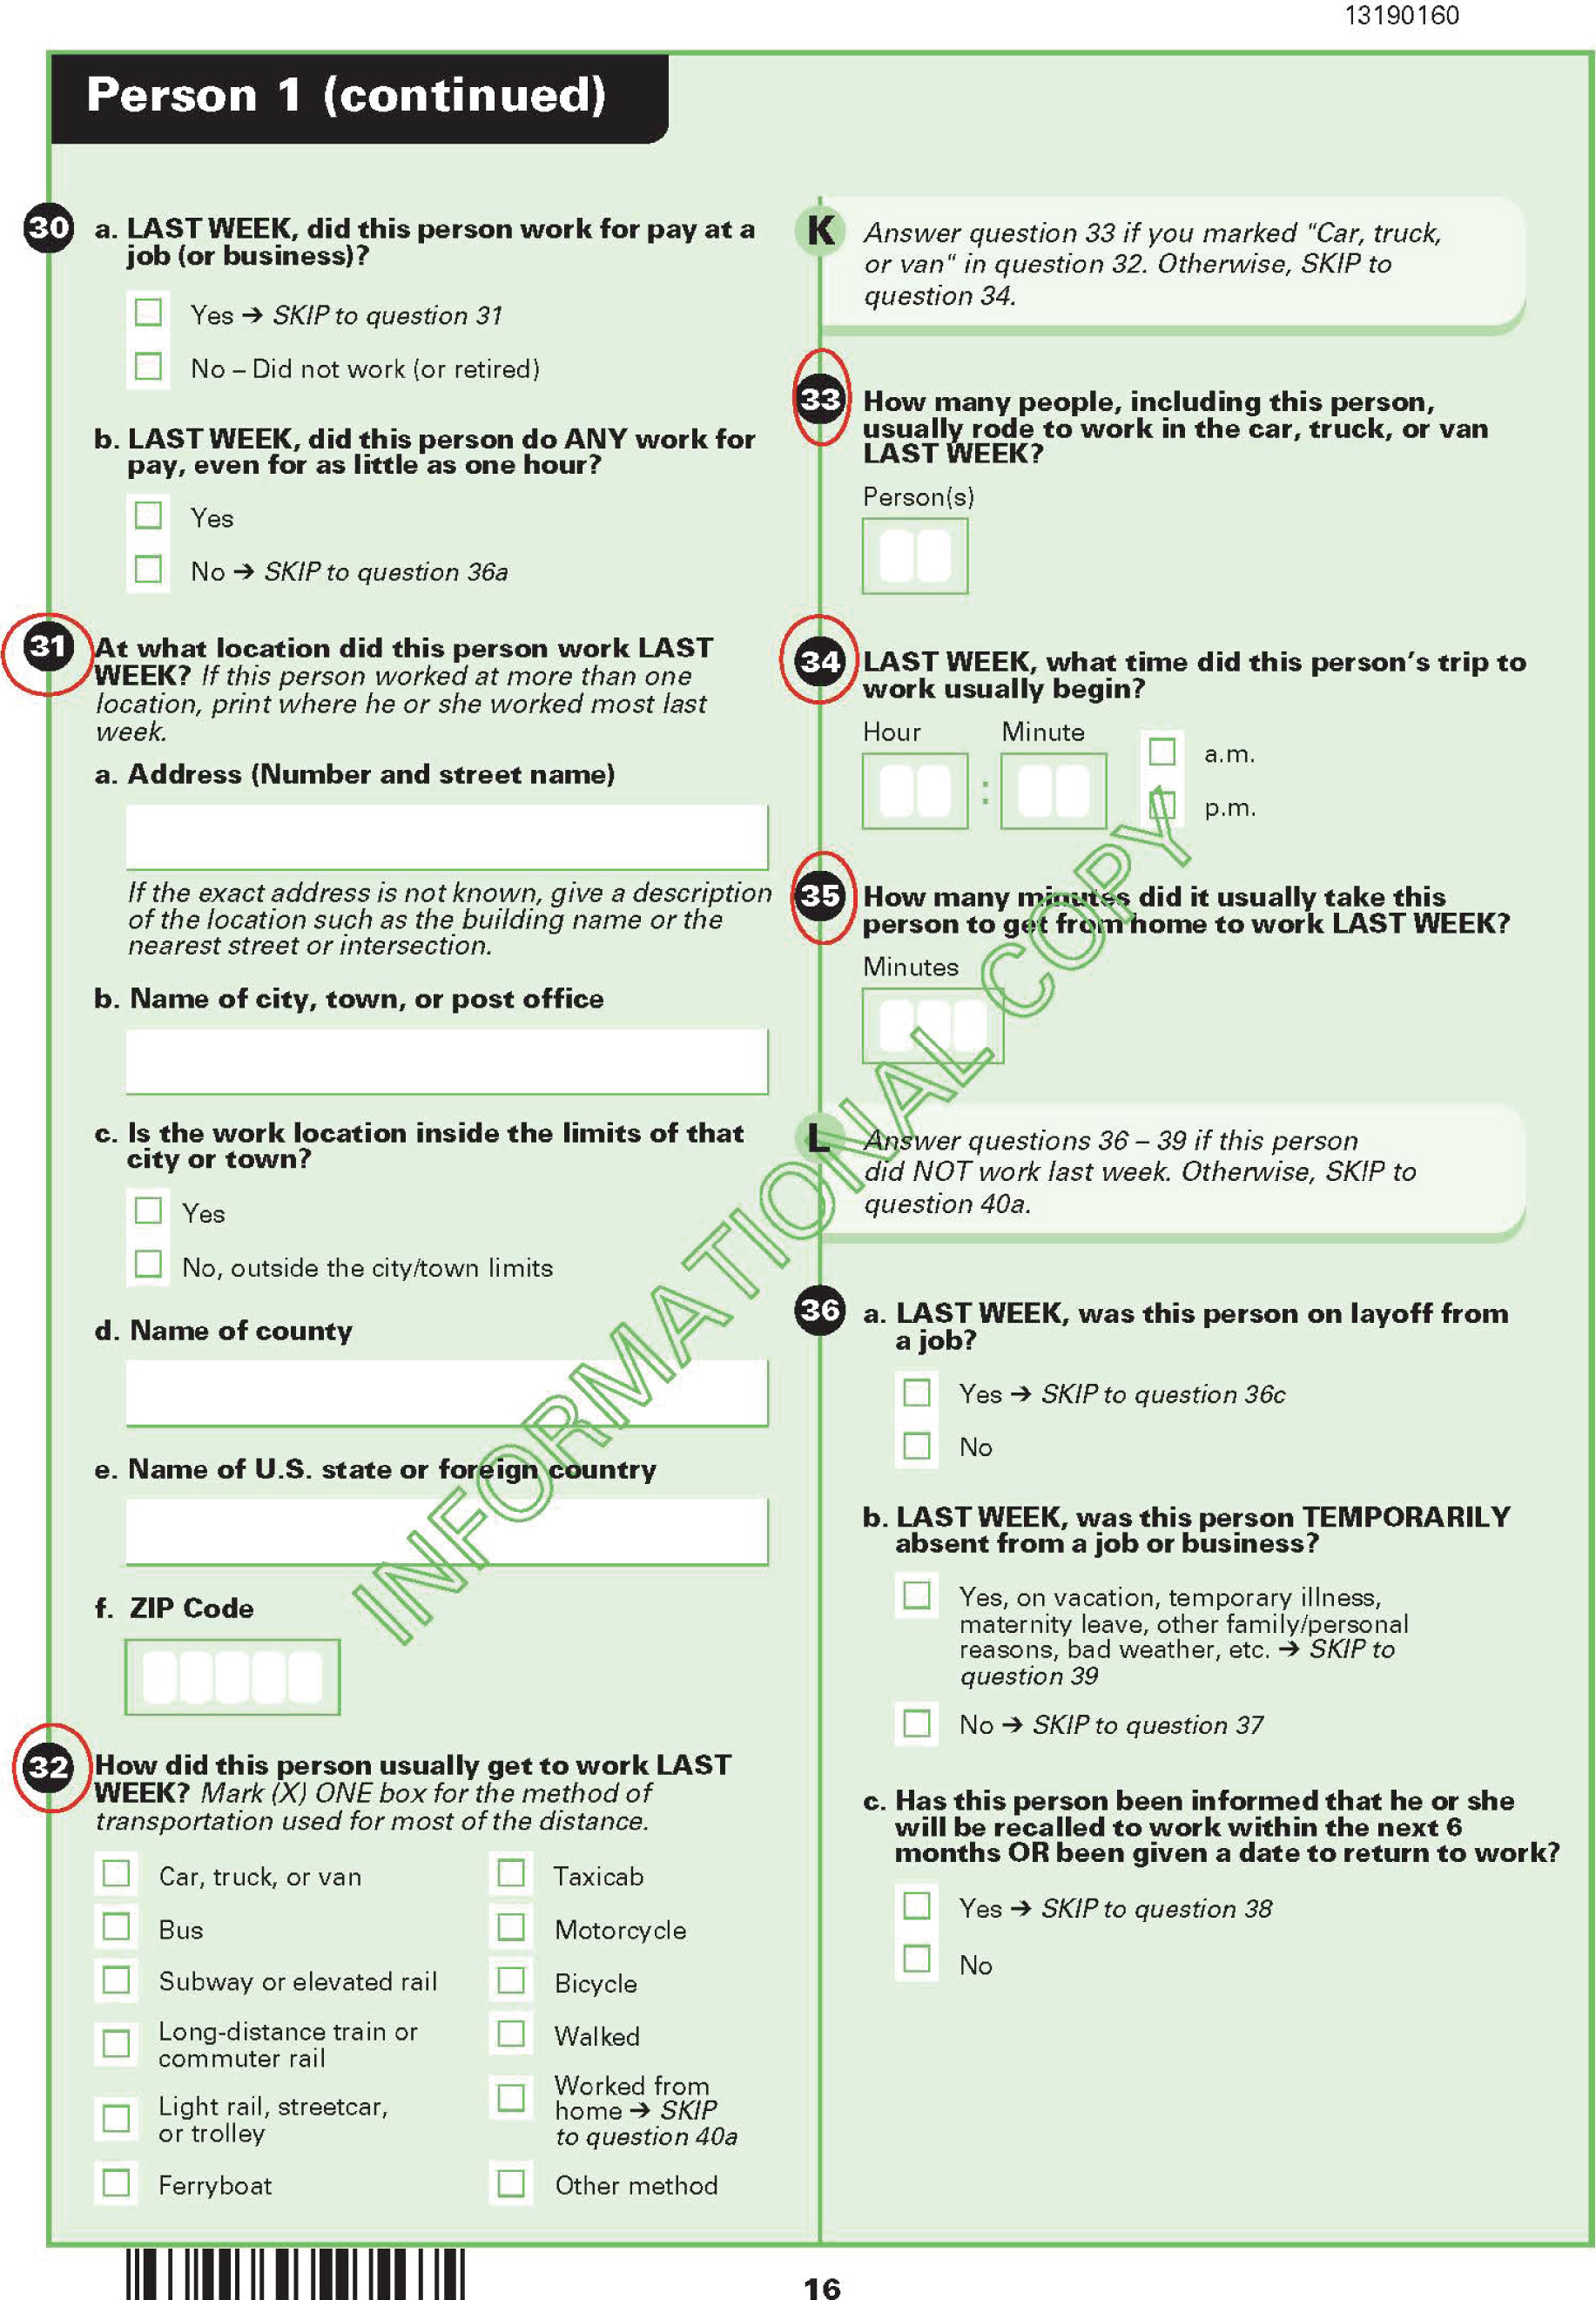
(See Questions 31–35 in Figure 2.2). The housing characteristics question asks about the number of vehicles available in the household. In 2019, the subway or elevated option for the transportation mode question was broken into two options—“subway or elevated rail” and “long-distance train or commuter rail.” It took close to 5 years from the proposal of the change by the transportation community to the implementation of the change. Given how precious the real estate on the ACS questionnaire is and the time that it takes to implement a change, it is important that any requests for changes in the transportation questions be considered closely and the community mobilized to make the change.
2.1 How ACS Data Are Collected
Additional detail about how the ACS data are collected is provided in the following from the ACS General Handbook (U.S. Census Bureau 2018b):
From 2005 through 2012, the ACS collected data using three sequential methods, or “modes”: paper questionnaires through the mail, phone interviews, and personal visits with a Census Bureau interviewer. Starting in 2013, the Census Bureau added a fourth mode—an Internet response option—that simplified data collection and reduced survey costs. Starting in late 2017, based on declining response rates and increasing costs, the Census Bureau discontinued using phone interviews to follow up with nonrespondents. The annual sample size of the ACS has also increased over time, from 2.9 million addresses in 2005 to more than 3.5 million addresses in 2015. This increased sample size has improved the precision of the ACS
Source: U.S. Census Bureau 2020a.
Long Description.
The survey page for Person 1 includes multiple transportation-related questions. One question asks whether the person worked last week and how many hours they worked. If they worked, another question asks for the address of the workplace. Another item asks how the person usually got to work last week, with a list of travel modes and a box to mark the one used for most of the distance. Another question asks how many people rode in the vehicle to work. Another asks the time the person usually left home to go to work. One item asks how many minutes it usually took to get from home to work last week. Each question has numbered labels and checkboxes or blank spaces for answers.
estimates. Over a 5-year period, the Census Bureau samples approximately 1-in-9 households nationwide, but the sampling rate is higher in areas with small populations and low predicted response rates.
Of the 3.5 million addresses selected for ACS interviews in 2015, about 2.3 million resulted in final interviews. The number of final interviews is smaller than the number of initial addresses selected because the Census Bureau conducts in-person interviews with only a subset of those who do not respond by Internet, mail, or phone. Addresses are also excluded if they are determined to be invalid or commercial, or if a household refuses to participate. In 2015, the national response rate for the ACS was 95.8 percent.[The survey response rate is the ratio of the estimate of housing units interviewed after data collection is complete to the estimate of all units that should have been interviewed. Interviews include complete and partial interviews with enough information to be processed.] For more information about ACS sample size and response rates, the reader can visit the Census Bureauʼs web page on Sample Size and Data Quality [U.S. Census Bureau, n.d.-a].
The annual ACS sample is smaller than the 2000 Census long-form sample, which included about 18 million housing units. As a result, the ACS needs to combine population or housing data from multiple years to produce reliable numbers for small counties, neighborhoods, and other local areas. To provide information for communities each year, the ACS currently provides 1-year estimates for geographic areas with a population of at least 65,000 people and 5-year estimates for smaller geographic areas down to the Census tract and block-group level. Starting with the 2014 ACS, the Census Bureau is also producing 1-year Supplemental Estimates which are simplified versions of popular ACS tables for geographic areas with a population of 20,000 or more.
One important fact about the ACS is that the request to complete the survey is not mailed to specific people, but rather to specific addresses. The Census Bureau selects a random sample of addresses to be included in the ACS. Each address has about a 1-in-480 chance of being selected in a given month, and no address should be selected more than once every 5 years. Each month, the Census Bureau sends an initial mail package to approximately 295,000 addresses across the United States. This is a small number of housing units considering that there are more than 180 million addresses in the United States.
Until 2015, the Census Bureau sent to all selected addresses an advance notification letter informing people living at that address that they had been selected to participate in the ACS. Shortly thereafter, instructions for completing the survey by Internet were mailed to most U.S. addresses. Beginning in August 2015, the Census Bureau eliminated the advance notification letter and instead included instructions in the initial mail package for completing the survey by Internet or over the phone through a toll-free Telephone Questionnaire Assistance (TQA) line. If households do not respond by Internet or TQA, then a paper questionnaire is mailed to the address. In Puerto Rico and some hard-to-reach areas, only a paper questionnaire is mailed.
Until 2017, the Census Bureau followed up with a telephone interview when a telephone number was available if no response was received by Internet, TQA, or mail within a month following the initial mailing. However, beginning in October 2017, the Census Bureau discontinued the telephone Nonresponse Follow up operation because of declining response rates and increasing costs. Respondent data are still collected via telephone through the TQA operation. If the Census Bureau is unable to get a response by Internet, mail, or TQA, then the address may be selected for an in-person interview. Because of the high cost per completed interview, the Census Bureau samples about one in three nonrespondent housing units for personal visit interviews. The proportion of nonresponding households selected for in-person interviews is higher in areas with lower predicted response rates. A sample of people living in group quarters facilities—such as college dorms, skilled nursing facilities, or correctional facilities—are also interviewed in person to ensure coverage of people who are not living in housing units.
ACS data for small statistical areas (such as census tracts) have no control totals, which may lead to errors in the population and housing unit estimates. In such cases, data users are encouraged to rely more upon noncount statistics, such as percent distributions or averages.
To ensure that the ACS data are consistent with the Census Bureauʼs official estimates of population by age, sex, race, and Hispanic origin as well as estimates of total housing units, the ACS uses a weighting method. As stated in the ACS General Handbook (U.S. Census Bureau 2018b):
ACS estimates are controlled to official population and housing units at the county level. ACS single-year estimates are controlled to population and total housing unit estimates as of July 1 of the survey year, while ACS 5-year estimates are controlled to the average of the July 1 population and housing unit estimates over the 5-year period.
Starting with the 2009 survey, ACS estimates of the total population of incorporated places (self-governing cities, towns, or villages) and minor civil divisions (such as county precincts) are also adjusted so that they are consistent with official population estimates.
For more information about ACS methods, the reader can visit the Census Bureauʼs Design and Methodology Report Web page [https://www.census.gov/programs-surveys/acs/methodology/design-and-methodology.html].
* 5-year estimates only.
** 5-year estimates only, first released in 2012 for the 2007–2011 ACS estimates.
Source: U.S. Census Bureau 2018b.
Long Description.
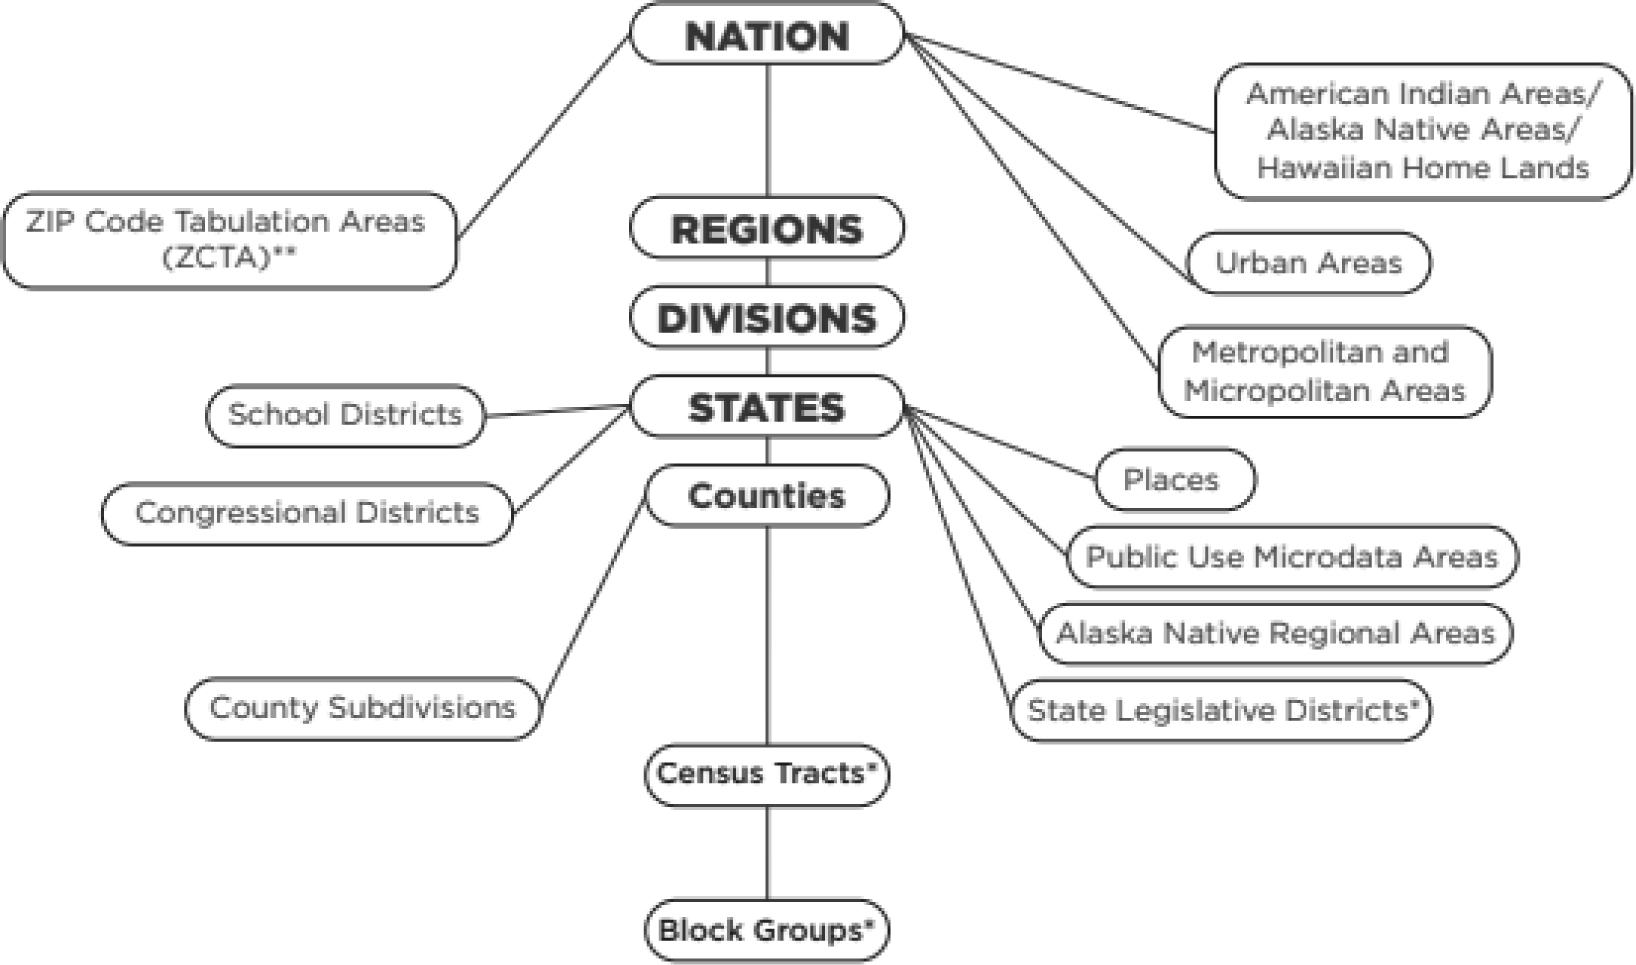
The chart presents a hierarchy of selected geographic entities used in the American Community Survey. At the top is Nation. Nation connects to Regions, Divisions, and States. States lead to Counties. From Counties, branches connect to Census Tracts and then to Block Groups. Counties also link to County Subdivision. States link to Congressional Districts, School Districts, Public Use Microdata Areas, Alaska Native Regional Areas, State Legislative Districts, and Places. Other entities such as ZIP Code Tabulation Areas, Urban Areas, Metropolitan and Micropolitan Areas, American Indian Areas or Alaska Native Areas or Hawaiian Home Lands, and Alaska Native Regional Areas are connected directly to Nation. A note at the bottom explains that some entities include 5 year estimates only or were first released in 2012 with 2007 to 2011 ACS estimates.
2.2 ACS Geographic Areas
Data from the ACS are tabulated for a variety of different geographic areas that range from broad geographic regions (Northeast, Midwest, South, and West) to state, city, town, census tract, and block group levels. To facilitate reporting by geography, the United States is subdivided into legal and statistical geographic areas, as discussed in the ACS General Handbook (U.S. Census Bureau 2018b).
Legal areas include state, local, and tribal government units and specially defined administrative areas like congressional districts. Many, but not all, of these legal areas are represented by elected officials. An example of a legal area is the State of California.
Statistical areas are defined directly by the Census Bureau and state, regional, or local authorities, and include census tracts and urban areas. The primary purpose of the statistical areas is to tabulate and present census data. An example of a statistical area is the Boston-Cambridge-Newton, MA-NH MSA.
Geographic areas are organized in a hierarchical structure (Figure 2.3), where larger units, such as states, include smaller units like counties and census tracts. This structure is based on the legal, administrative, or areal relationships of the entities.
2.3 Understanding and Using ACS Single-Year and Multiyear Estimates
This section focuses on estimates derived from the 1-year sample and the 5-year sample of the ACS and draws again from the ACS General Handbook to provide the nomenclature and information that is proper and consistent with the examples provided in the published document.
An ACS 1-year estimate is a period estimate that includes information collected over a 12-month period; an ACS 5-year estimate is a period estimate and includes data collected over a 60-month period.
For ACS 1-year estimates, the period is the calendar year, to cover demographic and travel information from all months of a given year. In the case of multiyear ACS estimates, the period is five calendar years (e.g., the 2013–2017 ACS estimates cover the period from January 2013 through December 2017). The ACS General Handbook cautions users that since multiyear ACS estimates are based on data collected from 2013–2017, they should not be labeled “2015,” even though that is the midpoint of the 5-year period.
Rather, multiyear estimates should be labeled to clearly indicate the full period of time (e.g., “The child poverty rate in 2013–2017 was X percent”). Note that multiyear estimates do not describe any specific day, month, or year within that time period. Multiyear estimates for consecutive years consist mostly of overlapping years and shared data.
Multiyear estimates are appropriate when working with large geographic areas because they benefit from the larger sample used for 5-year estimates, which results in more precise estimates of population and housing characteristics, especially for subpopulations within those areas.
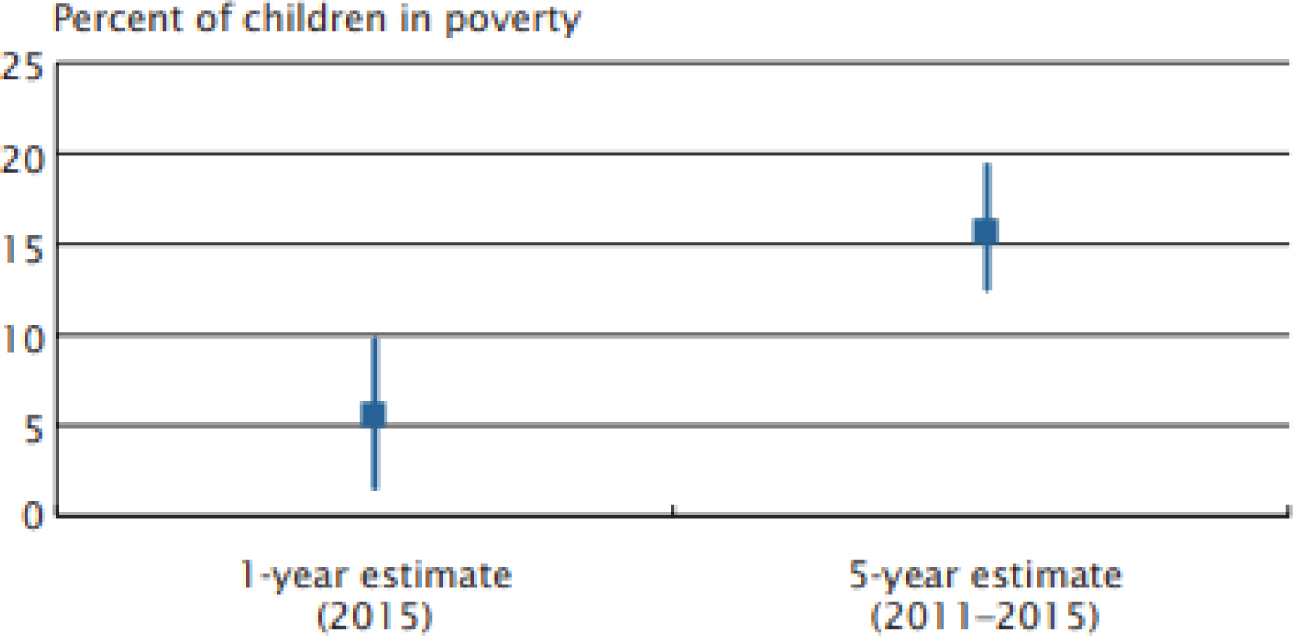
The biggest advantage of using multiyear estimates is the larger sample size on which the estimates are based. As a result, the statistical reliability of the data is higher compared with that of single-year estimates, especially for small geographic areas and small population subgroups. Figure 2.4 shows the improved precision of an ACS 5-year estimate, compared with a 1-year estimate, for child poverty statistics in Rice County, Minnesota, a county with about 65,000 residents in 2015. The lines intersecting the point estimates represent the confidence intervals around each estimate. The confidence interval for the 1-year child poverty estimate ranges from 1.4 percent to 9.4 percent (8 percentage points) while the interval for the 5-year estimate is narrower, ranging from 12.8 percent to 19.2 percent (a little over 6 percentage points).
While 1-year estimates reflect the most current data, they have larger MOEs due to a smaller sample size. Although 5-year estimates are less current since they reflect data collected over a 60-month time period, they have a larger sample size and smaller MOEs. This makes 5-year estimates more appropriate for small geographies and populations. One-year estimates are particularly useful for areas that are rapidly changing, but the multiyear estimates for these rapidly changing areas may be quite different from the single-year estimates for any of the individual years, even if the ACS single year is the midyear of the ACS multiyear period (e.g., 2015 single-year, 2013–2017 multiyear).
Source: U.S. Census Bureau, American FactFinder, Table DP03: Selected Economic Characteristics in the United States reproduced in the ACS General Handbook (U.S. Census Bureau 2018b).
Long Description.
The graph presents the percent of children in poverty in Rice County, Minnesota, using two estimates. The left data point is the 1 year estimate for 2015. It is near 6 percent and includes an error bar that ranges approximately from 3 percent to 10 percent. The right data point is the 5 year estimate for the period 2011 to 2015. It is near 16 percent and includes an error bar that ranges approximately from 12 percent to 19 percent. The vertical axis ranges from 0 to 25 percent. The horizontal axis lists the two time periods. Each estimate is marked with a square symbol and an error bar indicating margin of error.
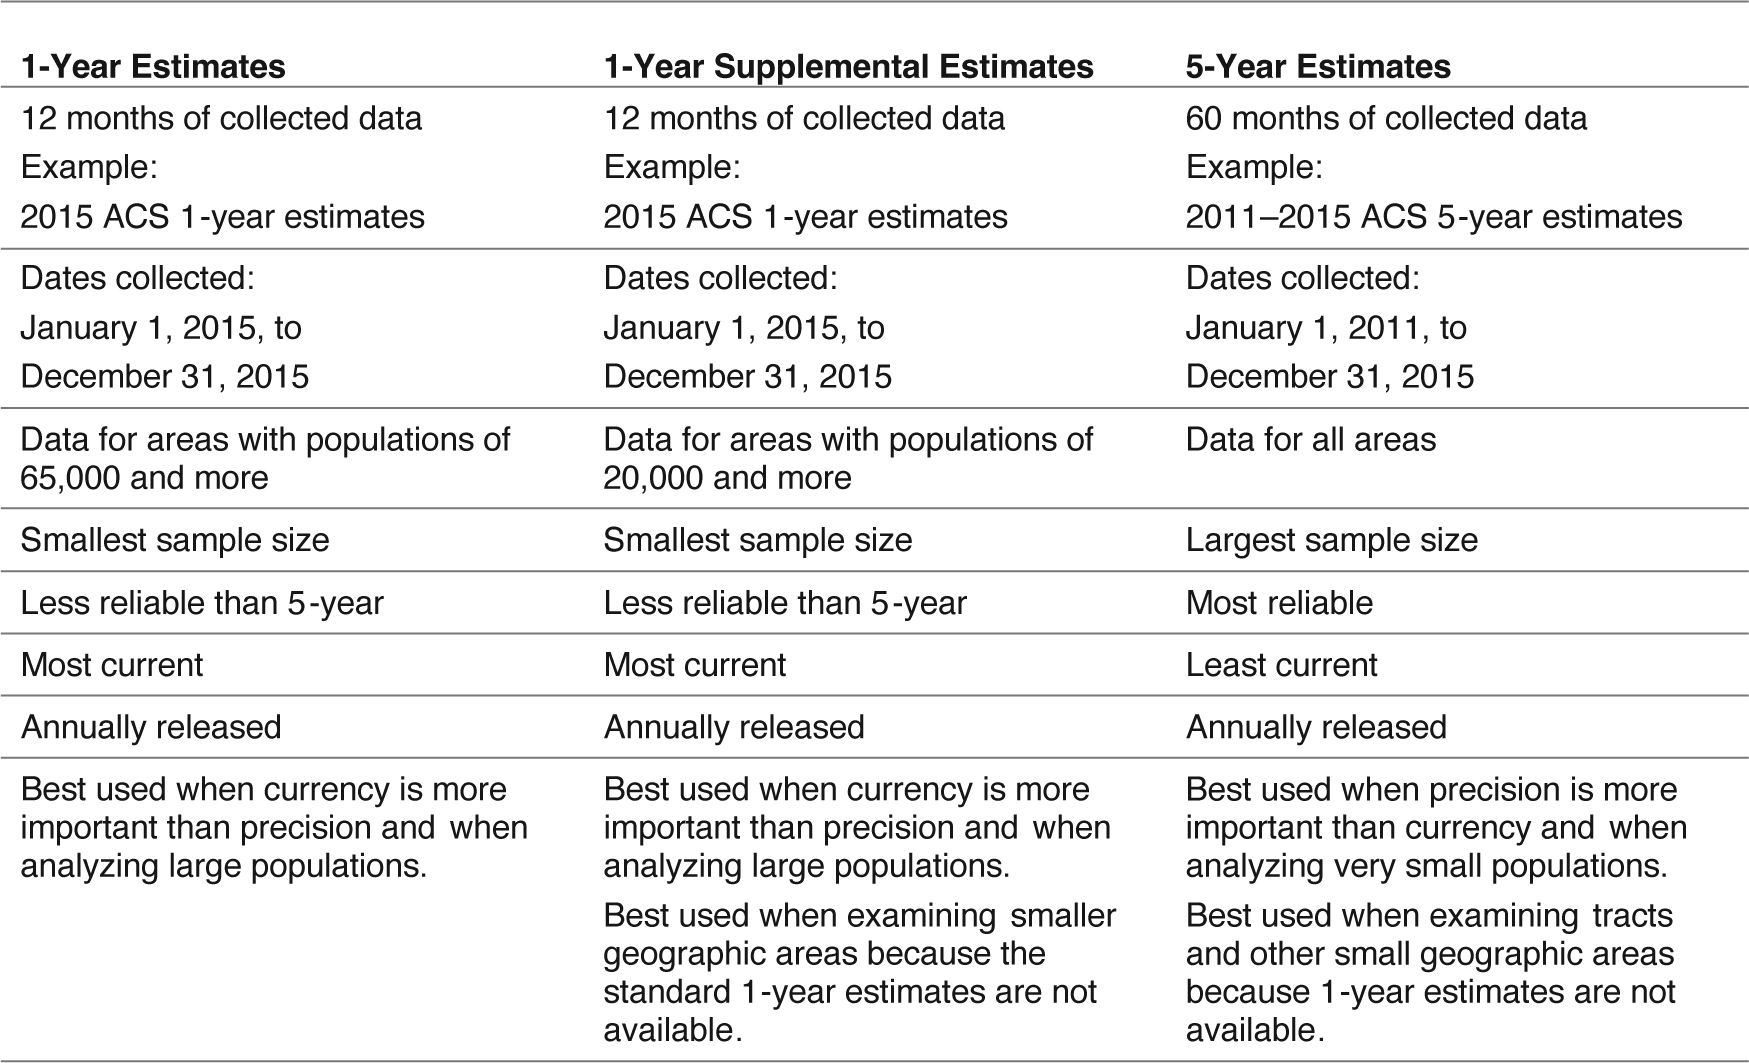
Table 2.1 shows the distinguishing features of ACS 1-year, 1-year supplemental, and 5-year estimates.
The disclosure rules for the ACS 5-year estimates are not the same as those applied to 1-year estimates. Some of the 1-year data tables are restricted from publication by the Census Bureau because the estimates are not reliable. For more information, the reader can visit the Census Bureauʼs web page on Data Suppression (www.census.gov/programs-surveys/acs/technical-documentation/data-suppression.html). When comparing ACS data over time, it is best to compare based on nonoverlapping estimates. When comparing ACS estimates across different geographic areas or population subgroups, the analyst should avoid comparing 1-year estimates to multiyear estimates due to the differences in sample size.
When comparing ACS data, it is best to compare based on nonoverlapping estimates, and when comparing ACS estimates across different geographic areas or population subgroups, avoid comparing 1-year estimates to multiyear estimates.
Concerning income reporting in the ACS, the ACS General Handbook provides this information (U.S. Census Bureau 2018b 64):
ACS income values are reported based on the amount of income received during the 12 months preceding the interview month. This is the income reference period. Since there are 12 different income reference periods throughout an interview year, 12 different income inflation adjustments are made. Monthly Consumer Price Index (CPI) Research Series Using Current Methods (CPI-U-RSs) are used to inflation-adjust the 12 reference period incomes to a single reference period of January through December of the interview year [see https://www.bls.gov/cpi/research-series/r-cpi-u-rs-home.htm]. Note that there are no inflation adjustments for 1-year estimates of rent, home value, or energy cost values.
ACS multiyear estimates with dollar values are adjusted for inflation to the final year of the period. For example, the 2013–2017 ACS 5-year estimates are tabulated using dollars adjusted to 2017. The section on “Using Dollar Denominated Data” from the ACS General Handbook provides more information on the adjustment of ACS single-year and multiyear estimates for inflation (U.S. Census Bureau 2018b).
Source: Adapted from Table 3.1 in ACS General Handbook (U.S. Census Bureau 2018b).
Long Description.
The table has three columns for 1-year estimates, 1-year supplemental estimates, and 5-year estimates. 1-year estimates use 12 months of collected data. Example is 2015 ACS 1-year estimates. 1-year supplemental estimates also use 12 months of collected data. Example is 2015 ACS 1-year estimates. 5-year estimates use 60 months of collected data. Example is 2011 to 2015 ACS 5-year estimates. Dates collected for both 1-year types are from January 1, 2015 to December 31, 2015. Dates collected for 5-year estimates are from January 1, 2011 to December 31, 2015. 1-year estimates are for areas with populations of 65,000 and more. 1-year supplemental estimates are for areas with populations of 20,000 and more. 5-year estimates are for all areas. 1-year and 1-year supplemental have the smallest sample sizes. 5-year estimates have the largest sample size. 1-year and 1-year supplemental are less reliable than 5-year estimates. 5-year estimates are most reliable. 1-year and 1-year supplemental are most current. 5-year is least current. All three estimates are released every year. 1-year estimates are best when currency is more important than precision and for large populations. 1-year supplemental estimates are best when currency is more important than precision and for large populations. They are also best for smaller geographic areas when standard 1-year estimates are not available. 5-year estimates are best when precision is more important than currency and for very small populations. They are also best for tracts and other small geographic areas when 1-year estimates are not available.
2.4 Understanding Error and Determining Statistical Significance
Given the importance of understanding error and statistical significance in the ACS, the following material is reproduced verbatim from the ACS General Handbook (U.S. Census Bureau 2018b).
The data in American Community Survey (ACS) products are estimates of the actual figures that would have been obtained if the entire population—rather than the chosen ACS sample—had been interviewed using the same methodology. All estimates produced from sample surveys have uncertainty associated with them as a result of being based on a sample of the population rather than the full population. This uncertainty—called sampling error—means that estimates derived from the ACS will likely differ from the values that would have been obtained if the entire population had been included in the survey, as well as from values that would have been obtained had a different set of sample units been selected for the survey.
Sampling error is the difference between an estimate based on a sample and the corresponding value that would be obtained if the estimate were based on the entire population. Measures of the magnitude of sampling error reflect the variation in the estimates over all possible samples that could have been selected from the population using the same sampling methodology. The margin of error is the measure of the magnitude of sampling error provided with all published ACS estimates.
In addition to sampling error, data users should recognize that other types of error—called nonsampling error—might also be introduced during any of the complex operations used to collect and process ACS data. Nonsampling error can result from problems in the sampling frame or survey questionnaires, mistakes in how the data are reported or coded, issues related to data processing or weighting, or problems related to interviewer bias or nonresponse bias. Nonresponse bias results when survey respondents differ in meaningful ways from nonrespondents. Nonsampling error may affect ACS data by increasing the variability of the estimates or introducing bias into ACS results. The U.S. Census Bureau tries to minimize nonsampling error through extensive research and evaluation of sampling techniques, questionnaire design, and data collection and processing procedures.
In addition to describing sampling error, the ACS General Handbook discusses measures of sampling error, touching on MOEs and confidence intervals, standard error and coefficients of variation, determining statistical significance, and comparisons across time.
2.4.1 MOEs and Confidence Intervals
On MOEs and confidence levels, the ACS General Handbook explains (U.S. Census Bureau 2018b):
A margin of error (MOE) describes the precision of an ACS estimate at a given level of confidence. The confidence level associated with the MOE indicates the likelihood that the ACS sample estimate is within a certain range (the MOE) of the population value. The MOEs for published ACS estimates are provided at a 90 percent confidence level. From these MOEs, data users can easily calculate 90 percent confidence intervals that define a range expected to contain the true or population value of an estimate 90 percent of the time. Estimates with smaller MOEs—relative to the value of the estimate—will have narrower confidence intervals indicating that the estimate is more precise and has less sampling error associated with it.
MOE describes the precision of an ACS estimate at a given level of confidence. Smaller MOEs indicate that the estimate is more precise and has less sampling error associated with it.
2.4.2 Standard Errors and Coefficients of Variation
On standard errors and coefficients of variation, the ACS General Handbook notes:
A standard error (SE) measures the variability of an estimate due to sampling and provides the basis for calculating the MOE. The standard error provides a quantitative measure of the extent to which an estimate derived from a sample can be expected to deviate from the value for the full population. SEs are needed to calculate coefficients of variation and to conduct tests of statistical significance.
The standard error of an estimate depends on the underlying variability in the population for that characteristic and the sample size used for the survey. In general, the larger the sample size, the smaller the standard error of the estimates produced from the sample data. This relationship between sample size and standard error is the reason that ACS estimates for less populous areas are only published using multiple years of data. Combining data from multiple ACS 1-year files increases sample size and helps to reduce standard errors.
Standard error measures the variability of an estimate due to sampling. The larger the sample size, the smaller the standard error of the estimates produced from the sample data. This relationship between sample size and standard error is the reason that ACS estimates for less populous areas are only published using multiple years of data.
Coefficients of variation are another useful measure of sampling error. A coefficient of variation (CV) measures the relative amount of sampling error that is associated with a sample estimate. A small coefficient of variation indicates that the standard error is small relative to the estimate, and a data user can be more confident that the estimate is close to the population value. The coefficient of variation is also an indicator of the reliability of an estimate. When the standard error of an estimate is close to the value of the estimate, the coefficient of variation will be larger, indicating that the estimate has a large amount of sampling error associated with it and is not very reliable.
2.4.3 Determining Statistical Significance
Statistical significance is a key issue that is discussed in the ACS General Handbook, given the sampling approaches used for collecting ACS data over time and across different geographies (U.S. Census Bureau 2018b):
One of the most important uses of ACS data is to make comparisons between estimates—across different geographic areas, different time periods, or different population subgroups. Data users may also want to compare ACS estimates with data from past decennial censuses. For any comparisons based on ACS data, it is important to consider the sampling error associated with each estimate by using a statistical test for significance. This test shows whether the observed difference between estimates likely represents a true difference that exists within the full population (is statistically significant) or instead has occurred by chance because of sampling (is not statistically significant). Statistical significance means that there is strong statistical evidence that a true difference exists within the full population. Data users should not rely on overlapping confidence intervals as a test for statistical significance because this method will not always provide an accurate result. When comparing two ACS estimates, a test for significance can be carried out by making several calculations using the estimates and their corresponding SEs. These calculations are straightforward given the published MOEs available for ACS estimates.
Details on computing the MOE, standard error, coefficient of variation, and statistical significance are available in Chapter 7 of the ACS General Handbook (U.S. Census Bureau 2018b).
2.4.4 Comparisons Across Time
Comparisons involving two estimates from the same time period (e.g., from the same year or the same 5-year period) are straightforward and can be carried out as described in Chapter 7 of the ACS General Handbook (U.S. Census Bureau 2018b):
. . . as long as the areas or groups are nonoverlapping (e.g., comparing estimates for two different counties, or for two different age groups). On the other hand, if the comparison involves a large area or group and a subset of the area or group (e.g., comparing an estimate for a state with the corresponding estimate for a county within the state, or comparing an estimate for all females with the corresponding estimate for African American females) then the two estimates may not be independent. In these cases, the data user may need to use a different approach that accounts for the correlation between the estimates in performing the statistical test of significance.
The comparison of two estimates for different, but overlapping periods is challenging since the difference is driven by the nonoverlapping years. For example, when comparing the 2010–2014 ACS 5-year estimates with the 2011–2015 ACS 5-year estimates, data for 2011 through 2014 are included in both estimates. Their contribution is subtracted out when the estimate of differences is calculated. While the interpretation of this difference is difficult, these comparisons can be made with caution. Under most circumstances, the estimate of difference should not be interpreted as a reflection of change between the last 2 years.
The use of MOEs for assessing the reliability of change over time is complicated when change is being evaluated using multiyear estimates. From a technical standpoint, change over time is best evaluated with multiyear estimates that do not overlap.
When comparing estimates from two multiyear periods, comparisons should ideally be based on nonoverlapping periods.
At the same time, many data users will not want to wait until 2024 (when 2018–2022 ACS 5-year data will be available) to evaluate change since the 2013–2017 time period. Users who need to compare two 5-year estimates of the same geography that overlap in sample years must use a different formula to calculate the standard error of this difference.


