The Air Traffic Controller Workforce Imperative: Staffing Models and Their Implementation to Ensure Safe and Efficient Airspace Operations (2025)
Chapter: 4 Comparison of Models for Estimating Staffing Targets at Air Traffic Control Facilities
4
Comparison of Models for Estimating Staffing Targets at Air Traffic Control Facilities
This chapter compares the Federal Aviation Administration’s (FAA’s) Office of Financial and Labor Analysis (AFN) staffing standards target modeling process and the Collaborative Resource Working Group (CRWG) staffing target modeling process. The CRWG is made up of representatives from FAA’s Air Traffic Organization (ATO) and the National Air Traffic Controllers Association (NATCA). Both models estimate the appropriate number of controllers at each of FAA’s 313 air traffic control (ATC) facilities. The chapter addresses the study’s charge to:
Compare the [two] staffing models and methodologies by reviewing similarities and differences in their structures, assumptions, data sources, and other components; their treatment of factors relevant to controller staffing requirements; the targets they produce for a varied selection of air traffic control facilities; and how well they conform to industry best practices for workforce planning.
Although both modeling processes are made up of steps that draw on nested models and procedures—and are thus properly understood as modeling processes—for simplicity’s sake, the chapter refers to each as a “model.” In addition, the AFN model produces what FAA typically refers to as a staffing “standard” or a staffing “standard target,” while the CRWG model produces a staffing “target.” For the purposes of this comparison, the models’ products are staffing targets, as they both could be used as inputs for “A” in FAA’s A−B+C=D modeling process (see Figure 1-1) that produces an estimate that informs the annual 10-year hiring plan. In addition, both
the AFN and CRWG models operate at the facility level and therefore must be aggregated to be used as input into FAA’s A–B+C=D modeling process as described in Chapter 1.
The chapter conducts its comparative analysis framed by the central tension between the two modeling processes: the CRWG model generally produces staffing targets that are greater than the targets produced by the AFN model. This is true both nationally and at a large majority of facilities. For 2024, the CRWG staffing target is 14,633 controllers, who are assumed to be Certified Professional Controllers (CPCs), while the AFN staffing target is 12,242 controllers.
The chapter begins with an overview of the AFN staffing standards target model and the CRWG staffing target model followed by a brief section discussing the use of Service Unit Input (SUI) in the past. The chapter then compares the models according to the criteria stated above from the study charge, highlighting key differences in how each model estimates position coverage hours, translates position coverage into work shifts, and defines “availability factors,” as defined later. Each model is then analyzed for qualities one would expect from a science-based approach to modeling, including traceability, relevance, adaptability, validation, data quality, and capacity for ongoing monitoring and periodic adjustment.
An important caveat with regard to the CRWG model is that it was originally developed and is currently used to guide the placement of Academy Graduates (AGs), placement of new hires with previous experience, and transfer of existing controllers among the 313 ATC facilities. This chapter does not consider the CRWG model’s usefulness in the placement and transfer distribution process.
FAA/AFN STAFFING STANDARDS MODEL
FAA’s development and use of staffing standards date to the 1960s, and the agency has periodically updated the various components to produce its current AFN model. The summary that follows is based on presentations from, consultations with, and information provided by AFN staff. There is no single public document that provides a comprehensive, detailed, and up-to-date description of the model, although AFN’s staff has assured the committee that such documentation is available in multiple notebooks for reference by FAA staff involved in running the various models within the AFN family of models.
Overview of Methods and Steps in the AFN Modeling Process
The AFN model operates at the facility level and produces preliminary staffing numbers using three parallel processes: the regression method, the 5-hour
Time on Position (TOP) method, and the minimum watch standard. These three processes are described in more detail below along with an explanation of how they are used in a stepwise manner to produce facility staffing targets. In short, for each forecast year, each method produces a staffing number for the facility, and the largest staffing number (after making certain adjustments as necessary) is set as the facility staffing standard. Staffing standards for different facilities, therefore, may be derived from different methods. The sum of the facility staffing standards is set as the overall staffing standards target for the forecast year.1
Figure 4-1 summarizes the steps that are followed for each of the three methods as well as the subsequent steps that are followed for selecting and adjusting the standard that will be used for each facility and for summing the standards across facilities. Details on each method and its steps are then provided.
Description of the Three Facility Staffing Number Methods
Method 1: Regression Method
The regression method calculates its preliminary staffing number by producing a daily staffing requirement for an entire year and then uses the daily staffing requirement for the 90th percentile traffic operations day as the “raw” staffing standard. The regression method uses an availability factor to transform the “raw” staffing standard into the preliminary staffing number for the facility.
Step 1-1: Engage On-Position Workload Requirements Models The on-position workload requirements model transforms a facility’s traffic for the base year, which is typically the previous year, into ATC operations. “Workload” is measured in time per task, as performed by a skilled and experienced controller working at a normal pace. Step 1 produces On-Position Requirements (OPR) for each 15-minute period of a year, which are the positions that must be open (staffed) to produce the amount of workload present during that period.
Because the various ATC facility types have different task profiles, there are different workload requirements models for En Route Centers, Terminal Radar Approach Controls (TRACONs), and Towers. The En Route Centers
___________________
1The description of the AFN model is drawn from FAA Staffing Standards Overview, presentation to the committee, June 3, 2024; NRC. 2014. The Federal Aviation Administration’s Approach for Determining Future Air Traffic Controller Staffing Needs, TRB Special Report 314. The National Academies Press. https://doi.org/10.17226/18824; FAA memo to the committee, January 24, 2025; FAA meeting with NASEM staff, February 19, 2025.

SOURCE: FAA. “FAA Staffing Standards Overview,” presentation to the committee, June 3; and FAA meeting with NASEM staff, February 19, 2025.
model was updated in 2015, while the TRACON and Tower models date to 2009 and 2008, respectively.2 Review of the inner workings of the workload requirement models are beyond the scope of this study; the committee relies on the review provided in the National Academies of Sciences, Engineering, and Medicine (NASEM) 2014 report.3
Step 1-2: Engage Shift Coverage Model The shift coverage model transforms the open positions per 15-minute period into the number of work-rule compliant, 8-hour person-shifts per 24-hour day.4 Shifts may overlap. The shift coverage model takes into consideration basic shift work rules covering meal breaks, rest breaks, and maximum TOP during a person-shift. However, it does not account for work rules that apply to the time between shifts.5 For these person-shifts to produce the required workload, they must be staffed by Position-Qualified Controllers (PQCs). The model assumes that PQCs are available to work these person-shifts. Therefore, Step 2 also produces the number of PQCs required per day. This number is called the daily staffing requirement.
Step 1-3: Develop Daily Staffing Forecast Model The daily staffing forecast model step produces an equation that can be used to estimate the number of PQCs required per day according to the number of daily operations. The equation is a linear regression that relates the daily staffing requirement (Step 1-2) to the input for Step 1-1, the daily traffic operations over 365 data points (1 point = 1 day) representing the base year. For an example see Appendix B, Figure B-11.
Step 1-4: Forecast Daily Staffing for the 90th Percentile Traffic Operations Day Step 1-4 uses the daily staffing forecast model equation produced in Step 3 to establish the number of PQCs required during the 90th percentile traffic operations day for the base year and forecasted for the next 13 years. The forecast of the number of daily operations on future 90th percentile days is based on FAA’s official aviation traffic forecasts for En
___________________
2The Tower model applies to stand-alone Towers and the Tower operations of Tower and Approach Control facilities. Similarly, the TRACON model covers TRACONs and the approach control operations of Tower and Approach Control facilities.
3For more information of the workload requirements models, refer to NRC (2014).
4The AFN and the CRWG models both use the word “shift” to mean a single person working an 8-hour period. To avoid confusion with more conventional uses of the word “shift” in employment contexts, this study instead uses the term “person-shift.”
5The NASEM 2014 report has a more complete discussion of work rules including what is not accounted for in the shift coverage model (NRC 2014, 65).
Route Centers and Terminal areas.6 To produce the 90th percentile traffic day for each year, the model assumes that the number of daily operations on the 90th percentile day grows at the same rate as FAA’s forecast for annual traffic. The 13-year forecast was chosen to support the Controller Workforce Plan’s (CWP’s) 10-year plan horizon.
During Step 1-4, adjustments are also made to account for staffing differences at Two-Tower facilities or facilities with seaplane traffic.
At this point, the modeling process has produced the number of PQCs required for a single day (the 90th percentile day) for each forecasted year. It does not yet account for the reality that controllers do not work 7 days per week, 365 days per year and have other off-position duties such as training.
Step 1-5: Apply the Availability Factor Step 1-5 transforms Step 1-4’s number of PQCs for the 90th percentile day into the number of PQCs required at the facility by multiplying it by the availability factor (1.82). This availability factor applies to all facilities and accounts for the 40-hour workweek; absences from work such as sick, parental, holiday, or annual leave; and other work that is performed when the controller is off position. The availability factor is based on controller timekeeping records and includes only the time-use profiles of CPCs.
The current availability factor of 1.82 was adopted in 2023. It is an increase over the former factor of 1.76, and the increase is based on average use of the new paid parental leave benefit and minor increases in training and administrative hours. A more detailed discussion of the AFN model’s availability factor is below in the section comparing the models.
Method 2: 5-Hour TOP Method
The 5-hour TOP method was added to the AFN model in 2017. The 5-hour TOP method produces the number of controllers that will ensure that the annual average TOP per PQC does not exceed 5 hours per day.
Step 2-1: Estimate Annual Hours of On-Position Time The 5-hour TOP method starts with the output from Step 1-1—open positions in 15-minute intervals over the base year. It sums the intervals to produce the total number of 15-minute intervals of work over the year. Dividing by four produces the annual hours of on-position time. Method 2 produces projections for
___________________
6See FAA. “FAA Aerospace Forecasts,” updated October 16, 2024, https://www.faa.gov/data_research/aviation/aerospace_forecasts; FAA, “Terminal Area Forecast,” updated January 22, 2024, https://www.faa.gov/data_research/aviation/taf.
each plan year by scaling the total annual hours of TOP for the previous year by one-half the percent change in traffic found in FAA’s official aviation traffic forecasts for En Route Centers and Terminal areas.
Step 2-2: Divide by Annual Number of 5-Hour TOP Shifts Dividing the annual hours of TOP by the product of 5 hours per shift and the average number of 8-hour shifts with TOP per controller per year produces the number of controllers required so that the annual average TOP does not exceed 5 hours. The average number of shifts with TOP is based on historical averages across all facilities, and the figure currently used is 208 shifts per year. Only shifts staffed by CPCs and CPCs-In Training (CPC-ITs) are included in the calculation of the 208.7
Step 2-3: Make Any Needed Adjustments and Round Up This preliminary staffing number is then adjusted to account for staffing differences at 2-Tower facilities and facilities with seaplane traffic and then rounded up to produce the 5-Hour TOP preliminary staffing number.
Method 2 does not use the availability factor. This is because the number of shifts with on-position time (i.e., the 208 shifts per year per controller) already excludes days covered by annual leave, sick leave, or Other Duties that prevent covering an open position for an entire day.
Method 3: Minimum Watch Standard
Facilities are subject to minimum watch standards during their hours of operation. Relevant for small facilities, the “raw” staffing standard is set by agreement with ATO.
Step 3-1: Start with Agreed-Upon Minimum Watch Standard The minimum watch standard is a “raw” staffing number that equals the minimum number of PQCs required per day.
Step 3-2: Apply Availability Factor To produce the preliminary facility staffing number requires multiplication by the availability factor. The same availability factor (1.82) is used in Step 1-4 and in Step 3-2.
___________________
7FAA. 2025. Memo to the committee, January 24; FAA meeting with NASEM staff, February 19, 2025.
Application of the Results of the Three Methods
Steps 4–6 take the three preliminary staffing numbers and choose one to be foundation for the facility staffing standard and the staffing standards target in the annual CWP.
Facility Staffing Standard
Step 4: Pick the Largest of the Three Preliminary Staffing Numbers The largest of the three preliminary staffing numbers becomes the staffing number for the facility.
Step 5: Apply Final Adjustments and Set as Facility Staffing Standard If no adjustments are required, the facility staffing value produced in Step 4 is set as the facility staffing standard. For certain facilities, the staffing number produced in Step 4 requires applying oceanic adjustments or manual adjustments or, for facilities that are not modeled, assigning flat rate values by hand before setting the facility staffing standard.
Staffing Standards Target for CWP
Step 6: Set Staffing Standards Target The sum of the facility staffing standards for each year is used as the overall staffing standards target for the CWP. For 2024, this number is 12,242 PQCs.
Relative Impact of the Three Staffing Standards Methods
The 5-hour TOP method and the minimum watch standard are designed to compensate for when the regression method produces a number that is too low, according to policy. While the minimum watch standard affects small facilities, the 5-hour TOP method is more likely to positively impact the staffing number for large facilities.
The number of facilities benefiting from the 5-hour TOP method varies from year to year. In the 2024 CWP, the 5-hour TOP method produced a staffing number greater than the regression method’s number for 38% of facilities. However, Level 10–12 facilities were far more likely to benefit from the 5-hour TOP method: for 78% of these facilities, their staffing standard was based on the 5-hour TOP method. For the 2023 CWP, these percentages were 35% and 60%, respectively.8
For most—but not all—facilities, the impact of the 5-hour TOP method is small. Since its implementation in 2017, the 5-hour TOP method has
___________________
8FAA, data comparing AFN modeling methods, delivered February 24, 2025.
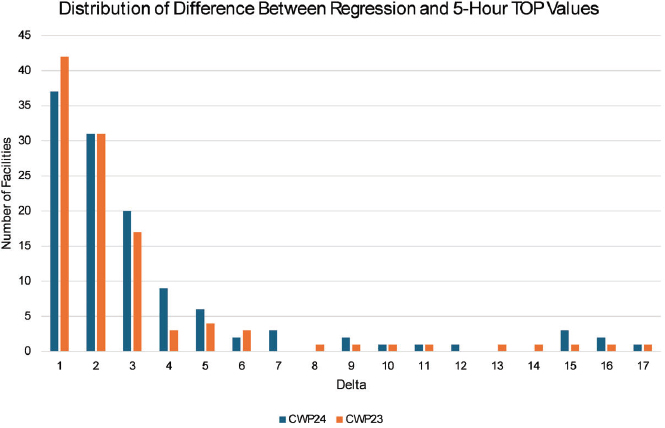
increased the overall staffing standards target by approximately 500 controllers, an increase of roughly 4%.9 In the 2024 CWP, 31% of the facilities benefiting received only one additional controller. As shown in Figure 4-2, a subset of facilities received 5 or more additional controllers, with the maximum being 17 additional controllers. In the 2023 CWP, 38% of the facilities benefiting received only one additional controller, with a similar long tail to the right in Figure 4-2.
Although the 5-hour TOP method does not use the availability factor, an increase in the availability factor applied to the regression method could reduce the number of facilities that rely on the 5-hour TOP method. The sensitivity of the split between facilities relying on the regression method versus the 5-hour TOP method to changes in the availability factor has not been explored.
CRWG STAFFING TARGET MODEL
The CRWG model produces facility-level staffing targets, and like the AFN model its estimates could also be aggregated and used as an overall staffing target in the hiring planning process. The CRWG model was originally developed to produce staffing targets in Fiscal Year (FY) 2016, and it has
SOURCE: FAA.
___________________
9FAA. 2025. Memo to the committee, January 24.
since been revised twice in response to field experience. The CRWG model was designed specifically to ensure that the modeling process accounts for the time that controllers need for leave and activities such as training and career development in addition to the time needed for meeting operational demands. As a result, the model consists of steps that estimate controller staffing required to meet both the operational demands on and the nonoperational needs of the controller workforce. Although the AFN and CRWG model a generic controller, unlike the AFN model for which facility strength is assessed in terms of CPCs and CPC-ITs, for the CRWG model facility strength is assessed using CPCs only.
To date, ATO has used the CRWG model to set priorities for placing AGs and managing transfers. However, in response to a decade of declines in controller staffing levels, CRWG staffing targets emerged as competitors to those produced by AFN. The CRWG model version reviewed here was used to produce staffing targets for FY 2023–2024, as documented in the 2023 report conducted by MITRE (2023). This chapter assumes that were it to be used as a regular part of developing the staffing target, the CRWG modeling process would be produced annually.
Description of the CRWG Model’s Steps
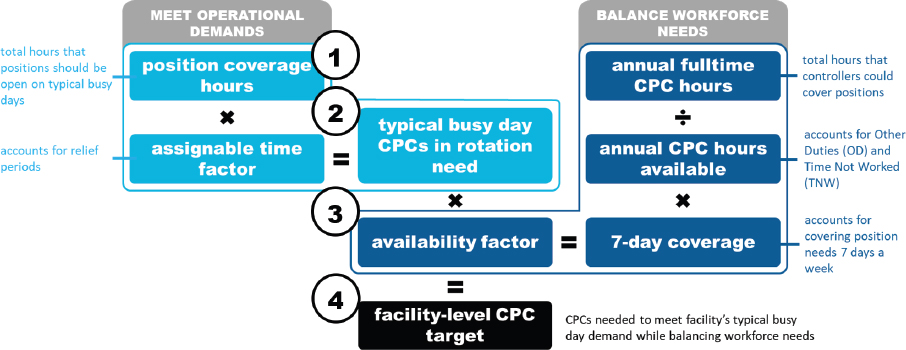
As depicted in Figure 4-3, the CRWG model is made up of four main steps. Steps 1 and 2 estimate CPC staffing required to meet operational demands. These steps in the model estimate a facility’s CPC staffing target for the operational demands of a “typical busy day,” which is similar but not identical to the AFN model’s use of the 90th percentile traffic day. Step 3 estimates time required for the nonoperational activities and needs of CPCs (i.e., the availability factor), and Step 4 estimates the number of CPCs needed on typical busy days to meet operational demands when the availability factor is taken into account. These four steps are detailed next.
Step 1: Determine Position Coverage Hours for a Typical Busy Day
The model establishes the number of on-position hours for a facility’s typical busy day through a survey of the facility’s leadership. Survey results are then verified, validated, and if necessary, calibrated before being accepted into the model. The CRWG expects that each facility survey will be completed via a collaborative process that includes the facility’s air traffic manager and NATCA representative.
The facility chooses the typical busy day, with the expectation that this day is “consistent with the 90th percentile day.” The survey instrument is a spreadsheet that is prepopulated with all the facility’s ATC positions. To
SOURCE: MITRE 2023, Figure ES-1.
complete the survey requires marking the positions requiring on-position coverage by 48 half-hour time blocks. The CRWG did not instruct facility leadership on how to determine position coverage needs. As the MITRE (2023, 2, 4) report documenting the CRWG model describes,
The CRWG did not set an expectation for how facility leadership should use specific data when responding to the survey, and therefore, assumed that some respondents would consult specific traffic playback data, while others would rely on their knowledge of position coverage needs based on experience.
The survey results can be used to tally the total number of hours that all positions require coverage and the number of hours a specific position requires coverage. The survey results can also be summed to identify the peak hours requiring coverage and the pattern of coverage hours over the course of the day.
A facility’s survey response is first verified, which checks that the survey is filled out completely and accurately.
A facility’s survey response is then validated against historical records for position hours covered during a typical busy day, defined as the mean value of the 10 days nearest the 90th percentile traffic operations day in a previous FY.10 Validation uses a series of two tests that establish whether the survey response hours are close enough to hours covered in the past to be acceptable. The first test validates total facility positions hours, and the second test includes a position-by-position comparison to create a hybrid survey/historical typical busy day for validation at the facility level.
A survey response that does not pass any validation test undergoes initial calibration. Calibration is done position by position with an algorithm that takes into account nine “conditions” representing different mixes of the number of days per year the position was in use (to determine frequency of position use) and the facility’s overall reliance on overtime during a previous year. Each condition’s position hours (for substitution for the survey response) uses either the maximum or mean position hours of the 10 days nearest the 90th percentile traffic operations day.
It merits noting that the CRWG model depends on past staffing levels, especially for its validation and calibration steps, that were influenced by the AFN model’s outputs. The CRWG model as conducted for 2023/2024 is not completely independent of the AFN model.11
___________________
10Because of the COVID-19 pandemic, MITRE 2023 uses FY 2019 and FY 2022 as its previous base years for its 2023 application of the CRWG model.
11This paragraph was revised after release of the report to clarify the CRWG validation and calibration process.
Step 2: Determine Number of CPCs in Position Rotation for Typical Busy Days
Step 2 estimates the number of controllers—assumed to be CPCs—needed for the total position hours on typical busy days. The calculation first divides the total position hours by 8 (for one CPC working an 8-hour person-shift). This produces the number of CPCs needed for typical busy days if a CPC could be on position for the time spanning an entire shift. Because work rules such as rest and meal period requirements prevent being on position for an entire shift, the number of CPCs is adjusted upward by an Assignable Time Factor of 1.3 (i.e., it takes 1.3 CPCs to cover 8 hours of on-position work).12
The CRWG established the 1.3 Assignable Time Factor through consultation with experienced ATC shift schedulers and subsequent validation through simulation modeling.
The Step 2 method above works unless a facility has such peak demand periods that the total number of CPCs per day established in Step 2 would be insufficient to meet peak demand periods. This would typically happen because the facility’s demand for open positions includes a strong daytime peak and evening peak that cannot be covered by the same CPCs. Thus, to complete Step 2, the CRWG method tests and then calibrates for “high variability in time distribution,” which, when needed, has the effect of adjusting upward the total number of CPCs needed for typical busy days.
The CRWG also chose not to “overfit” the model. For the small number of ATC facilities where the model produces a number of CPCs that differs significantly from historic staffing levels, there is a provision to use subject matter experts to calibrate by hand the number of needed CPCs.
Step 3: Determine the Availability Factor
Like the AFN model, the CRWG model uses an availability factor to convert the total number of CPCs per typical busy day into a facility CPC headcount. The CRWG availability factor, 2.14, is calculated based on historical timekeeping records as well as “requirements” and “expectations” found in FAA orders, statutes, Collective Bargaining Agreements (CBAs), and other policies. The CRWG’s availability factor uses expectations for annual leave and sick leave and therefore assumes that a CPC uses (or should be able to use) all such leave every year. The CRWG availability factor combines historical timekeeping hours and hours based on orders, statutes, and CBA for categories of required Other Duties including CPC-provided
___________________
12MITRE (2023, 2–12) provides the following example: “A facility with 28.5 validated position hours would require 5 controllers (28.5/8 * 1.3 = 4.63, round[ed] up to 5).”
trainee training, CPC training, team meetings and performance reviews, workgroups, and labor-management relations. A more detailed discussion of the CRWG model’s availability factor is provided below in the section comparing the models.
Step 4: Determine the Facility’s CPC Staffing Target
To determine the facility’s staffing target, the number of CPCs needed on typical busy days is multiplied by the availability factor. For facilities with an insufficient number of Operations Supervisors for the required Watch Supervision, a position that CPCs can also fill, the gap in Watch Supervision projected to be filled by CPCs is added to the CPC staffing target.
If the CRWG modeling process were to be used to generate an overall CPC staffing target for the annual CWP, there would be a Step 5 that summed the facility-level staffing targets. For 2024, this number would be 14,633 CPCs.
SERVICE UNIT INPUT
Before 2016, AFN and ATO engaged in annual negotiations about appropriate facility staffing standards based partly on input from the field about the adequacy of the proposed targets. This was referred to as “Service Unit Input (SUI),” and it reflected the expert judgment of facility managers and others in ATO. ATO relied on surveys of facility managers to gather their expertise, although it is unclear whether the surveys were conducted annually. Instead of a staffing standard represented by a single integer, the staffing standard was presented as staffing range based on the modeled output and three other considerations that included SUI via a negotiation between AFN and ATO.13
The committee for the NASEM 2014 report concluded that comparing the AFN model’s estimate with SUI was appropriate because the variety of conditions among the 313 facilities meant that the AFN model would be unable to account for all the unique operational aspects of individual facilities that should be considered in setting staffing targets. Such conditions might include, for example, airline plans to add a new hub or otherwise expand traffic at a particular airport, rapid population growth around small airports in the periphery of a metropolitan area, or unusually high peaks and valleys in traffic operations. Although the 2014 NASEM report committee supported AFN and ATO combining modeled outputs with SUI, it also observed that the processes by which SUI was generated were not
___________________
13For a more detailed explanation of how SUI worked prior to 2015, refer to NRC 2014, 71–72. This paragraph was revised after release of the report to clarify the derivation of the staffing standard range.
well documented and appeared to have changed over time for unexplained reasons. In its Recommendation 3-3, the 2014 NASEM report committee stated that “FAA should ensure that the field understands the staffing process by providing greater clarity and transparency, and it should continue collaborative efforts ensuring that local facility considerations are properly addressed in—and continuously fed back to—its generation of the staffing standards” (NRC 2014, 76). The 2014 NASEM report committee’s recommended practice of combining modeled estimates with SUI reflected current practice at the time and continued to be followed by FAA until 2016 when the first CRWG facility staffing targets were produced.
The CRWG method can be understood as an elaborate process for generating the SUI used in the past. The CRWG first produced its own staffing targets for FY 2016–2018 and released a second set for FY 2019–2022.14 With the documentation completed by MITRE, the FY 2023–2024 targets were the first time that the CRWG procedures were made fully traceable and transparent.
COMPARISON OF STAFFING MODELS
The study’s statement of task asks for a comparison of the AFN and CRWG modeling approaches based on their structure, targets, data sources, other factors, and conformance with best practices for workforce modeling. As shown in the previous sections and summarized in Table 4-1, the two modeling methods have similar structures inasmuch as they both follow a series of steps and rely on the 90th percentile traffic day—albeit in different ways—as the operational day for the staffing target. However, the details of each model’s steps are quite different. The three most important differences are (a) how they ascertain OPR, (b) how they convert OPR to staff shifts, and (c) how they conceptualize and construct the availability factor.
Establishing On-Position Requirements
Establishing OPR at the facility level is the foundation of both the AFN and CRWG models. For this purpose, the AFN model uses the three workload requirements models and base year traffic data to produce OPRs in 15-minute intervals over the year. Therefore, given a set of traffic inputs, the models will produce a consistent set of OPRs. The models’ ability to simulate 15-minute intervals over an entire year is a powerful capability that can be used to examine the impact on staffing of changes in the amount and distribution of traffic during a day, week, month, or year. However, because workload requirements can be affected by changing conditions,
___________________
14The CRWG staffing targets for these years are documented in their respective CWP.
TABLE 4-1 Summary Comparison of AFN and CRWG Staffing Models
| Model Process Element | AFN Staffing Standards Target Model | CRWG Staffing Target Model |
|---|---|---|
| ATC staff type modeled | Models hours per day requiring position coverage that is converted into shifts staffed by PQCs | Models hours per day requiring position coverage that is converted into shifts staffed by PQCs, who are assumed to be CPCs |
| On-position requirements | Annual deployment of workload models from 2008, 2009, 2015; traffic data from the base year | Surveys of facility leadership; staffing validated and calibrated with traffic operations data from base year |
| Modeled time period | Entire base year and projected years | Typical busy day(s), consistent with 90th percentile traffic day of base year |
| Account for within shift work rules | Shift coverage model or indirectly in 5-hour TOP method | Assignable Time Factor model |
| Account for between shift work rules | No | No |
| Forecasting capability | Yes | Not currently |
| Day chosen for staffing | 90th percentile traffic day (regression method only) | Typical busy day(s) |
| Availability factor | 1.82 | 2.14 |
| ATC staff type for availability factor | CPC | CPC |
| Availability factor base data | Historical timekeeping records only | Combination of historical timekeeping records and orders, statutes, and CBA |
| Role of local/field expertise | Used in developing workload models and, before 2016, in making final adjustments to targets | Used throughout the process, including for the survey and Assignable Time Factor |
| Overall staffing targets (2023 and 2024) from controller workforce plans | 12,062 (2023) and 12,242 (2024) PQCs | 14,633 (2023 and 2024) CPCs |
| Overall staffing target (2024)/availability factor | 6,727 PQCsa | 6,838 CPCs |
a For the AFN model, dividing the 2024 national staffing target by AFN’s availability factor gives only a rough estimate of the number of controllers required for baseline staffing because 119 facilities relied on the higher staffing number produced by the 5-hour TOP method, which does not use an availability factor.
such as in air traffic flow, airspace design, and traffic control technologies, the models require periodic updating to accurately represent the controller task environment (NRC 2014). In this regard, it merits noting that the three models that are currently in use were published in 2008, 2009, and 2015.
The CRWG model surveys facility leaders, asking them to schedule TOP in 30-minute increments for a typical busy day consistent with a 90th percentile traffic day, which is then validated and, if necessary, calibrated with base-year traffic data. This survey, therefore, draws on local expertise that is reflective of current practice and conditions. In this regard, the model has currency. However, like the AFN model, it does not have the capacity to predict changes in workload associated with external developments such as new aircraft types or operations technologies.
Despite the CRWG model’s validation and calibration procedures, it is possible that idiosyncrasies among those filling out the survey will affect the CRWG model’s OPRs outputs. Moreover, because the CRWG model only collects survey data on the typical busy day, there is no easy way to replicate the AFN model’s capability to examine the impact on staffing of changes in the amount and distribution of traffic over different time intervals.
Converting Position Coverage Time to Person-Shifts
Both models have a method to convert the OPRs for a 24-hour period into the number of person-shifts that meet basic within-shift work rules. However, because both models are limited to 24-hour periods, neither model currently includes the ability to model the impact on staffing targets of policies governing rest periods between a controller’s consecutive shifts. Both models estimate that, at their target level, facilities will have an adequate number of controllers available for each shift. (Refer to Chapter 3 for the importance of maintaining adequate rest periods between shifts for managing fatigue.)
Both models incorporate basic work rules for rest periods and maximum TOP. The AFN model’s shift coverage model directly schedules the rest periods required per shift (two 15-minute breaks and one 30-minute meal breaks) as well as enforcing the 2-hour maximum TOP requirement. Although the AFN model’s 5-hour TOP method does not directly model rest periods, by limiting the average TOP per shift to no more than 5 hours, there should be—on average—time for the rest periods in the 3 hours per shift the controller is not on position. For the CRWG model, the mandated rest periods and maximum TOP were integrated into the simulations that validated the Assignable Time Factor used to generate the number of CPC-staffed shifts required per day.
The models differ in the importance they attach to emulating real-life shift schedules. Although the AFN’s shift coverage model schedules shifts,
the purpose of the shift coverage model is to generate the number of required person-shifts per day. It is not intended to model shift schedules as they would—or should—happen at a facility. For example, the model allows the first task during a 15-minute increment of TOP to take place as early as minute 1. It also allows stints on position during a shift to be as short as 15 minutes. The shift coverage model also makes no attempt to even out TOP among the shifts.15
Although the CRWG model does not directly schedule shifts, the simulations used to validate the 1.3 Assignable Time Factor did emulate real-life CPC-staffed shifts. The simulations used three 20-minute breaks (instead of two 15-minute and one 30-minute breaks) because the CRWG has concluded that three 20-minute rest periods better represent what actually happens at facilities, while still providing for the same total minutes of required rest per shift. The 20-minute breaks are to allow for time to transfer on-position duties to the next in rotation, recuperate, and move about the facility. The simulations also used a rotation of 60- to 90-minute stints on position, rather than 2 hours, which will tend to even out TOP among the shifts.
Because the AFN model’s shift coverage model is only intended to produce the number of person-shifts and thus controllers required per day, the AFN model’s shift coverage model’s approach is consistent with its intended outcome.16
Use of Availability Factors
Both the AFN and CRWG models use an availability factor to convert the number of controllers on the 90th percentile day/typical busy day into a facility staffing standard (AFN model’s regression method) or a facility CPC headcount (CRWG model). Both models apply a single availability factor to all facilities. Both availability factors account for the 5-day workweek, although they differ in their estimates of and assumptions about Time Not Worked and time on nonoperational Other Duties. In addition, both availability factors are based on the time use profiles of CPCs, which makes them directly comparable.17
The CRWG model uses an availability factor (2.14) that is 17.6% higher than the AFN model’s availability factor (1.82). (A higher availability
___________________
15FAA meeting with NASEM staff, February 19, 2025. FAA recognizes that for non-24-hour facilities, starting the day with a shift that may have a task on minute 1 and ending the day on position may be problematic for the estimate of the daily staffing requirement because these facilities need time within a shift to open and close the facility. However, FAA does not believe this problem affects 24-hour facilities.
16CRWG, presentation to the committee, June 3, 2024.
17FAA meeting with NASEM staff, February 19, 2025.
factor produces a higher staffing target.) For time spent on Other Duties, the models differ in the total number of hours spent on Other Duties and in the percentage of Other Duties that can be accomplished during slow periods of the day, week, or season. As shown in Table 4-2, the CRWG model estimates a CPC should spend 336 hours per year on Other Duties and subtracts all these hours from full-time hours in the availability factor calculation. Of the 200 hours per year that historical records show a CPC spends on average on Other Duties, the AFN model sets aside only 128 hours into its availability factor calculation. The remaining 72 hours are assumed to happen during slow periods. Finally, the CRWG model’s estimate of Time Not Worked is 27 hours higher than in the AFN model. These differences in the availability factors are examined in more detail below.
Historical Timekeeping Data
Both availability factors depend on the FAA timekeeping system called CRU-Art for the historical data used to calculate their availability factors. Timekeeping data are divided into four main types: Time on Position (TOP), Time Not Worked, time on Other Duties, and Available Time. TOP is as discussed previously. Time Not Worked includes annual leave, sick leave, parental leave, and other types of leave. Time on Other Duties is work that is conducted while not on position. Available Time is time spent on required breaks and the meal period as well as indicating time during a shift when a controller is neither on position nor engaged in Other Duties.
FAA has acknowledged that CRU-Art does not capture all time spent on Other Duties. For Time Not Worked, however, historical data are
TABLE 4-2 Comparison of the CRWG and AFN Models’ Availability Factors
| Category of Annual Hours | CRWG Model (Hours/CPC) | AFN Model (Hours/CPC) | +/− Hours |
|---|---|---|---|
| Full-Time Hours | 2,087 | 2,087 | — |
| Time on Other Duties (TOD) | 336 | 128 | +208 |
| Time Not Worked (TNW) | 384 | 357 | +27 |
| Available Hours = Full-Time Hours − (TOD + TNW) | 1,367 | 1,602 | -235 |
| Availability Factor = Full-Time Hours ÷ Available Hours * 7 ÷ 5 | 2.14 | 1.82 |
SOURCE: FAA Office of Financial and Labor Analysis. 2024. “FAA Staffing Standards Overview,” presentation to the committee, June 3; and MITRE. 2023. “Collaborative Resource Workgroup Certified Professional Controller Targets: Methodology,” November, The MITRE Corporation.
considered accurate because it is also tracked in the system that determines controller pay.18
Treatment of Time Not Worked
The CRWG estimate for Time Not Worked is 27 hours greater than the AFN’s estimate and makes up 11% of the difference in hours between the two availability factors. This is because the AFN model uses historical averages for all types of leave, while the CRWG assumes that each CPC takes (or should be able to take) all the annual leave and sick leave accrued per year and only uses historical data for other types of leave. For sick leave, historical records indicate that the CRWG’s Time-Not-Worked assumption does not reflect current controller behavior.19 Controllers have an incentive to bank unused sick leave because they are paid for it at retirement; with no limits on accrued sick leave, some controllers have carried substantial leave balances in the past but the committee is informed by FAA that such instances are rare currently. On the other hand, historical averages for annual leave taken may be influenced by insufficient staffing that may impact the amount of annual leave taken, as some controllers may be unable to use all their annual leave as they would have preferred.
The CRWG’s approach to Time Not Worked is consistent with its model objective to address time for operational demands and time for leave.
Treatment of Time on Other Duties
Almost 90% of the difference between the two availability factors is in their calculation of time on Other Duties. As shown in Table 4-2, the CRWG’s 336 hours per year is 208 hours greater—more than double—the 128 hours used in the AFN model. This difference is rooted in divergent approaches to mitigating the risk that Other Duties are not performed or are performed inadequately. In addition, the difference shown in Table 4-2 has two distinct drivers: a difference in approach to calculating total hours of Other Duties and a difference in approach to accommodating Other Duties during slow periods during a day, week, or season. Each is elaborated on next.
Methods for Calculating Total Time on Other Duties
The AFN model’s 200 hours per year of total time for Other Duties is based solely on historical data in timekeeping records. The CRWG’s 336-hour estimate of time on Other Duties combines historical data with estimates of
___________________
18FAA memo to NASEM staff, January 10, 2025.
19Input provided by FAA.
TABLE 4-3 CRWG’s Breakdown of Annual Time on Other Duties per CPC
| Types of Other Duties | Hours/CPC | Source | |
|---|---|---|---|
| Historical Hours | Orders/Statutes/CBA | ||
| CPC-Provided Training | 95 | 6% | 94% |
| Training for CPCs | 79 | 61% | 39% |
| Team Meetings and Performance Reviews | 75 | 4% | 96% |
| Workgroups (local and national) | 49 | 32% | 68% |
| ATC-Related Administrative | 23 | 100% | |
| Labor-Management Relation Duties | 15 | 100% | |
| Total | 336 | ||
SOURCE: MITRE. 2023. “Collaborative Resource Workgroup Certified Professional Controller Targets: Methodology,” November. The MITRE Corporation.
the time required to complete six specific types of duties (outlined in Table 4-3), as defined by the National Training Initiative (NTI) and other sources and by FAA orders, statutes, and CBAs.20
Depending solely on historical data in timekeeping records assumes a timekeeping system that clearly identifies how to categorize hours and depends on thousands of controllers reporting a complete and accurate categorization of hours worked. There is broad agreement that FAA’s historical timekeeping data are not complete and accurate, especially for Other Duties. FAA has indicated that it is a known problem that some time spent on Other Duties may be being erroneously categorized as the default category Available Time.21 In addition, exclusively relying on historical timekeeping data makes it impossible to accurately account for time on Other Duties that have been skipped or rushed in the past, including because the controller workforce at many facilities is potentially under stress tied to inadequate staffing.
Therefore, AFN’s estimate of 200 hours for Other Duties is likely an underestimate of both the time spent on Other Duties as well as the time that should be spent on Other Duties.
To produce its estimate of time on Other Duties, the CRWG divides these duties into six categories, as described in Table 4-3. The CRWG developed its hours per category by first constructing them according to
___________________
20The NTI is a collaborative effort between FAA and NATCA launched in 2019 to set standards and expectations for training hours. NATCA and FAA, “Training the Workforce of the Future: National Training Initiative (NTI),” January 2025, https://www.natca.org/wp-content/uploads/2025/01/NTIPowerPoint.pdf.
21FAA presentations to the committee, June 3, 2024.
a “specific, identifiable time requirement or expectation” in the NTI, orders, statutes, CBAs, or other sources (MITRE 2023, 2–15). Where such requirements do not exist, the CRWG used historical timekeeping data. The MITRE report’s Appendix B provides detailed methods for estimating time on Other Duties. The summary below highlights the types of Other Duties in each category and the sources that the CRWG used to determine the number of hours.
The CRWG resorted to looking beyond historical data to estimate its total hours of Other Duties because of the inadequacy of timekeeping data described above. This inadequacy also made it impossible to validate the CRWG’s approach. In addition, the five subtypes of Other Duties that the timekeeping system tracks do not represent enough granularity to allow tracking the CRWG’s six categories of Other Duties. According to the timekeeping system, in FY 2024, 53% of Other Duties hours were accounted for in the catchall “Other” Other Duties category, and the Other Duties subtype for training includes only “offsite” training.
The CRWG’s largest category of time on Other Duties is CPC-provided training (95 hours). The CRWG “determined that CRU-ART data did not capture most of the CPC requirements for developmental training” and therefore added hours for training team meetings, certification skill checks, certifications, and pre/post meetings in support of On-the-Job Training (OJT). The expected hours for the training team meetings and certification skill checks came from the NTI. The expected time for certifications is based on the number of controllers who took certification training from CPCs in the base year. The time for pre/post OJT meetings was also derived from the NTI. (The CPC-provided training category does not include when a CPC is on position jointly with a CPC-IT or Developmental [DEV] as part of OJT. This type of TOP is accounted for in Step 1 and 2 of the CRWG model.)
The methodology to calculate CPC-provided training is dependent on the number of trainees in the base year, and therefore choosing the appropriate base year is important. If a base year has an unusually high (or low) number of AGs, other new hires, and CPC transfers, this will increase (or decrease) the total number of hours of required CPC-provided training. If this increase (or decrease) is incorporated into the availability factor, it will increase (or decrease) the staffing target. The risk is a situation where a sudden and temporary increase (or decrease) in the need for CPC-provided training sends a signal through the availability factor that staffing targets need to be increased (or decreased) for future years, which is obviously not the intent. Simply hiring a greater-than-usual number of controllers or having an unusually large number of transfers should not be sending a signal to increase the staffing target, unless these numbers are going to persist for years.
According to the MITRE report, the 95 hours of CPC-provided training are based on the number of trainees in FY 2022. Compared to 2014–2023, the number of CPC-ITs (943) in FY 2022 was the lowest in the decade,
while the number of DEVs (1,659) was above average. Summing the CPC-ITs and DEVs, the number of trainees per year over the decade ranges from 2,051 to 3,304. Basing the number of trainees on an average over a longer time period, either backward looking or forward looking keyed to the CWP, would mitigate the risk of sending the wrong signal through the availability factor. Because most facilities know how many hours it takes to qualify in their facility, this number could be acquired by facility.
The second category of Other Duties that the CRWG determined was severely undercounted in the historical timekeeping records was team meetings and performance reviews. The CRWG added 52 hours for the weekly meetings called for in the NTI and additional hours for receiving annual reviews as specified by FAA order as well as expected monthly performance reviews for an annual total of 75 hours.
For CPC training (such as electronic Learning Management System training, recurrent training, refresher training, and proficiency training), the CRWG supplements the recorded hours of training with hours that reflect the training that CPCs should be receiving according to FAA orders.
For time spent on workgroups, CRWG determined that the historical timekeeping records do not track time spent on Local Safety Councils, the Safety Awareness for Excellence discussions (as required by FAA Order), or on national working groups. Finally, the CRWG determined that historical timekeeping records also do not adequately track time spent on labor-management relations, as described in the CBAs.
The committee reviewed the CRWG’s documentation of its total hours of Other Duties in the MITRE report’s appendix and FAA Order Job Order (JO) 3120.4S, which covers training. The review could not validate the CRWG’s total hours of Other Duties, especially the 79 hours for training for CPCs. Only the CPC training category “recurrent training” has a standard based in annual hours (two, 8-hour sessions per year). The “refresher training” category is based on the minimum number of required topics, not hours, and other types of CPC training are based on individual needs. Annual training plans differ across facilities because they are developed according to facility and individual needs (MITRE 2023).
Accommodating Other Duties During Slow Periods
The second difference between the two models’ approach to time on Other Duties is the percentage of Other Duties that should be incorporated into the availability factor. The CRWG model assumes that 100% of its total time on Other Duties should be subtracted from full-time hours in the availability factor calculation, while the AFN model only subtracts 64% of its total hours on Other Duties in its availability factor calculation. Because the AFN model’s regression method uses the 90th percentile traffic day, the AFN estimates that slower periods of days, weeks, or seasons
would provide enough free time for 72 of the 200 hours. This assumption leaves 128 hours of Other Duties in the availability factor calculation. Slow periods of days, weeks, or seasons are times when the demand for open positions is lower than typical.
One way to interpret the CRWG’s 100% is that the CRWG assumes that such slow periods will not be available to conduct any of these duties. Another way to interpret this decision is that the CRWG is asserting that time for all Other Duties should be set aside (i.e., subtracted from full-time hours during the availability factor calculation) to ensure that a facility has enough CPCs to guarantee that all Other Duties occur to their fullest extent. For facilities that are fully staffed, it is likely that there are some number of hours during current decreased traffic periods that could be productively used for Other Duties.
Because of the timekeeping data quality concerns especially related to Other Duties and Available Time, there was not a way to validate AFN’s assumption that slow periods of the day, week, or season can accommodate 72 hours of Other Duties per year. Ultimately, the facility staffing standard should be set at a level high enough so that required Other Duties can be accomplished without resorting to overtime, but not so high that “free” hours that could be used for Other Duties excessively exceed the total hours required for Other Duties.

SOURCE: Committee analysis of FAA data.
Average TOP over a year can give a ballpark indication of the number of “free” hours (i.e., hours not on position and not used for required break and meal periods). Across all controller certification levels in FY 2024, average TOP per 8-hour shift was 3.79 hours. Compared across facilities (see Figure 4-4), average TOP was 4.15 hours per controller and ranged from 2.98 to 5.08 hours. At most large facilities, measured by staffing standard greater than 75, the average TOP per controller was under 4 hours. Assuming the 8-hour shift and 1 hour for break and meal periods, this leaves roughly 2–3.5 hours per shift, depending on the facility, that could conceivably be used for some Other Duties.
Traffic Operations on Days Other Than the 90th Percentile Day
Both the AFN model and the CRWG model use the 90th percentile traffic operations day in setting their respective staffing targets; however, only the AFN model’s regression method depends on the 90th percentile day having sufficiently higher traffic than slower traffic days of the year to leave enough time for Other Duties. For example, under the regression method, two facilities could have the same 90th percentile day of traffic operations, but one facility’s traffic operations could be consistently high such that the staffing needed on their 50th percentile day is only one or two positions fewer than that on the 90th percentile day. The facility with the higher traffic on non-90th percentile days would have less time eligible for Other Duties. The regression method, on its own, has no way of detecting and adjusting for this discrepancy. The 5-hour TOP method, by providing a cap on average TOP per controller per day, does set an upper bound; however, as illustrated above there is still quite a bit of difference in “free” hours over a year between facilities whose controllers average closer to 5 hours on position per day and facilities whose controllers average around or below 4 hours.
One quick way to gauge the potential unequal impact of staffing to the 90th percentile day is to look at the AFN model’s staffing standards according to a facility’s total annual operations. If two facilities with the same staffing standard have roughly the same total number of operations, even if their daily TOP patterns are different throughout the year, then they should still have roughly the same total number of hours eligible for Other Duties. If the facility-level staffing standard is positively and highly correlated with total operations, then confidence goes up that staffing to the 90th percentile day is not having a highly unequal impact in terms of the amount of slow time across facilities. For 2024, the Pearson’s correlation coefficient between total operations and the AFN staffing standard is 0.97 (a Pearson’s correlation coefficient of 1 represents a perfect, positive correlation).
However, inspecting the scatterplot of the 313 ATC facilities by AFN staffing standard and total operations for 2024 (see Figure 4-5) reveals

SOURCE: Committee analysis of FAA data.
considerable variability in staffing standard versus total operations starting at staffing standards above 60. For example, the Anchorage Air Route Traffic Control Center (ARTCC) has a staffing standard of 92 and 596,686 annual operations, while the Miami Tower has a staffing standard of 98 and 1,590,249 annual operations. The Boston ARTCC with a staffing standard of 189 also has fewer annual operations (1,414,720) than the Miami Tower. Although the Anchorage ARTCC and the Miami Tower have similar 90th percentile days, the Miami Tower produces almost three times the total operations over a year, making it likely that CPCs at the Miami Tower have a lower number of slow periods for Other Duties. Similarly, the Boston ARTCC has a 90th percentile that is nearing twice as busy as the Miami Tower’s, yet the Miami Tower has more operations during a year. The Pearson’s correlation coefficient provides little insight, as the coefficient for facilities above 60 staffing standard is greater (0.93) than the coefficient for facilities below 60 staffing standard (0.89). (The facilities below 60 staffing standard include facilities whose staffing standard is based on the minimum watch standard.) There are likely good reasons why the Anchorage ARTCC, the Boston ARTCC, and the Miami Tower have their current
staffing standards; however, these examples illustrate that a one-size-fits-all model cannot accommodate all unique operating contexts.
To more rigorously examine the question of whether facilities face different consequences for staffing standards pegged to the 90th percentile traffic day, capped by the 5-hour TOP method, would require examining daily patterns of TOP across facilities. Although the committee only had access to total TOP per 2-week pay period, the illustrative examples described below indicate that there are indeed variations in patterns of TOP over a year that would likely affect the total number of hours available for Other Duties and the degree of flexibility within a year to schedule Other Duties. Ensuring that Other Duties occur is a managerial challenge that differs across facilities and may differ to such an extent that the AFN model’s current uniform approach to accommodating Other Duties across facilities is inappropriate.
Figures 4-6, 4-7, and 4-8 each illustrate the variation in TOP per year for a pair of facilities. Facility pairs were chosen to represent large Towers, TRACONs, and ARTCCs with similar staffing standards but different total annual operations. In the case of the ARTCCs, there are similar staffing standards, but the one with the higher staffing standard has fewer total

SOURCE: Committee analysis of FAA data.

SOURCE: Committee analysis of FAA data.

SOURCE: Committee analysis of FAA data.
operations. TOP is measured in hours per 2-week pay period and then divided by the facility’s AFN staffing standard. The pay periods are arranged in order of increasing TOP/SS over the course of the fiscal year. In general, facilities with steeper curves have more seasonal variation in TOP, which should provide them with more flexibility for scheduling Other Duties as well as certain types of leave. By dividing by the facility’s AFN staffing standard, these figures also show that facilities differ in the level of demand for TOP per unit of staffing standard.22
Figure 4-6 covers the Boston ARTCC (ZBW) and the Salt Lake City ARTCC (ZLC). The Boston ARTCC has a higher staffing standard (189) but lower annual operations (1,414,720) than the Salt Lake City ARTCC (175 and 1,510,012, respectively). The Boston ARTCC’s higher staffing standard reflects the greater intensity of TOP at certain times of the year, but the Boston ARTCC’s greater variation in demand for TOP over a year, from 29–39 hours per unit of staffing standard, means that its hours of slow periods related to the annual variation in TOP are relatively greater and more clustered than for Salt Lake City ARTCC. On the other hand, Salt Lake City ARTCC’s lower peak amounts of TOP per pay period may make it easier to conduct some types of Other Duties consistently throughout the year.
In Figure 4-7, the Minneapolis TRACON (M98) and the Las Vegas TRACON (L30) have the same staffing standard (44), despite quite different annual operations (448,949 and 683,518, respectively). The Minneapolis TRACON’s steeper TOP curve means its slow periods are more numerous and more clustered than at the Las Vegas TRACON. The flatter TOP curve for the Las Vegas TRACON, means it has less down time than the Minneapolis TRACON. However, the Las Vegas TRACON’s lower peak amounts of TOP per pay period may make it easier to conduct some types of Other Duties consistently throughout the year.
In Figure 4-8, the DFW and the Indianapolis Tower (IND) is another case with similar staffing standards (51 versus 49, respectively), but very different annual operations (719,581 versus 479,559, respectively). The flatter TOP curve for the DFW Tower means that it would have fewer slow periods during the year than the Indiana Tower. In addition, the consistently greater TOP per pay period for the DFW Tower, in comparison to the Indiana Tower, would leave less time at DFW throughout the year for Other Duties.
Thus, as these three pairs of examples show, the variations in the annual TOP pattern across facilities can mean that even facilities with similar
___________________
22This analysis assumes that the total number of TOP hours per pay period does not vary according to staffing level (i.e., whether the facility is staffed above or below its staffing standard).
staffing standards can have very different opportunities and challenges when it comes to scheduling the various types of Other Duties. Setting the staffing standard according to the 90th percentile traffic day or the annual average TOP used by the 5-hour TOP method does obscure variation among facilities.
Evidence That Training Is Not Adequately Occurring
The CPC-workforce’s primary obligation is to fulfill Time on Position requirements, which means that if choices during a day or week must be made between TOP and time on Other Duties, Other Duties have a lower priority. The most concerning type of skipped or rushed Other Duties is training. Information collected from representatives of ATO, former facility managers, and NATCA as well as during committee visits to ATC facilities indicate that skipped or rushed training has occurred at some facilities.23 If skipped or rushed training is systemic across facilities, this could indicate that the current number of hours assumed to be available during slow periods is not sufficient to conduct Other Duties.
COMPARISON BASED ON SCIENCE-BASED APPROACHES AND OTHER CHARACTERISTICS
The committee’s Statement of Task instructs that the report should inform “the Federal Aviation Administration’s (FAA’s) interest in developing objective, science-based approaches for setting future air traffic controller staffing targets to ensure the safe and efficient operation of the national airspace system.” The six criteria that follow are those chosen by the committee as foundational concepts for the development of “objective and science-based” approaches.
- Traceability—A sound model should have documentation that describes the associations and dependencies within the model. The documentation should describe the fundamental inputs required to have a confident outcome. The documentation should include how the model designers developed different input variables and should mathematically describe their impact on the model outcomes. The documentation should clearly define the model’s underlying assumptions, purpose, and intended use. Operational constraints that affect outcomes should be described. Performance measures to assess outcomes and validate the model should be described in
___________________
23Presentations to the committee, July 17–18 and October 9–10, 2024; NATCA. 2024. “Overview CRWG Staffing Model v. FAA Finance (AFN) Staffing Model,” January 24.
- detail in the documentation. Modifications to the model should be described and included in the documentation as addenda. Any reviewer and all key stakeholders should be able to understand and evaluate the current version of the model based on its documentation. The model’s limitations, assumptions, and the best measure that can be taken based on available information should be documented by the persons developing the model.
- Relevance—The extent to which the model addresses the important portions of the issues for which it is designed and, equally important, the extent to which it excludes extraneous or marginally relevant issues or data. Does the model capture all the important drivers? Does it operate at the right level of detail (NRC 2007)?
- Adaptability—The extent to which a model has the “ability to satisfy mission and requirement changes, with or without modifications” (SEBok 2024). Can the model be adapted to changing objectives for staffing requirements? Can the model be used to test the impact of changes to assumptions or other inputs?
- Validity—The extent to which the output of the model corresponds to the actual, real-world outcomes constitutes its validity, which in the ideal includes the direct comparison with observed outcome (criterion) measures when such measures are obtainable. Because the ultimate criterion (i.e., aviation safety) may not be directly measurable in any practical sense, the model’s predictive validity must be estimated against surrogate criterion measures (NRC 2007).
- Data Quality—The integrity of the data utilized in the model is a prerequisite to a successful outcome. Data inputs should address as many known factors as possible that impact staffing requirements.
- Data utilization should be weighted according to the factors’ impact on staffing. Historic data should be verified and validated, including using sensitivity analysis and validation—cause and effect of changes—and testing results using an independent data set.
- The data must be of the highest quality that is practical to obtain as well as its independent evaluation, often by individual surveys and measurements in the field.
- Survey data are typically used when there are insufficient data available. If utilized, it should be evaluated for use according to the veracity of the survey questions and the persons surveyed. Survey questions should be objective and clear. Extreme variability of survey responses from comparably qualified managers should be evaluated.
- Validation must be performed to verify that the data set is producing results that are credible and reflect actual needs.
- Ongoing Monitoring and Periodic Adjustment—This is critical for any sound model. Secondary metrics that are regularly updated and accessible should be available to check for early deviations or failures of the model.
The committee also developed a list of practicable attributes that are desirable for controller staffing target model.
- Anticipate traffic growth and changes in the nature of traffic to forecast the need for changes in the required number of controllers.
- Predict and accommodate the workload impact on staffing levels of changes in the nature of traffic demand (e.g., the effects of NextGen technologies on controller productivity and future demand for ATC services created by Advanced Air Mobility [AAM]).
- Fully account for the impact of Other Duties, such as training outside of OJT. Such training will remain critical for the next decade as the controller deficit is overcome.
- Estimate an overall workforce adequate to cover peak travel days and Other Duties such as training without excess staffing and idle time.
- Estimate staffing on traffic days other than the 90th percentile to give ATO flexibility in adjusting appropriate staffing levels if it chooses a different percentile to represent a peak day that facilities should be adequately staffed to cover.
- Account for the impact on staffing of longer rest periods between shifts, fatigue-friendly shifts, and overtime. The new fatigue rules are examples of changes in policy that can affect overall staffing. The models should be adaptable enough to analyze the impact of such policy changes and estimate how they would affect overall staffing at facilities and possible need to adjust targets and annual hiring goals.
In addition, the SOT contains the requirement to compare the model’s approaches to “the time needed to meet facility operational, statutory, and contractual requirements.”
Table 4-4 below summarizes the models according to the committee’s criteria and practical attributes, reflecting the chapter’s descriptions and analysis. The committee’s attempt to validate the models are described in Chapter 3.
| Criterion | AFN Model | CRWG Model |
|---|---|---|
| 1. Traceabilitya | The AFN model has no single document equivalent to the CRWG model’s MITRE (2023) report. Summarizing key aspects of the model required numerous communications with FAA. | The development and features of the CRWG model are well described in the MITRE (2023) report. |
| 2. Relevance | Estimates facility staffing targets based on traffic projections for future years, aligned with the CWP; estimates hours of position coverage as basis for controller staffing targets. | Estimates hours of position coverage as basis for staffing targets; designed to account for unique operating conditions. |
| 3. Adaptability | Addition of the 5-hour TOP method in 2017 illustrates ability to adapt to changing requirements. | Adaptations would typically require a redesigned survey and are limited to topics amenable to the experience and expertise of facility leadership. |
| 3.1 Forecasts facility operations and required number of controllers. | Yes. Both the regression method and the 5-hour TOP method integrate projections of future traffic. | Not currently. |
| 3.2 Accounts for changes in the nature of workload caused by new technologies. | Not without the necessary revisions to its task load submodels.b | No. |
| 3.3 Integrates orders, statutes, and contractual requirements. | Integrates within-shift work rules and minimum watch standards. | Integrates within-shift work rules; minimum watch standards; and statutes, orders, and CBA for time on Other Duties. |
| 3.4 Estimates adequate time on Other Duties. | Likely underestimates total time on Other Duties because it is based on historical timekeeping data (refer to data quality below). | Likely overestimates total time required for Other Duties. |
| 3.5 Preserves time to complete Other Duties without excessive idleness. | Availability factor calculation assigns some hours of Other Duties to slow periods. 5-hour TOP method preserves time on Other Duties. | Availability factor calculation assigns no Other Duties to slow periods, which could lead to excessive idleness at some facilities. |
| 3.6 Estimates staffing requirements for non-90th percentile days. | Yes. The model produces a daily staffing requirement for each day in the modeled year. | No. The current survey tool only requests information on the typical busy day. |
| Criterion | AFN Model | CRWG Model |
|---|---|---|
| 3.7 Estimates staffing impact of new fatigue-friendly policies covering the time between shifts. | No. Currently only models individual 24-hour periods and does not have the capability to model or track individual workers over multiple days or weeks. | No. Currently only models one specific 24-hour period. Facility leadership may have insights on how to schedule fatigue-friendly policies, but this would require a different survey. |
| 4. Validity | Not possible for the committee to determine with data available to it, as described in Chapter 3. | |
| 5. Data quality | Historical timekeeping records used to develop the availability factor are acknowledged to be incomplete and inaccurate. | The quality of survey responses was checked for errors or misunderstanding and validated against historical data. However, data reliability was not tested by asking facilities to complete the same survey at a different point in time and comparing the results. |
| Workload requirements models for Towers, TRACONs, and Centers are aging, and their outputs may not reflect current conditions. | ||
| 6. Ongoing Monitoring and Periodic Adjustment | An update was made to the availability factor in 2023. The workload requirements models have not been updated in many years. | The CRWG process is in its third iteration since 2016, and it has been made more rigorous and traceable over time. |
a Although traceability is sufficient for the committee’s evaluation of policy, the traceability is not thorough enough in either case for another modeler to step in and replicate the results.
b This text was revised after release of the report to more accurately reflect how the AFN model could be adapted for this purpose.
FINDINGS, CONCLUSIONS, AND RECOMMENDATIONS
Finding 4-1: Both models have strengths and weaknesses. The AFN model has capabilities missing from the CRWG model, namely, to convert daily traffic into daily traffic operations and daily staffing requirements for 365 days per year and to forecast future staffing standards targets based on traffic projections. This latter capacity allows the AFN model to help produce the staffing targets needed for setting hiring goals to close the estimated staffing gaps at facilities by having sufficient trainees in the pipeline to replace CPCs who retire or otherwise leave the workforce. In addition, the AFN model has proven itself adaptable as evidenced by the addition of the 5-hour TOP position method in 2017.
However, the AFN model does not sufficiently take into account the unique operating conditions at particular local facilities. The CRWG survey of facility managers provides a method to consider these local facility requirements.
The AFN model’s potentially outdated workload requirements models and the incomplete and inadequate timekeeping data used to calculate its availability factor are also weaknesses. The CRWG model’s attempt to compensate for the incomplete and inaccurate timekeeping data by drawing on hours for Other Duties as described in statutes, FAA orders, and CBAs has not been validated.
Conclusion 4-1: The AFN staffing standards target modeling process provides an adequate baseline estimate that can be adjusted, where needed, using input from the CRWG survey method or a similar approach. The AFN model’s ability to project future staffing needs through quantifiable historical metrics enables strategic long-range planning critical for the multiyear CPC training pipeline—an advantage that addresses future requirements rather than just current operational demands.
Conclusion 4-2: The AFN model’s workload requirements models are at risk of being out of date. All models used for operational purposes require periodic review and updating. The AFN model’s workload requirements models have not been evaluated and updated in 10 or more years, despite introductions of changes in traffic flow management that may have influenced productivity. Although updating requires management and budget prioritization, workload requirements models used to estimate facility staffing targets need to be periodically evaluated for continued relevance and updated on an ongoing basis.
Recommendation 4-1: FAA should examine its workload requirements models and arrange for any necessary updates; FAA should establish a system to periodically evaluate the need for future updates to these models.
Conclusion 4-3: SUI is critical to setting appropriate facility-level staffing standards. The AFN staffing standards target modeling process will be unable to account for all the unique operational aspects of individual facilities, including variation across facilities in adverse weather patterns that can create demand for additional staffing at facilities prone to such patterns. The opportunity for input from facility managers is a necessary component of setting facility-level staffing targets. However, ad hoc approaches to SUI can lead to inconsistent and idiosyncratic results. A structured process for SUI can ensure that the staffing standards process incorporates SUI in an accurate and uniform manner. The CRWG model’s survey method is an example of a structured input method.
Recommendation 4-2: FAA should retain the structure of, and methods embedded in, the AFN modeling process for establishing the baseline staffing standards target.
Recommendation 4-3: FAA should develop a structured survey method for SUI. After a local facility receives the AFN staffing standard model results, if it believes there are local factors that need additional consideration, there should be a process for them to request a survey that provides structured input in a collaborative decision-making process. A refinement of the CRWG survey could provide the basis for such a survey.
Conclusion 4-4: An accurate number of the total hours required for Other Duties is unknown. A significant driver of the difference between the AFN and CRWG models’ estimated facility staffing targets is attributable to the different methods that the models use to estimate the total hours required for Other Duties. AFN’s estimate of 200 hours for the total required hours of Other Duties per CPC per year is likely an underestimate of the time currently spent on Other Duties and the time that should be spent on Other Duties, while CRWG’s estimate of 336 hours for Other Duties is most likely an overestimate of the total hours required for Other Duties.
Conclusion 4-5: Some number of Other Duties hours can be conducted during slow periods. CRWG’s assertion that all hours of Other Duties (the CRWG’s 336 hours) should be set aside in the availability factor calculation, which assumes that zero hours of Other Duties can occur during slow periods, will likely lead to decreased productivity during slow periods of the day, week, or season. Although there is some number of Other Duties hours that can be assumed to occur during slow periods, there was not enough information available to the committee to determine the validity of the AFN’s assumption that 72 hours of Other Duties occur during slow periods.
Conclusion 4-6: A facility’s ability to schedule and support the completion of Other Duties may be affected by its annual traffic patterns. The AFN model’s use of the 90th percentile traffic operations day as the basis for its staffing standard, even though capped by the 5-hour TOP method, obscures differences across facilities in annual traffic patterns. Facilities vary in the availability and amount of concentrated down times during a year that can be used for scheduling Other Duties and certain types of leave. This variation could result in some facilities having a greater challenge when it comes to scheduling and completing Other Duties.
Recommendation 4-4: FAA should examine the total hours required for Other Duties and, for each facility, the actual time available for Other Duties over 365 days of operations and adjust facility staffing standards if required. FAA should also explore developing a model component for the AFN facility staffing standards model that estimates the required time for Other Duties for each facility, accounting for the facility’s typical distribution of controller types and their training needs and the variation in daily operations across a 365-day period.
REFERENCES
NRC (National Research Council). 2007. Staffing Standards for Aviation Safety Inspectors. The National Academies Press. https://doi.org/10.17226/11742, 33.
NRC. 2014. The Federal Aviation Administration’s Approach for Determining Future Air Traffic Controller Staffing Needs, TRB Special Report 314. The National Academies Press. https://doi.org/10.17226/18824.
MITRE. 2023. “Collaborative Resource Workgroup Certified Professional Controller Targets: Methodology,” November. The MITRE Corporation.
SEBok. 2024. “System Adaptability.” SEBoK: Guide to the Systems Engineering Body of Knowledge, November 25. https://sebokwiki.org/wiki/System_Adaptability.
This page intentionally left blank.


