The Air Traffic Controller Workforce Imperative: Staffing Models and Their Implementation to Ensure Safe and Efficient Airspace Operations (2025)
Chapter: 2 Overall Air Traffic Control and Facility Staffing for Fiscal Year 20102024
2
Overall Air Traffic Control and Facility Staffing for Fiscal Year 2010–2024
This chapter primarily addresses the Statement of Task item that asks the committee to “examine the array of factors that contribute to current staffing levels” and “consider how FAA [Federal Aviation Administration] controller hiring and training plans and their execution affect current controller staffing levels.” The chapter provides background information about FAA’s air traffic control (ATC) workforce since 2010 and the different ATC facilities in which they work, the facility controller staffing levels over time, and the distribution of staffing across facilities. The role of the ATC workforce in meeting the imperative of safety while also striving for an efficient National Airspace System (NAS) is discussed first before reviewing types of ATC facilities, the main tasks controllers perform when working in them, and the size of the controller workforce and its distribution across facility types. A deeper and more detailed review of safety-related matters is provided in Chapter 3.
The subsequent sections then address the main concern for this chapter: how and why staffing levels declined in general over the 15 years from Fiscal Year (FY) 2010–2024. This is followed by an explanation of the distribution of staffing across facilities, as some were affected much more than others. As will be explained, some facilities experienced sharper and most sustained staffing declines than others, and some of them are major facilities having an outsized role in serving commercial aviation demand. There is reason to believe the staffing declines at these facilities contributed disproportionately to increases in flight delays experienced across the NAS during 2022 through 2024 as air traffic operations rebounded from the COVID-19 pandemic.
The penultimate section identifies findings and recommendations from the National Academies of Sciences, Engineering, and Medicine (NASEM) 2014 report that apply to the annual FAA Controller Workforce Plans (CWPs) relied on heavily in this chapter. The chapter concludes with a summary of key points from the chapter discussion that, in turn, support a series of related findings and recommendations.
THE SAFETY IMPERATIVE
FAA states that its mission is “to provide the safest, most efficient aerospace system in the world.” FAA’s Air Traffic Organization (ATO) and its workforce are responsible for the ATC dimension of these goals. The primary role of the ATC workforce is ensuring the safe separation of aircraft when airborne and when on airport runways and taxiways to minimize the risk of collision. The safe levels of separation of airborne aircraft in the NAS and on the ground at airports are set by regulation and operating practices of ATO. ATO also provides other services to pilots that have safety purposes, such as weather and traffic advisories.
The safety of commercial aviation in the United States has improved dramatically over the past several decades due primarily to advances in aircraft design; aircraft accident-avoidance technologies; pilot experience, skill, and training; commercial operating practices and safety culture; and ATC. Over the past six decades the probability of a fatal commercial accident has fallen 40-fold (NASEM 2021) to an unprecedented level of safety in the history of commercial aviation and the best in the world. Trends in fatal accidents among large passenger and cargo operators are shown in Figure 2-1. Air traffic control is only one of the contributors to achieving this remarkable level of safety, but this contribution is essential.
Between 2010 and 2022, fatal accidents in general aviation (not included in Figure 2-1) have ranged between 203 and 271, with no apparent secular trend.1 The number of individuals killed annually in these accidents has ranged between 329 and 458. However, fatal crashes per 100,000 estimated flight hours have declined from 2.11 in FY 2010 to 1.5 in FY 2020, indicating a considerable decline in general aviation fatal accident risk.2
Maintaining the high levels of safety achieved in aviation requires constant vigilance in sustaining the multiple levels of defense against the hazards that can lead to fatal accidents. Potential erosion of the barriers to accidents provided by ATC is discussed in the next chapter.
Whereas safety is ATO’s foremost goal, ATO also strives for NAS
___________________
1Bureau of Transportation Statistics, https://www.bts.gov/content/us-general-aviationa-safety-data, as of December 30, 2024.
2Ibid.

SOURCE: Bureau of Transportation Statistics, Table 2-9: U.S. Air Carrier Safety Data, National Transportation Statistics, https://www.bts.gov/content/us-air-carriersafety-data. Data for carriers operating under 14 CFR Part 121, passenger and cargo.
efficiency by ensuring enough staff are available to provide ATC services that satisfy, in an orderly and reliable manner, the varied demands of the system’s many commercial (including space-related), military, and general aviation users. In prioritizing safety, however, ATO will impose constraints on flights, including delaying airline departures and arrivals, when not enough qualified controllers are available at individual facilities to meet peak demand.
ATC FACILITIES AND CONTROLLER TASKS AND TRAINING
ATC tower and approach control services operated by FAA are located at or near about 290 of the nation’s more than 5,000 public use airports, and the radar and satellite-based systems at these facilities can serve even more airports. In addition, a much smaller number of Air Route Traffic Control Centers (ARTCCs) that cover large geographic regions serve aircraft during the high-altitude en route segment of a flight. This section provides background information about these different ATC facilities, the types of tasks that controllers carry out when working in them, the qualifications that these controllers must meet to become fully certified, and the kinds of training necessary to meet these qualifications.
It merits noting that ATC services are also provided at 265 Contract Towers by approximately 1,400 contracted staff. These facilities, which serve small airports, are supported by FAA and state and local
governments.3 However, because Contract Towers are not operated by FAA controllers, they are not treated in this report.
Types of ATC Facilities
Most of the 313 FAA-staffed ATC facilities provide either terminal or en route flight services. There are three types of terminal-serving facilities: Tower (142 facilities), Approach Control (25 facilities), and dual-function Tower and Approach Control (121 facilities) also referred to as “Up/Downs” because the tower facilities are on top of the building and the radar facilities for approach control are on the bottom.4 There are 21 ARTCCs, which are also called En Route Centers, or Centers, that serve aircraft at higher cruising altitudes. Four ATC facilities—Combined Control Facilities (CCFs)—have the capability to provide both terminal and en route services. Two of these facilities (in Guam and Puerto Rico) are classified at times as Centers by FAA but in this report are classified as CCFs because they provide multiple services.
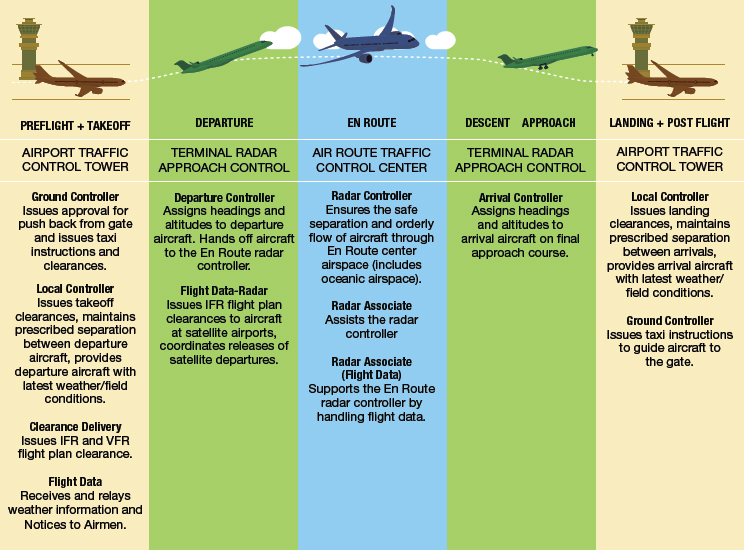
Terminal facilities serve aircraft in the vicinity of airports that are operating under Instrument Flight Rules (IFR) and Visual Flight Rules (VFR). As described in Figure 2-2, ATC staff in Tower facilities are responsible for preflight/takeoff and landing/postflight traffic activity. They use satellite, radar, and visual observations to provide traffic advisories, spacing sequencing, and separation services. ATC staff in Approach Control facilities are responsible for the ascent and descent phases of departures and arrivals. They assign headings and altitudes to arriving and departing aircraft while also providing other separation services to aircraft transiting airspace under their control. Standalone Approach Control facilities are also called TRACON facilities, an acronym for “Terminal Radar Approach Control.” ATC staff in dual-function Tower and Approach Control facilities provide both types of services in what is considered a single facility.
TRACON facilities typically serve large metropolitan areas and provide consolidated approach control services to multiple airports. For example, the Potomac Consolidated TRACON, located in Warrenton, Virginia, serves airports in the Baltimore-Washington and Richmond-Charlottesville areas, including Joint Base Andrews.5 The Seattle TRACON, located in Burien, Washington, covers 4,800 square miles of airspace and encompasses 52
___________________
3See https://www.faa.gov/about/office_org/headquarters_offices/ato/service_units/mission_support/faa_contract_tower_program.
4For complete lists of ATC facilities, refer to “ATC Facilities,” 123ATC.com. See https://123atc.com/facilities.
5“Potomac Consolidated TRACON (PCT),” FAA, updated January 12, 2023, https://www.faa.gov/about/office_org/headquarters_offices/ato/service_units/air_traffic_services/tracon/pct.
SOURCE: FAA. “The Air Traffic Controller Workforce Plan, 2024–2033.” May 2024.
towered, nontowered, military, and satellite/private airports including general aviation airports that host Boeing operations.6
Airports with approach control provided by TRACON facilities only need tower services on site. Outside of the regions served by TRACON facilities, airports requiring approach control services will have dual-function facilities. To illustrate, Chicago-O’Hare and Chicago-Midway airports are Tower-only ATC facilities, because they are served by the Chicago TRACON, located in Elgin, Illinois. Ninety miles north of Chicago, the Milwaukee Mitchell International Airport has an ATC Tower combined with Approach Control.
En Route Centers are designed to primarily serve aircraft with IFR flight plans during the en route segment of a trip, including inbound and outbound international flights. Using mostly radar, they provide for the separation and orderly flow of aircraft through large areas of airspace. The 21 En Route Centers are spread widely to cover the land area of the entire
___________________
6“Seattle TRACON (S46),” FAA, updated August 25, 2020, https://www.faa.gov/about/office_org/headquarters_offices/ato/service_units/air_traffic_services/tracon/s46.
continental United States and Alaska as well as some Atlantic and Pacific oceanic airspace.
Finally, the four CCFs provide both terminal services and en route services for large areas of airspace. They are the ATC facilities in Honolulu; Guam; San Juan, Puerto Rico; and the Joshua Control Facility located on Edwards Air Force Base in California.
FAA also assigns its ATC facilities a “Level” on a scale of 4 to 12 based on increasing traffic volume and complexity. Tower facilities without approach control span the entire range of Levels. For example, the Beaumont Tower in Texas and the Flint Tower in Michigan are Level 4 facilities, while the Atlanta, Denver, Dallas-Fort Worth, and Chicago-O’Hare Towers are Level 12. Towers with approach control span Levels 5 through 12. The 25 TRACONs span Levels 8 through 12; Level 12s are the most numerous within this group with 9 TRACONs. The 21 En Route Centers are all Levels 10 through 12; Level 12s are again the most numerous, totaling 9 En Route Centers.7 Facility Levels represent different work environments that become increasingly challenging to master as the Level increases. FAA takes these Levels into account when issuing initial job assignments.
The staffing at individual facilities estimated as Full-Time Equivalent (FTE) controllers varies considerably by facility type (see Table 2-1).8 En Route Centers and TRACONS, which total 46 facilities, represent 15% of all facilities but 55% of all ATC facility controller staffing, the significance of which becomes apparent later in this chapter. (Table 2-1 shows
TABLE 2-1 Staffing of FTE Controllers by Facility Type, FY 2024
| En Route Centers | TRACONS | Combination Control Facilities | Towers | Towers and Approach Control | Total | |
|---|---|---|---|---|---|---|
| Facilities | 21 | 25 | 4 | 142 | 121 | 313 |
| FTEs | 5,602 | 1,803 | 186 | 2,559 | 3,318 | 13,469 |
| Average FTEs | 267 | 72 | 47 | 18 | 27 | 43 |
| Percent FTEs | 41.6 | 13.4 | 1.4 | 19.0 | 24.6 | 100 |
SOURCE: Estimates generated by the committee from data provided by FAA.
___________________
7Facility Levels are available at “ATC Facilities,” 123ATC.com. See https://123atc.com/facilities.
8Note that the size of the workforce in this report is expressed as FTEs calculated as the average of the onboard controllers at a facility over the course of the year. This number will not correspond exactly to the headcount at the end of the Fiscal Year that FAA provides in its annual Controller Workforce Plans.
21 Centers, whereas Appendix C shows 23; this is because for this report two of these facilities serve as CCFs outside of the continental United States and differ considerably in scale and function from other Centers.) With the exception of seven smaller TRACONS, Centers and other TRACONS are all Level 10–12 facilities responsible for managing the most complex and demanding airspace and therefore require controllers with the highest levels of skill. The standalone Towers at 142 airports have the smallest average staffing (18), because most of them serve smaller airports that mostly serve general aviation. Standalone Towers and Towers and Approach Control combined facilities have the widest variation in Levels—26 of them (10%) are rated as Level 10–12 facilities and therefore also require controllers of the highest skill levels for these tasks. Thus, discussions of controllers and facilities in the aggregate mask wide differences in the sizes of the facilities, the staffing levels they have, and the skills required to staff them.
Controller Eligibility, Education, and Training
Eligibility requirements to become a controller include being a U.S. citizen, meeting minimum education and/or work requirements, and being younger than 31 years old. The age limit allows a controller to work for 25 years before reaching the mandatory retirement age of 56. The application process, which may take 6 months or longer, includes receiving a competitive score on the Air Traffic Skills Assessment, passing medical and psychological examinations, and receiving a security clearance.9 Because of the need for intensive classroom training, limits on instructors, and available space at the FAA Academy in Oklahoma City, FAA offers only a limited number of application windows per year. However, hires with sufficient controller experience, such as through the military, are placed in individual facilities to begin their retraining.
The alternative paths for meeting the education and work eligibility requirements affect the content and length of initial training provided by the Academy. The minimum eligibility requirement is 4 years of education leading to a bachelor’s degree or 1 year of general work experience or some combination of postsecondary education and work. Applicants typically have at least an associate’s degree, but it is not a requirement; a high school degree and 1 year of work experience suffices. New hires who have successfully completed the required coursework at an institution participating in FAA’s Air Traffic-Collegiate Training Initiative (AT-CTI) Program are
___________________
9“Be ATC - FAA Hiring Air Traffic Controllers,” FAA, updated November 5, 2024, https://www.faa.gov/be-atc. See also Bureau of Labor Statistics, “Air Traffic Controllers,” Occupational Outlook Handbook, modified August 29, 2024, https://www.bls.gov/ooh/transportation-and-material-moving/air-traffic-controllers.htm#tab-1.
eligible to skip the first weeks of basic training provided by the Academy. Enhanced AT-CTI (E-CTI) degrees, currently offered by five postsecondary institutions (at the time of this writing in early 2025), allow a new hire to bypass the Academy and be placed in On-the-Job Training (OJT) at an ATC facility.10 At the time of this writing in May 2025, several other schools were applying to be approved as E-CTI schools.
The Academy’s classroom training takes roughly 3–5 months, depending on the new hire’s facility Track; that is, whether assigned to become a controller in a Center or Terminal. Controllers at ATC facilities are in one of four categories indicating training status and capabilities: Academy Graduate (AG), Developmental Controller (DEV), Certified Professional Controller (CPC), and CPC-In Training (CPC-IT). New hires coming through the Academy begin OJT training at facilities as AGs. As trainees certify in a progression of skills, they rise through the DEV sequence specific to their facility (e.g., D1, D2, and D3). Once certified in all positions at their facility (explained next), they become a CPC. However, if a CPC transfers to another ATC facility, they must become recertified at that facility. Until this occurs, they are a CPC-IT.
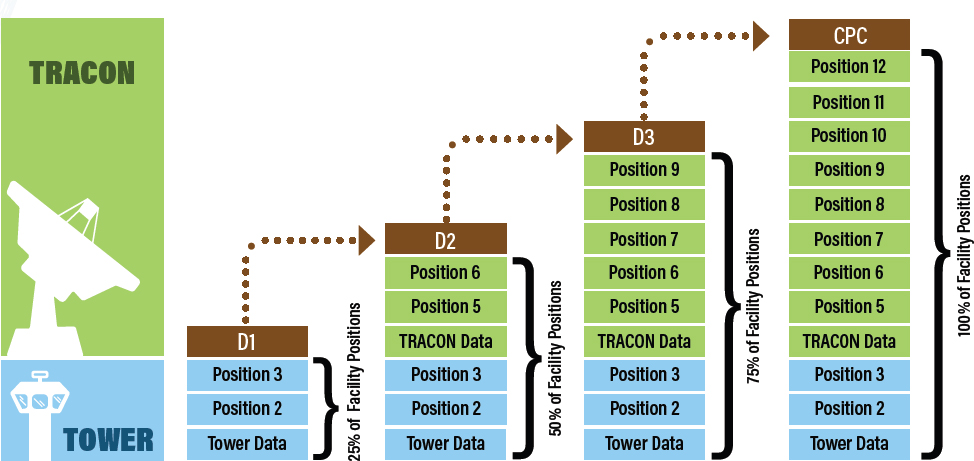
Controller tasks are grouped into “positions” that define the training sequence, and as explained below, form the staffing building blocks foundational to managing traffic. As depicted in Figure 2-3 for an illustrative large Tower with Approach Control facility, a new AG in this example must be “checked out” in 12 positions before achieving CPC status. A new AG first trains for certification in tower responsibilities, starting with flight data. Once checked out in all tower positions, they are a D1 and certified to work without supervision in all tower responsibilities (clearance delivery, ground control, and local control as described in Figure 2-3). OJT continues with nine sequential positions related to approach control (flight data, departure controller, and arrival controller as described in Figure 2-3). Although practices vary across facilities, in general, once checked out in all the positions grouped in D2, the controller achieves D2 status and can staff these positions independently. The process repeats with position 7–9 to achieve D3 status and, finally, positions 10–12 to achieve CPC status.
The time required to achieve CPC status depends on the facility type and Level. Because a DEV can contribute to an ATC facility’s productivity by working checked-out positions, there is a risk that an understaffed facility will need these DEVs to work positions they are certified for and be unable to progress to CPC status in timely manner due to lack of time for training. To guard against this, FAA also sets goals for time to gain CPC status and monitors progress closely as explained in Chapter 6. FAA’s goal for
___________________
10“Collegiate Training Initiative (CTI) Schools,” FAA, updated November 26, 2024, https://www.faa.gov/jobs/students/schools.
SOURCE: FAA. 2024. “The Air Traffic Controller Workforce Plan, 2024–2033,” May.
time-to-CPC status for terminal-serving facilities (Tower, Tower with Approach Control, or stand-alone TRACON) assigned Levels 4–6 is 1.5 years, Levels 7–9 is 2 years, and Levels 10–12 is 2.5 years. For En Route Centers, the goal for time-to-CPC status is 3 years (FAA 2024, 49). Actual training progression times calculated by the committee are provided in Chapter 6.
Controller Tasks and Workflow
Facilities typically operate with a prescribed number of positions (as agreed upon in the Collective Bargaining Agreement). The 12 positions described in the Figure 2-3 example are types of positions, not the total number of positions. Positions are opened and closed during a day, as necessary to meet traffic demands at the ATC facility. The controller assigned to work an open position is “on position.” Because managing traffic is the most demanding aspect of controllers’ jobs, average time spent on position is limited to 5 hours on an 8-hour shift, and usually no more than 2 consecutive hours on position, with mandatory rest and recovery periods after each segment on position. Depending on ATC facility traffic, multiple controllers may be “on position” for a single type of position or a single controller may be responsible for multiple positions. The primary function of controllers on position is safety. Workload permitting, CPCs on position may also provide OJT, manage traffic flow, and provide radar services to VFR flights (NRC 2014). The number of positions a facility needs to have open to serve traffic on one of its busiest days is a critical input to the facility staffing models used by both FAA’s Office of Finance and Management (AFN) and the Collaborative Resource Working Group (CRWG). Controllers are expected to work full time on shifts that rotate through the workweek, plus overtime, as necessary to keep facilities functioning up to 24 hours per day, 365 days per year. Controllers do not typically work part time, nor are they assigned half shifts or split shifts.
Tasks that are not part of any assigned position are done during a shift when a controller is off position. These tasks are referred to as “Other Duties,” and their significance is explained in Chapter 4. Such tasks include receiving their own mandatory, recurrent, or additional training; participating in work efforts related to quality assurance and control; and other activities typical for any employment situation.
REASONS FOR CURRENT STAFFING LEVELS
After a brief overview of FAA’s long-term hiring strategies and plans, this section provides background and summarizes the impacts of each of the following occurrences and events that constrained FAA’s hiring of controllers after FY 2012:
- Sequestration and Government Shutdown of 2013
- Administrative Missteps in 2014–2015
- FAA Extension, Safety, and Security Act (FESSA) of 2016
- Government Shutdown of 2019
- COVID-19, 2020–2022
- Constrained Hiring Plan of 2023
FAA Hiring Strategies and Long-Term Hiring Plans
As FAA stresses in each of its annual CWPs, its hiring plans are based on forecasted traffic over a moving 10-year period, the attrition that the workforce will experience, and a 2–3-year period of training required for those newly hired to replace or augment controllers who retire or otherwise leave the workforce (see Figure 2-4).
As can be seen in the figure, peak traffic operations occurred in FY 2000 and then declined fairly sharply until FY 2010, after which it more or less leveled out until FY 2019 before traffic plummeted during the COVID-19 pandemic. After FY 2003, the headcount of CPCs and CPC-ITs at facilities began to decline until roughly FY 2008 when FAA began hiring in anticipation of a wave of expected retirements (not shown) that occurred between FY 2013–2017 (FAA 2024, Figure 4.1). The number of CPCs plus CPC-ITs peaked again in FY 2012–2013, after which the number and its annual growth drifted downward to match changes in traffic by FY 2019. Forecast hiring made in the FY 2024 CWP for FY 2024–2033 indicated FAA’s plans to grow the workforce and the number of CPCs and CPC-ITs to match forecast growth in air traffic operations.
Not all of the adjustments in hiring and changes in the workforce after 2010 resulted from a deliberate plan. As described in the next sections, FAA experienced several constraints on hiring during the FY 2013–2023 period, most of which were externally imposed. During the period of hiring constraints, the number of CPCs declined steadily between FY 2013 to 2020 then recovered slightly and leveled off after 2021 but nevertheless declined 10% during the FY 2013–2023 period.
Sequestration and Government Shutdown of FY 2013
Reductions in federal spending within a FY despite appropriations made by Congress are referred to as sequestration, which occurred during FY 2013 (GAO 2014).11 It was triggered by the Budget Control Act (BCA) of 2011. When a special bipartisan congressional committee was unable to reach a
___________________
11This reference is relied upon heavily in the following description of the impacts of sequestration and the government shutdown.

SOURCE: FAA. 2024. The Air Traffic Controller Workforce Plan FY 2024–2033.
compromise on a long-term deficit reduction plan, President Obama was obligated by the BCA to order the termination of roughly $85 billion in planned spending of appropriated funds after the FY had already begun, evenly balanced between military and domestic programs. On the domestic side of the budget, these mandated cuts were distributed across discretionary programs, but did not include Social Security, Medicare, Medicaid, and the portions of FAA’s budget that is funded by trust funds.12 FAA met its share of reduced spending by enacting a temporary hiring freeze affecting air traffic controllers that extended to the first 3 months of FY 2014, termination of some temporary employees, and reduced travel. Furloughs of FAA employees (working 1 day less per pay period), including air traffic controllers were implemented in April 2013, and flight delays ensued in multiple metropolitan areas. Shortly afterward, Congress allowed FAA to make a onetime transfer from the Airport Improvement Program of the aviation trust fund of $253 million to cover labor expenses. Hiring in FY 2013 and 2014 of 1,666 was below the hiring goal that FAA had set in advance by 935 staff but was 1,714 hires below the unconstrained hires needed as estimated by AFN’s models.
FAA Administrative Missteps
As early as 2007 and through 2013, FAA engaged in internal processes to review issues with both equal opportunities in its hiring process and process improvements to expedite hiring (OIG 2017).13 In December 2013, FAA announced a set of new policies and activities to improve equal opportunities and the overall administrative process. In addition to these new approaches, FAA centralized the hiring process into a single office. Partly in response to the hiring constraints imposed because of the 2013 sequestration, FAA hurriedly announced a new set of policies and activities to improve equal opportunities and the overall administrative hiring process.
The announcement of the new policies was met with disappointment by some stakeholders. The role of the College Training Initiative (CTI) program was reduced due to FAA’s dropping of specific hiring announcements to CTI graduates. The process was initiated the month following the announcement, catching the CTI schools unprepared. In addition, rather than continuing to process 2,000 existing applicants, FAA instituted the new nationwide vacancy announcement in early 2014 and required everyone who had already taken and passed the screening test to reapply.
In 2014, delays in the hiring process associated with the intended hiring surge after the 2013 sequestration and shutdown resulted in only 10% of
___________________
12See Chapter 8 for an explanation of FAA’s sources of funding.
13The descriptions of hiring problems in this section draw heavily from this reference.
the hiring class beginning classes at the Academy within 7 months of the vacancy announcement. Multiple classes were cancelled because seats at the Academy could not be filled. Some individuals were not processed through medical and security clearances for 1–2 years. In 2015, FAA implemented further process improvements in the applicant screening process. In 2014 and 2015, FAA fell short of its hiring goals by 174 and 427 hires, respectively, but fell behind modeled estimates of needed hires by 950 and 472, respectively.14
The FAA Extension, Safety, and Security Act (FESSA) of 2016
FESSA legislation enacted in 2016 had a section intended to prioritize the hiring of individuals with previous experience as controllers, either in the military or with FAA, but it had unintended adverse effects.
As described in the 2018 CWP (FAA 2018):
In FY 2016, Public Law 114-190—FAA Extension, Safety, and Security Act (FESSA) of 2016 was enacted. The law established three separate hiring pools. FESSA requires that the first pool, which included individuals with previous air traffic control experience, be given priority consideration. Over 1,400 applicants responded to the air traffic control experience vacancy announcement in May 2017. Over 900 were referred for employment consideration.
FESSA establishes a separate track that was then divided into two pools. The first pool includes graduates from Collegiate Training Initiative (CTI) programs and also military veterans. The second pool is open to the general public. FESSA mandates that there be no more than a 10 percent variance between those two pools in making final selections. Out of 1,100 applicants referred for employment consideration from the CTI/Veteran pool, approximately 611 were selected. Out of 1,500 applicants referred for employment consideration from the general public pool, approximately 656 were selected.
The 2019 CWP (FAA 2019) explains the impact FESSA had on potential hires:
The FESSA law required that the selection of candidates from these pools be balanced within 10 percent of each other. In FY 2018 and particularly in FY 2019, the limited size of Pool 1 candidates prevented the FAA from selecting a substantial number of otherwise well-qualified candidates from Pool 2.
___________________
14This sentence was revised after release of the report to reflect the most current hiring data from FAA.
FESSA was subsequently replaced in legislation that dropped the requirements for balanced hiring from pools of employees. The constraints imposed by FESSA may be somewhat overstated by FAA in its CWPs because in FY 2017 and 2018, actual hiring in those 2 years was 1,880 and 1,787, respectively, which were close to annual Academy throughput capacity (1,800) at the time. Actual hiring in FY 2017 and 2018 was slightly ahead of modeled hires in those 2 years (77 and 86, respectively).
Government Shutdown of 2018–2019
The 35-day government shutdown in December 2018 through January 2019 was the longest federal government shutdown in history. Without an appropriation in place, nine agencies shut down and were unable to operate. More than 800,000 federal employees were furloughed or required to work without pay, including air traffic controllers (employees were ultimately paid). In the midst of the impasse before a resolution was found, FAA lowered its FY 2019 hiring goal by about 1,100 hires (the number FAA was able to hire was also affected by FESSA). FAA set a goal of hiring 907 employees and hired 1,010. However, the actual hires were 421 below modeled estimates of unconstrained hiring.
COVID-19 (2020–2022)
In response to the COVID-19 pandemic, certain ATC activities were curtailed or substantially reduced to minimize staff required to be on site (traffic had also plummeted beginning in March 2020) (FAA 2021, 4). FAA officials explained to the committee that some trainers (former CPCs working as contractors) at the Academy were let go to fit the reduced planned hiring in FY 2020 and 2021. Some of these Academy trainers, who are mostly part time and tend to live permanently elsewhere than in Oklahoma City, returned home. The Academy itself shut down for 4 months in March through June of FY 2020, and class sizes were reduced by as much as 50% for social distancing when training resumed (OIG 2023). As COVID-19 peaked, FAA paused training at facilities for up to 2 years, during which OJT of trainees by CPCs was substantially reduced and their progression therefore delayed. The hiring goals for FY 2020 and 2021 were set for about 900, but the 2021 hiring goal was subsequently dropped to 500. The hiring goal was raised to 1,020 in FY 2022, which was below normal Academy throughput capacity because ATO needed extra time to reassemble formerly contracted staff or trainers who had been dismissed during the pandemic. Actual hires in FY 2020–2022 were slightly over the hiring goals each year. However, they were short of modeled unconstrained hires by 579 in FY 2020, 681 in FY 2021, and 673 in FY 2022.
Constrained Hiring Goal of 2023
The delayed training of DEVs and CPC-ITs during the pandemic affected the hiring goal set by ATO for 2023, as FAA anticipated that the demand on CPCs in facilities to provide OJT for a backlog of trainees built up during the pandemic would strain staff at facilities that had experienced significant attrition in CPCs. The hiring goal was set at 1,500, less than the Academy throughput rate and insufficient to make up for net losses of previous years. Actual hiring (1,512) slightly exceeded this number. However, actual hiring was 1,511 below modeled estimates of needed hiring. FAA would have been unable to actually hire the unconstrained estimate of 3,043 hires for FY 2023 because it would far exceed the training capacity of the Academy and individual facilities. As explained in the next section, whenever its modeled estimates and hiring goals exceed training capacity, FAA plans for 2–3-year surges in hiring to reduce peak hiring and training to a manageable level.
Summary
Over the FY 2013–2023 period of hiring constraints, FAA hiring fell short of modeled estimates of what hiring should have been in all but 2 years (FY 2017–2018) (see Figure 2-5). By the end of FY 2023, the ATC workforce totaled 13,448 compared with 15,211 at the beginning of FY 2013, a

SOURCE: Generated by the committee with data provided by FAA.
___________________
15This figure was revised after release of the report based on updated numbers of unconstrained hires provided by FAA.
decline of 11% overall, and a decline of 1,160 (10%) in CPCs.16 The next section reviews how ATO responded to the hiring constraints in its long-range hiring plans of FYs 2013–2023.
Plans to Address Hiring Constraints
Annually, proceeding the President’s budget submission to Congress, FAA publishes a CWP that forecasts over a 10-year period:
- future demand for controllers based on anticipated traffic at each facility;
- future attrition at each facility due to retirements, promotions, and other losses; and
- future hires needed in the future at each facility, accounting for training losses during and after graduating from the Academy.
The CWPs’ forecasts, though built up from needs at the Facility Level, are only discussed in aggregate, national numbers in the annual CWPs. (An appendix in each CWP lists staffing levels at each facility at the beginning of the FY of the CWP.) As indicated in Chapter 5, FAA’s attrition forecasts are within 2% of actual attrition in aggregate for the multiple years the committee examined; hence, underestimated attrition is not a source of declining aggregate headcount relative to hires during the period discussed in this report.17
The annual CWP forecasts of future hiring can be used to examine how FAA responded to the hiring constraints and attrition experienced during the 2013–2023 period and planned for a long-term headcount to meet projected traffic demand. FAA’s facility-level staffing models (explained in Chapter 4) estimate a “staffing standard target” or “target,” which represents the agency’s best estimate of the number of PQCs it will need to meet future traffic demand. Knowing that the ATC workforce experiences an average of about 9% attrition each year, ATO sets its hiring goals to not only meet demand for future traffic but also hire enough new staff and begin to train them so that they will have enough CPCs on hand when needed. ATO estimates that trainees require 2–3 years to earn CPC certification, but as described in Chapter 6, the actual time is often longer at the largest ATC facilities.
___________________
16Annual headcount and CPC counts provided by FAA.
17Estimating the various categories of non-retirement attrition at smaller facilities is difficult because of the number of categories of attrition and the relatively small number of staff. AFN uses systemwide estimates for these facilities for retirements and a historical “rate” based approach for other types of attrition. This footnote was revised after release of the report to clarify how FAA estimates attrition for small facilities.
In Figure 3.1 of each CWP, FAA publishes a 10-year hiring goal that provides annual numbers of total estimated headcount, CPCs and ITs, annual hires, and annual attrition. The short- and long-term hiring goals set in these plans can be used to understand how FAA adjusted its hiring to account for the hiring constraints in prior years and its expectations of the staffing it will need in the future.
By 2020, as the COVID-19 pandemic continued spreading (having started in the late months of 2019), total headcount had drifted downward by about 1,000 to roughly 14,200 compared to FY 2012, but FAA’s previous 10-year plans and hiring forecasts do not imply that this reduced level of staffing was a problem. After the beginning of hiring constraints in FY 2013 and through FY 2020, FAA was forecasting annual hiring that would keep headcount in the 10th year between about 14,000 and 14,500, indicating that this headcount was its long-term goal. Its forecasts for future CPCs and CPC-ITs ranged between 12,500 and 13,200. Between FY 2014 and FY 2019, FAA’s CWPs indicated in Figure 3.1 of those publications that the number of CPCs and CPC-ITs it had on hand in the forecast year were within the staffing standard ranges shown in the annual Figure 3.1 and CWP Appendices and its projected hiring would keep up with attrition. It was also forecasting a staffing standard 10 years out from each plan that was in a fairly steady state. Thus, until the pandemic hit, FAA’s plans indicated that ATO’s hiring surges in FY 2016–2018, though constrained below modeled estimates, would nonetheless provide it with the right number of future CPCs and CPC-ITs as newly hired trainees matured to CPCs.
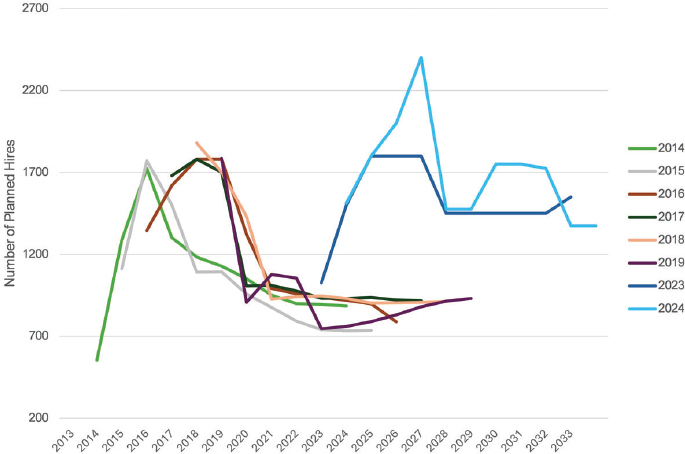
The 10-year forecasts during these years (Figure 2-6) reveals a consistent pattern of a 2–3-year surge in planned hiring, immediately after hiring constraints were experienced. This was followed by a projected leveling out after about 4 years to hiring at a steady state where forecasted future hires were balanced by expected attrition.
FAA’s forecasts between FY 2014 and FY 2020 of how many CPCs and CPC-ITs it would need in FY 2024 ranged between 12,400 and 13,100, but by the beginning of FY 2024 the actual number CPCs and CPC-ITs on hand had fallen to 11,600. However, between FY 2014 and FY 2019 FAA’s CWPs indicated that the number of CPCs and CPC-ITs on hand was within the staffing range. After the pandemic hit in late 2019, hiring was reduced sharply in FY 2020 and 2021 and attrition considerably outpaced hiring while training was paused or slowed, as described above. By FY 2021, FAA’s CWP indicated its number of CPCs and CPC-ITs on hand had dropped below the AFN staffing standard. By FY 2024 the number of CPCs and CPC-ITs had fallen to roughly 1,300 below what FAA had forecasted it would need in its annual hiring plans between FY 2014 and 2019.
As the pandemic eased, FAA made a sharp turn in direction. The FY 2023 and 2024 CWPs indicate that FAA planned to substantially increase
NOTE: The first year of each forecast is the year shown of the CWP publication.
SOURCE: Generated by the committee from annual CWPs.
hiring. Most notable in the hiring plans for these years is the substantial increase in future hiring that FAA was forecasting in the out-years (see Figure 2-6). This increase compared with the FY 2014–2019 plans implies that FAA realized it needed a considerably larger workforce. Indeed, its headcount forecasts for 10 years after the forecast year of FY 2024 would grow to almost 15,800, which would exceed by 400 the number the agency had in FY 2012, the year before the first hiring constraints were imposed.
This brief history of FAA’s responses to the hiring constraints after 2012 indicates that, despite those constraints, FAA’s hiring plans give the impression that FAA was managing around those constraints until the pandemic hit and beforehand was forecasting a long-term headcount of between 14,000 and 14,500. Even before the pandemic, however, problem signs were appearing, as described next.
DISTRIBUTION OF STAFFING ACROSS FACILITIES
Shortfalls in staffing at FAA facilities during the post FY 2010 period did not go unnoticed in Washington, DC. The U.S. Department of Transportation Office of Inspector General (OIG) issued a series of reports highlighting controller selection, hiring, and staffing shortages, including three reports expressing concerns about potential and actual shortages of CPCs occurring
at facilities the OIG deemed critical to the safe and efficient operation of the NAS (OIG 2012, 2016, 2023).
Per the study committee’s request, FAA provided data files (see Appendix B) with information on every controller on the payroll in FY 2010 through the end of FY 2024. Individuals are identified by only a number. The files include many fields of interest for this study, such as date of hire, time period to certification, Time on Position, overtime hours worked, facilities worked at, transfers, and losses from the workforce. Records are aggregated by 2-week pay periods. The files also included supplemental information about facility operations by aircraft of all types, also aggregated by pay period.
Using the same data provided by FAA, the committee examined the staffing levels at facilities and the distribution of staffing across years since FY 2010 to understand when and how the levels of understaffing reported by OIG became manifest. To estimate staffing levels, the committee used the staffing standards, or targets, derived through the AFN model, which FAA uses to estimate the number of controllers that each facility needs.
The committee estimated how well facilities met the AFN standard in FY 2010, 2017, and 2024 to understand how the aggregate trends in reduced staff were affecting facilities of different complexity levels. (Note that the committee’s endorsement of the CPC Equivalent Workforce [CEW], as discussed in Chapter 5, would modestly affect the numbers in the tables and figures that follow. In general, using the CEW would result in fewer facilities and FTEs being outside the lower ends of the staffing standard range [whether 10 or 15% or more below the midpoint] and more facilities and FTEs being above the staffing standard range. See Figure 5-1.) In Table 2-2 the committee uses its own estimate of FTE staff. Its estimate of FTE is not an end-of-year headcount as FAA uses in its CWPs. Instead, it is calculated as the annual average of all onboard controllers over the course of the year at each facility. The committee views FTEs derived in this fashion as more representative of facility strength than what facilities had at the end of the FY. The committee then estimated what is referred to as the “fill rate” in workforce planning, which is the percentage of FTEs relative to the staffing standard for facilities. The fill rate in each cell is the sum of facility controller staffing of CPCs and CPC-ITs for a group divided by the sum of the staffing standards for the group rather than an average of the fill rates of each facility in that group. In this case, the committee is estimating fill rates for types of facilities grouped in Levels 4–6, 7–9, and 10–12. This estimate is useful for getting a perspective on overall trends in facility staffing, but it does not account for the wide variation in individual facility staffing in each cell of the table, which the committee begins to address in following tables and charts.
As can be seen in Table 2-2, the fill rates of facilities in Levels 4–6 and 7–9, which represent 79% of facilities, have remained fairly constant over time at between 102 to 104%, although they did dip down to 96% for Level 4–6 facilities in FY 2017. However, facilities in Levels 10–12, which represent 21% of facilities, have declined from a 107% fill rate in FY 2010 to 92% in FY 2024. Across all 313 facilities, the fill rates have declined from 104% in FY 2010 to 95% in FY 2024. Presented this way, the data imply that by AFN’s standards, facilities appear to be generally adequately staffed, albeit with a concern about the 92% fill rate in Level 10–12 facilities in FY 2024. Even so, the total workforce is within the +/−10% of the staffing standard that AFN relied on for many years for gauging facility staffing adequacy. However, as mentioned above, broad groupings of facilities such as in Table 2-2 are incomplete because of the wide variation in facility sizes and types, the different types of traffic being managed, and the skill sets required for managing traffic across facility complexity levels. As one example, the 66 Level 10–12 facilities in FY 2024 represent 21% of facilities but 63% of total ATC staff, and these facilities experienced considerable declines in FTEs, as explained later.
Table 2-3 adds the facility types described above to the facility traffic complexity level groupings to provide a more granular depiction of staffing levels over time. Considering the 58 to 68 Towers,18 it is fairly clear that these facilities were generously staffed in FY 2010 and fell to within 10% of the staffing standard in FY 2024. Given that Towers average 18 staff members, prudent planning by having two additional controllers who are nearly
TABLE 2-2 Facility CPC and CPC-IT FTE Staffing by AFN Staffing Standard, FY 2010, 2017, and 2024
| Level | 2010 | 2017 | 2024 | |||
|---|---|---|---|---|---|---|
| N | Fill | N | Fill | N | Fill | |
| 4–6 | 90 | 104% | 104 | 96% | 104 | 102% |
| 7–9 | 154 | 98% | 142 | 99% | 143 | 99% |
| 10–12 | 68 | 107% | 66 | 103% | 66 | 92% |
| Total | 312 | 104% | 312 | 101% | 313 | 95% |
NOTES: There were actually 315 facilities in FY 2010, but the number declined due to consolidations and one new was added in 2018. To allow for consistent comparison using a variety of metrics over time, the committee only uses those facilities also in operation in FY 2024. These notes were added after release of the report to clarify the number of facilities considered in Table 2-2.
___________________
18The number of facilities change over time for a variety of reasons, including consolidations of facilities and establishment of new ones.
qualified as CPCs on board to account for forthcoming retirements could result in a fill rate of 111% if the staffing standard for that facility was 18.
For the 131 combined Towers and Approach Control facilities, fill rates have actually improved from 90 to 97% from 2010 to 2024 and the 8 Level 10–12 facilities in this group have improved even more—from 88 to 108%. The four CCFs in FY 2024, three of which are located outside the continental United States (Hawaii, Puerto Rico, and Guam) have fallen to an 82% fill rate.
Staffing for the 25 TRACONs has remained fairly stable at the low end of AFN’s +/−10% of the staffing standard, but the 21 Centers had fallen below it to 89% by FY 2024. As described next, even the 94% fill rates for TRACONs and the 89% fill rates of Centers fail to account for the impact on commercial flights of the more significantly understaffed facilities in these groupings.
The next two tables estimate the number and percentage of all facilities and CPC and CPC-IT FTEs in five percentage point groups that range from 15% below the AFN staffing standard to more than 15% above it. The +/−15% of AFN fill rates was chosen because the CRWG assumes that being below 15% of the staffing standard represents insufficient staffing to allow transfers out of a facility. The categorization into five percentage point groups also allows estimation of the share of facilities that are +/−10% of the staffing standard.
Up until the FY 2023 CWP, FAA calculated a staffing standard range for each facility based on four inputs as described in the NASEM 2014 report (NRC 2014, 71): the modeled staffing standard, Service Unit Input (described later in Chapter 5); past facility productivity; and the productivity of similar facilities. At the time of the NASEM 2014 report, FAA used facilities being within +/–10% of the range as having “acceptable” staffing (NRC 2014, 19). The CWPs from FY 2019 to FY 2022 reported an aggregate staffing standard range in the Appendix of each CWP. Although constructed using the four inputs listed above in calculating the staffing standard for each facility, this aggregate range is within rounding error of +/–10% of the midpoint. The committee does not have its own estimate of a range that represents staffing adequacy for individual facilities. Instead, it uses FAA’s own practices in interpreting staffing adequacy.19
Tables 2-4 and 2-5 indicate a lack of central tendency in the distribution of facilities and important shifts in the distribution of facilities and FTEs over time. Regarding the number of facilities, there is a slight increase in the number and share that are below 85% between FY 2010 and 2024 and a substantial decrease in the number and share that are at more than
___________________
19This paragraph was added after release of the report to clarify how the staffing standard range was determined and reported by FAA.
TABLE 2-3 Facility AFN Fill Rates Using CPC and CPC-IT FTEs, FY 2010, 2017, 2024
| Towers | ||||||
|---|---|---|---|---|---|---|
| Level | 2010 | 2017 | 2024 | |||
| N | Fill | N | Fill | N | Fill | |
| 4–6 | 56 | 124% | 64 | 117% | 68 | 113% |
| 7–9 | 54 | 114% | 54 | 114% | 56 | 105% |
| 10–12 | 19 | 112% | 18 | 117% | 18 | 101% |
| Total | 129 | 116% | 136 | 116% | 142 | 106% |
| Tower and Approach Control | ||||||
| Level | 2010 | 2017 | 2024 | |||
| N | Fill | N | Fill | N | Fill | |
| 4–6 | 34 | 85% | 40 | 90% | 36 | 89% |
| 7–9 | 92 | 92% | 79 | 94% | 77 | 97% |
| 10–12 | 8 | 88% | 8 | 103% | 8 | 108% |
| Total | 134 | 90% | 127 | 94% | 121 | 97% |
| Combined Control Facility | ||||||
| Level | 2010 | 2017 | 2024 | |||
| N | Fill | N | Fill | N | Fill | |
| 7–9 | 2 | 84% | 2 | 98% | 88 | 3 |
| 10–12 | 1 | 86% | 1 | 85% | 90 | 1 |
| Total | 3 | 85% | 3 | 90% | 178 | 4 |
| TRACONs | ||||||
| Level | 2010 | 2017 | 2024 | |||
| N | Fill | N | Fill | N | Fill | |
| 7–9 | 6 | 95% | 7 | 92% | 7 | 93% |
| 10–12 | 19 | 96% | 18 | 103% | 18 | 94% |
| Total | 25 | 96% | 25 | 102% | 25 | 94% |
| En Route Center | ||||||
| Level | 2010 | 2017 | 2024 | |||
| N | Fill | N | Fill | N | Fill | |
| 10–12 | 21 | 113% | 21 | 100% | 21 | 89% |
| Total | 21 | 113% | 21 | 100% | 21 | 89% |
TABLE 2-4 Distribution of Facilities Based on Meeting the AFN Targets, FY 2010 and 2024
| Number of Facilities | ||||
|---|---|---|---|---|
| FY 2010 | % | FY 2024 | % | |
| <85% | 63 | 20.2 | 68 | 21.7 |
| 85–89.9% | 27 | 8.7 | 27 | 8.6 |
| 90–94.9% | 31 | 9.9 | 24 | 7.7 |
| 95–99.9% | 26 | 8.3 | 36 | 11.5 |
| 100–104.9% | 32 | 10.3 | 24 | 7.7 |
| 105–109.9% | 21 | 6.7 | 37 | 11.8 |
| 110–115% | 20 | 6.4 | 21 | 6.7 |
| >115% | 92 | 29.5 | 76 | 24.3 |
| Total | 312 | 100 | 313 | 100 |
| N | % | N | % | |
| Within +/–10% | 110 | 35.3 | 121 | 38.7 |
| Within +/–15% | 157 | 50.3 | 169 | 54.0 |
NOTE: The numbers can shift slightly depending on whether using rounded or unrounded numbers.
115%. The number and percentage staffed at the 95–100% level increases, but only by 10 facilities. The total share of facilities within +/−10% of the staffing standard improves from 35.2% to 38.7% over the 15-year period, but even so, most facilities are not staffed to the AFN staffing standard by this metric in either year, which is also true when calculated over the entire period. In FY 2024, 31% of facilities are more than 10% below the staffing standard and 24.3% are more than 15% below the staffing standard.
For FTEs the shifts (actual, not modeled) are more dramatic over FY 2010 to 2024 (see Table 2-5). The number of FTEs at facilities below 85% increases by roughly 1,800 and the number above 115% drops by roughly 2,900. These shifts improve the percentage of all FTEs within +/−10% of the staffing standard between FY 2010 and FY 2024 from 40 to 47%, but even so, most staff are outside the staffing standard range.
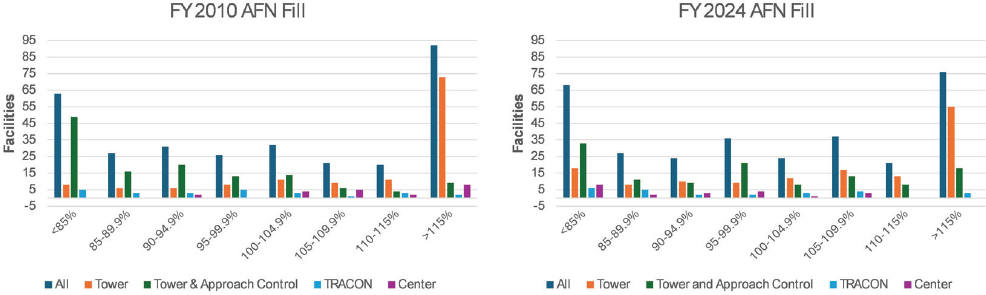
The histogram charts on the next page show the distributions and shifts in facilities and FTEs by type of facility (see Figures 2-7 and 2-8). (Note the overall decline of about 2,000 FTEs over the period. Note also that the small number of CCFs [three in FY 2010 and four in FY 2024] are shown in the totals but not as a separate category.) Towers have the highest proportion of facilities above 115% in both FY 2010 and FY 2024, but the
TABLE 2-5 Distribution of All FTES in Facilities, FY 2010 and 2024
| Full-Time Equivalents (FTEs) | ||||
|---|---|---|---|---|
| FY 2010 | % | FY 2024 | % | |
| <85% | 1,919 | 12.45 | 3,746 | 27.8 |
| 85–89.9% | 1,112 | 7.2 | 1,229 | 9.1 |
| 90–94.9% | 1,471 | 9.5 | 1,214 | 9 |
| 95–99.9% | 862 | 5.6 | 2,051 | 15.2 |
| 100–104.9% | 2,009 | 13 | 954 | 7.1 |
| 105–109.9% | 1,835 | 11.9 | 2,071 | 15.4 |
| 110–115% | 1,549 | 10.1 | 476 | 3.5 |
| >115% | 4,654 | 30.2 | 1,728 | 12.8 |
| Total | 15,411 | 100 | 13,469 | 100 |
| N | % | N | % | |
| Within +/–10% | 6,176 | 40.1 | 6,290 | 46.7 |
| Within +/–15% | 8,837 | 57.4 | 7,995 | 59.4 |
share declines over the 15-year period. Although not easy to see because of their small numbers (21), Centers shift from mostly above 110 and 115% of facilities in FY 2010 to mostly below 90 and 85% in FY 2024. TRACONs show a similar, but less pronounced shift.
In terms of FTEs, there is a dramatic decrease in Center FTEs above 115% in FY 2010 (total over 2,500) to mostly below 85% in FY 2024 (total of nearly 2,000). (The 21 Centers account for 42% of controllers.) For TRACONS, the shift in FTEs from more than 115% to less than 85% is less pronounced. The distribution of Tower and Approach Control facilities and staffing moves in the right direction, in terms of having fewer facilities and staffed below 85%, but also shows a slight increase in the number of facilities and FTEs above 115%. In FY 2024, 16.3% of FTEs are in facilities that are more than 10% below their staffing standards and 12.8% are in facilities that are more than 15% below the staffing standards.
An important conclusion derived from the data is the lack of central tendency and a considerable bimodal distribution that indicate a workforce that is not well distributed from a facility strength perspective. As described further in the next chapter, this bimodal distribution makes generalizations about current facility staffing relying on averages or total aggregate numbers prone to error, especially when the hiring constraints discussed above are accounted for.

Many of the facilities summarized in Tables 2-2 through 2-5 can change their staffing levels over time, both up and down, for a variety of reasons. As noted, facilities with fewer than 18 staff (typical of FAA’s numerous Towers at small airports) can move readily across staffing categories because of loss or gain of just 1 or 2 FTEs. This is not the case for TRACONs and Centers because of their relatively large staffs (72 and 267, respectively, in FY 2024). Moreover, some large and important facilities have long been hard-to-staff, also for a variety of reasons. The NASEM 2014 report singled out the New York TRACON (N90), the Oakland Center (ZOA), and the CCFs on Guam and Puerto Rico although there are other examples.
The New York City area airspace is considered to be the most complex and demanding airspace in the nation. This is because it is one of the country’s largest regions for originating and arriving domestic and international flights and because it has three major airports (LaGuardia, JFK, and Newark) in relatively close proximity to one another and several secondary airports with commercial service and significant general aviation activity. Training failures at some of the facilities in this region are very high (67% at N90 is the highest of all facilities and 52% at the New York Center [ZNY] is among the highest).20 In addition, the high cost of living on Long Island and the subsequent need for long commutes to and from the TRACON and Center have added to the difficulty of staffing these facilities. The extraordinary steps FAA has taken to reduce the staffing problems at N90 are described in Chapter 6. Similarly, the Northern California TRACON near Sacramento (44% training failure rate) and ZOA (33% training failure rate), also have complex airspace because of the volume of operations they manage (both international and domestic) and the close proximity of the San Francisco, Oakland, and smaller surrounding airports with substantial general aviation activity. High costs of living and lengthy commutes in the Bay Area have also made it difficult to keep these facilities adequately staffed. Guam and Puerto Rico facilities, both staffed at more than 15% below their staffing standards at the time of this writing in early 2025, have long struggled to maintain adequate staffing because of their island locations.
When the OIG issued its 2016 report (OIG 2016) listing understaffing at critical facilities, the Center at Jacksonville, Florida (ZJX), was not identified. By the time of its 2023 report (OIG 2023), the staffing problems at ZJX featured prominently because of the delays attributed to inadequate staffing and the effects on the heavy south- and northbound traffic to and
___________________
20Training failure rates mentioned in this section are as of mid-2024 as cited in FAA’s Priority Placement Tool, a spreadsheet it relies on for prioritizing placement of new staff and in managing transfers across facilities.
from Florida. ZJX moved from being overstaffed in FY 2010 to being 15% below its staffing standard in FY 2023, over which period it lost 62 CPCs or 18% of its FY 2010 workforce. In addition to its critical understaffing, FAA’s internal review of delays attributed to staffing shortages at ZJX found that poor shift scheduling and allowance of regular days off by more senior controllers that avoided weekends were compounding the problems air carriers and travelers were experiencing. Giving the most senior CPCs the weekend off when the volume of Florida’s south- and northbound traffic is often very heavy led to high levels of delay. By the time of this writing in early 2025, the Staffing Standard Target for ZJX had been raised and a sufficient number of trainees are in the pipeline to restore ZJX to an adequate staffing level within a few years. Although on the path to recovery, the staffing issues at ZJX indicate how facility management of shift schedules can exacerbate the problems of being staffed below FAA’s target: overtime use at ZJX was also excessive because of poor shift and leave scheduling.
Staffing Shortages at High-Volume Facilities
Because they can be the source of flight delays that reverberate across the NAS, it is important to consider staffing adequacy of facilities at the airport Towers, Approach Control, TRACONs, and Centers that serve the nation’s metropolitan areas with the largest share of commercial flights (see Table 2-6).21 Note that all of the Level 10–12 Centers identified above as more than 10% below the staffing standard above appear in Table 2-6, which also includes individual TRACONs and a few Level 8 and 9 facilities. Table 2-6 is based on the Core 30 airports, a group that FAA uses when reporting on nationwide delays and in standard delay reports available from FAA’s Operations Network.22 An initial glance at facility staffing indicates that many Towers at the Core 30 airports are within +/−10% of the staffing standard, if not well over it, but many of the TRACONs, Approach Control facilities, and Centers that they rely on are not. Thus, the table associates these higher-level facilities with the airport Towers to provide a more complete picture. The airports are clustered by those that are served by the same Center. The TRACONs, Approach Control, and Centers serving the Core 30 airports also serve many other airports in their regions, and all are adversely affected by staffing shortages indicated at understaffed facilities. Staffing-related flight delays, however, are more likely to be experienced at facilities
___________________
21See Appendix C for ATC facility codes used in the table. Facilities receive one color coding only. Newark Tower (EWR) is shown as served by the New York TRACON and Center in FY 2024 because it was served by these facilities for the first 10 months of FY 2024 before being transferred to the Philadelphia Tower (PHL).
serving the largest airports because of the large volume and concentration of commercial operations at these airports: Core 30 airport towers alone represent 9% of all facilities but 17% of all commercial operations.
Table 2-6 highlights facilities located in major metropolitan areas that also include many of the nation’s busiest airports, including those in the New York area, Atlanta, Chicago, Florida, Denver, Seattle, California, and Hawaii. Facilities that are 10–15% below the staffing standard are highlighted in yellow. Those that are more than 15% below the staffing standard are highlighted in orange. The 19 Level 10–12 facilities in Table 2-6 and 1 Level 9 TRACON that are more than 15% below the staffing standard represent 6% of facilities, account for 22% of all traffic operations, 27% of all commercial operations, 40% of all delays, and 45% of other delays that include staffing-related delays on all flights in FY 2024. Although small in number, understaffing at these 19 facilities is having an outsized impact on the efficiency of the NAS.
NASEM 2014 Report Recommendations
In this chapter and others, the committee has relied on and cited the annual CWPs published by FAA. The NASEM study committee that produced the 2014 report on FAA ATC staffing (NRC 2014) recommended that
FAA should take steps to ensure that the planning and execution of its air traffic controller staffing process are clear, consistent, and transparent to a range of stakeholders. Stakeholders include but are not limited to the following:
- The controller workforce, which needs to engage with FAA in the collaborative development of improved staffing plans and their execution to ensure overall cost-effectiveness; and
- Congress, which needs to make informed decisions about future budgets for controller staffing.
FAA’s annual CWPs since at least FY 2010 have provided considerable transparency about how FAA seeks to ensure adequate staffing of facilities, but they have fallen short in two important respects:
- The CWPs publish the hiring goals for the year of publication and 9 years following, but they do not publish the number of hires needed to close the staffing gap to have sufficient CPCs and CPC-ITs to adequately staff facilities. Up until the COVID-19 pandemic hit, FAA’s annual long-term hiring plans give the impression that overall staffing is adequate despite OIG reports pointing to shortfalls in staff at critical facilities. As indicated in the previous section, 61% of facilities and 53% of ATC work-
TABLE 2-6 AFN Model Staffing Levels at Facilities Serving FAA’s Core 30 Airports, FY 2024
| Towers | Approach Control | Centers | |||||||
|---|---|---|---|---|---|---|---|---|---|
| Code | Fill | Level | Code | Fill | Level | Code | Fill | Level | |
| Boston | BOS | 95 | 10 | A90 | 89 | 11 | ZBW | 99 | 11 |
| New York-New Jersey | EWR | 87 | 11 | N90 | 72 | 12 | ZNY | 76 | 12 |
| LGA | 113 | 10 | |||||||
| JFK | 98 | 11 | |||||||
| Philadelphia | PHL | 130 | 12 | ||||||
| Baltimore-Washington | BWI | 109 | 9 | PCT | 109 | 12 | ZDC | 91 | 12 |
| DCA | 101 | 10 | |||||||
| IAD | 118 | 11 | |||||||
| Atlanta | ATL | 83 | 12 | A80 | 78 | 12 | ZTL | 96 | 12 |
| CLT | 107 | 12 | |||||||
| Central Florida | MCO | 87 | 11 | F11 | 77 | 11 | ZJX | 78 | 11 |
| TPA | 101 | 10 | |||||||
| Southern Florida | FLL | 106 | 9 | FLL | 106 | 9 | ZMA | 80 | 11 |
| MIA | 88 | 12 | |||||||
| Detroit | DTW | 127 | 11 | D21 | 148 | 11 | ZOB | 108 | 12 |
| Chicago | ORD | 133 | 12 | C90 | 107 | 12 | ZAU | 99 | 12 |
| MDW | 114 | 8 | |||||||
| Minneapolis-St. Paul | MSP | 125 | 11 | M98 | 123 | 11 | ZMP | 107 | 11 |
| Towers | Approach Control | Centers | |||||||
|---|---|---|---|---|---|---|---|---|---|
| Code | Fill | Level | Code | Fill | Level | Code | Fill | Level | |
| Memphis | MEM | 133 | 9 | M03 | 71 | 9 | ZME | 86 | 12 |
| Dallas-Ft. Worth | DFW | 107 | 12 | D10 | 96 | 12 | ZFW | 98 | 12 |
| Houston | IAH | 112 | 12 | I90 | 107 | 12 | ZHU | 105 | 11 |
| Denver | DEN | 77 | 12 | D01 | 105 | 11 | ZDV | 81 | 10 |
| Salt Lake City | SLC | 108 | 10 | S56 | 94 | 10 | ZLC | 72 | 10 |
| Phoenix | PHX | 80 | 11 | P50 | 95 | 11 | ZAB | 72 | 10 |
| Seattle | SEA | 87 | 9 | S46 | 67 | 10 | ZSE | 104 | 10 |
| Northern California | SFO | 93 | 9 | NCT | 80 | 12 | ZOA | 68 | 11 |
| Southern California | LAX | 110 | 11 | SCT | 104 | 12 | ZLA | 76 | 12 |
| SAN | 121 | 7 | |||||||
| Las Vegas | LAS | 83 | 11 | L30 | 88 | 11 | |||
| Hawaii | HCF | 82 | 11 | ||||||
NOTES: Cells with yellow backgrounds are between 10–15% below their staffing standards. Those with orange backgrounds are more than 15% below their staffing standards. Staffing standard values for facilities serving multiple airports or facilities also serving the same airport are shown only once. Approach Control includes combined approach control and tower services. See Appendix C for names of facilities indicated by their FAA facility codes.
SOURCE: Calculations by committee using FTEs and its category definitions.
- force FTEs were outside of +/−10% of the staffing standard in FY 2024.
- During this period, the modeled aggregate number of CPCs and CPC-ITs may have been within reach 3 years out, but by focusing only on aggregate numbers across all facilities, problems at individual facilities are not made apparent, particularly those that are more than 15% below their staffing standards.
FINDINGS AND RECOMMENDATIONS
Finding 2-1: Hiring constraints after FY 2012 contributed to a 10% (1,160) decline in CPCs by the end of FY 2023. However, it is not apparent from FAA’s 10-year hiring plans through FY 2019 that these reductions were considered sufficiently problematic or systemic to warrant increases in hiring that Congress and the controller workforce should have been aware of. By FY 2023 and 2024, and largely free of hiring constraints, FAA reversed direction regarding its plans for future hiring: its FY 2023–2024 long-term hiring plans demonstrate an intent, subject to funding availability, to increase overall staffing levels through substantially increased hiring.
Finding 2-2: Aggregate facility staffing relative to their staffing standards fell from 104% to 95% between FY 2010 and 2024 and therefore remained within the staffing standard range, but at the beginning and end of this same period between 61 and 65% of facilities were outside of the staffing standard range. The largest downward shift in facility staffing and FTEs occurred at the largest facilities that are essential for the safe and efficient movement of commercial aircraft. Because Level 10–12 facilities in a few metropolitan areas (mostly TRACONs and Centers) are responsible for a large share of commercial aircraft operations, staffing shortages at these facilities cause a disproportionately large share of flight and passenger delays nationwide. Recommendations to address staffing imbalances across facilities appear in Chapters 5 and 6.
Finding 2-3: The NASEM study committee that produced the 2014 report on FAA ATC facility staffing recommended that FAA ensure that its annual CWPs provide transparency to Congress and the controller workforce. The CWPs do provide an informative and valuable resource but fall short by (a) not publishing the modeled estimate of the hires needed to meet the staffing standard and (b) focusing only on aggregate measures of workforce strength rather than addressing the variations in facility staffing.
Recommendation 2-1: FAA should include in its annual CWPs the number of new hires that ATO should make each year as estimated by its facility-level staffing models along with the agency’s 10-year hiring goals. The CWPs should also report on staffing adequacy at individual facilities to raise awareness of facilities that are staffed above and below the staffing standard range and indicate how those variances will be addressed.
Growing awareness of declining ATC facility headcount and CPCs apparently contributed to the development of a new and rival approach for estimating the number of CPCs needed at each facility. The modeling approach developed by the CRWG is compared to the approach FAA has traditionally relied on in Chapter 4. However, a different approach that recommends a substantially higher level of staffing does not address the more central problems of not hiring as many new staff as the models indicate are needed and a workforce that is not well balanced across facilities relative to their staffing standards. These issues are further addressed in Chapters 5 and 6.
REFERENCES
FAA (Federal Aviation Administration). 2010. “Air Traffic Controller Workforce Plan: 2010–2019.”
FAA. 2011. “Air Traffic Controller Workforce Plan: 2011–2020.”
FAA. 2012. “Air Traffic Controller Workforce Plan: 2012–2021.”
FAA. 2013. “Air Traffic Controller Workforce Plan: 2013–2022.”
FAA. 2014. “Air Traffic Controller Workforce Plan: 2014–2023.”
FAA. 2015. “Air Traffic Controller Workforce Plan: 2015–2024.”
FAA. 2016. “Air Traffic Controller Workforce Plan: 2016–2025.”
FAA. 2017. “Air Traffic Controller Workforce Plan: 2017–2026.”
FAA. 2018. “Air Traffic Controller Workforce Plan: 2018–2027.”
FAA. 2019. “Air Traffic Controller Workforce Plan: 2019–2028.”
FAA. 2020. “Air Traffic Controller Workforce Plan: 2020–2029.”
FAA. 2021. “Air Traffic Controller Workforce Plan: 2021–2030.”
FAA. 2022. “Air Traffic Controller Workforce Plan: 2022–2031.”
FAA. 2023. “Air Traffic Controller Workforce Plan: 2023–2032.”
FAA. 2024. “Air Traffic Controller Workforce Plan: 2024–2033.”
GAO (Government Accountability Office). 2014. “2013 Sequestration: Agencies Reduced Some Services and Investments, While Taking Certain Actions to Mitigate Effects.” GAO-14-244.
NASEM (National Academies of Sciences, Engineering, and Medicine). 2021. Emerging Hazards in Commercial Aviation—Report 1: Initial Assessment of Safety Data and Analysis Processes. The National Academies Press. https://doi.org/10.17226/26673.
NRC (National Research Council). 2014. The Federal Aviation Administration’s Approach for Determining Future Air Traffic Controller Staffing Needs, TRB Special Report 314. The National Academies Press. https://doi.org/10.17226/18824.
OIG (Office of Inspector General). 2012. “Enhanced Oversight of Staffing and Training at FAA’s Critical Facilities Is Needed to Maintain Continuity of Operations, Report Number: AV-2012-039.”
OIG. 2016. “FAA Continues to Face Challenges in Ensuring Enough Fully Trained Controllers at Critical Facilities, Report Number: AV-2016-014.”
OIG. 2017. “While FAA Took Steps Intended to Improve Its Controller Hiring Processes, the Agency Did Not Effectively Implement Its New Policies.” Report Number: AV2017028.
OIG. 2023. “FAA Faces Controller Staffing Challenges as Air Traffic Operations Return to Pre-Pandemic Levels at Critical Facilities.” Report Number: AV2023035.
This page intentionally left blank.


