The Air Traffic Controller Workforce Imperative: Staffing Models and Their Implementation to Ensure Safe and Efficient Airspace Operations (2025)
Chapter: Appendix B: Air Traffic Control Staffing Data File and Results of Analyses
B
Air Traffic Control Staffing Data File and Results of Analyses
This appendix describes (a) a database the committee assembled from data files the Federal Aviation Administration (FAA) provided the committee and (b) tables, figures, and analyses prepared by the committee, several of which are more detailed than figures included in the chapters.
The database includes more than 33,000 unique controllers on the payroll from Fiscal Year (FY) 2010 through the end of FY 2024. The individual-level data include date of hire; date and location of first placement; dates of certifications on initial position and all subsequent ones; training failures; transfers; time recorded each pay period as worked in various categories, including overtime, if any; and leave taken. Individual controllers are identified only by number. These deidentified records are linked to all the facilities where individual controllers worked. All these records were made available by 2-week pay periods. Because of aggregation by pay period, the file does not provide information about daily or weekly shifts worked by individuals. The data file also includes facility traffic operations by type (commercial, military, general aviation) and staffing triggers also aggregated by pay period. Most of the tables and figures included in the body of the report are drawn from these data.
In the sections that follow, the tables and figures presented elaborate on analyses presented in the chapters. The first section shows some general trends in aggregate operations staffing, operations handled per Full-Time Equivalent (FTE) controllers, and overtime. The second section provides tables and a figure showing a lack of correlation between use of overtime and facility staffing levels. The third section provides tables showing trends in training failure rates at the Academy and in facilities where On-the-Job
Training (OJT) occurs. The two figures in this section show a general lack of correlation between facility fill rates and training times. Note that for FAA, OJT is defined and measured as time in training on position; classroom and individual training is not included in the tables included in the third section. The fourth section shows trends in achievement of training goals and the lack of correlation between time trainees spend in OJT in general and when examined by facility type and Level. The final two brief sections provide two figures that add additional detail to the subject matter described in Chapters 4 and 5.
GENERAL TRENDS FY 2010–2024
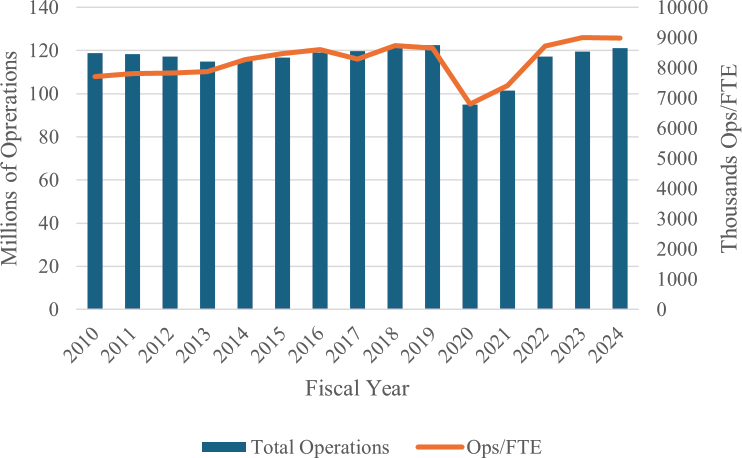
This section provides an overview of general trends in operations, staffing levels (expressed in FTE controllers), the number of operations handled per FTE, the regular and overtime hours worked by FTEs, and Time on Position (TOP) relative to FTEs, operations, and total regular hours worked. The overall picture that emerges is that traffic increased; the number of FTEs declined; and operations handled per FTE grew, which makes sense because with more operations and fewer FTEs the number of operations per FTE would have to increase. However, the trends also show that FTEs worked fewer regular hours and less TOP, which is perplexing because of increased operations and fewer FTEs.
Figure B-1 displays trends in operations by facility type. FAA provided operations in 2-week pay periods to correspond with other data provided, such as FTEs, hours worked, overtime, and TOP, which were also provided in pay periods. FY 2017 had 27 pay periods rather than the typical 26 per year. The first pay period of FY 2017 began 12 days before the Fiscal Year began, thus the large increase shown between FY 2016 and 2017 is mostly a result of operations on the extra days in FY 2016 being allocated to FY 2017. During the FY 2010–2024 period, operations increased 4% overall, but varied by facility type: Centers, +6%; Terminal Radar Approach Controls (TRACONs), +4%; the four Combined Control Facilities (CCFs), +28%; Towers, −2%; and Tower and Approach Control, +6%.
Figure B-2 shows changes in FTEs by facility type, which fell 13% overall. Centers and Tower and Approach Control facilities declined 15%; TRACONs declined 12%; and Towers declined 6%. CCFs (with the fewest staff in any category) increased by 9%.
Figure B-3 shows how the number of operations handled per FTE changed relative to total operations as operations increased and the number of FTEs fell. As noted, total operations increased 4% overall, while operations handled/FTE increased by 19% overall since increased operations were being handled by fewer FTEs. Operations/FTE at Centers and Towers and Approach Control grew by 24%; TRACONs and CCFs by 18%; and Towers by 4%. FAA officials hypothesized that such large increases in
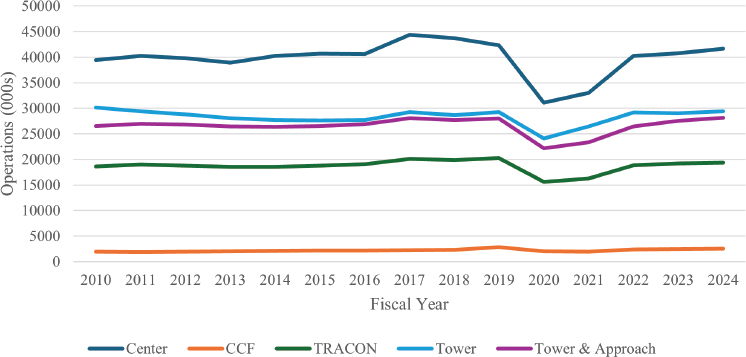
NOTES: Facility type titles abbreviated. CCF = Combined Control Facility; Tower & Approach = Tower and Approach Control; TRACON = Terminal Radar Approach Control.

NOTE: Operations derived from annual data provided by FAA from Operations Network (OPSNET): https://aspm.faa.gov/opsnet/sys/main.asp.
controller productivity might be the result of improved flow management practices that FAA has introduced over the years, but the committee had no way to verify this theory.
Figure B-4 shows how regular hours worked/FTE declined (5% overall) and was more than made up by overtime. Possible reasons why regular hours worked would decline and be replaced by overtime hours is discussed in Chapter 3.
Figure B-5 shows the changes in regular hours and overtime hours. Overtime hours per FTE grew threefold over the period (308%), from 41 to 167 hours per FTE. The committee’s review of the impact of facility use on overtime based on their staffing levels was inconclusive as shown in plots provided in the next section.
CORRELATION BETWEEN OVERTIME AND FACILITY STAFFING
The following four tables (B-1 through B-4) indicate a lack of correlation between facility staffing levels and use of overtime when examined as overtime hours/FTE or overtime as a percent of all facility hours worked. The first two tables report lack of correlations between overtime use and staffing levels using FAA’s Office of Finance and Management (AFN) staffing


| Facility Type | ||||||
|---|---|---|---|---|---|---|
| Facility Level | Center | CCF | TRACON | Up/Down | Tower | All |
| 10–12 | –0.587 | –0.576 | –0.826 | –0.440 | –0.468 | |
| 7–9 | –0.714 | –0.246 | –0.321 | –0.309 | –0.309 | |
| 4–6 | –0.496 | –0.273 | –0.330 | |||
| –0.587 | –0.714 | –0.466 | –0.298 | –0.381 | –0.372 | |
| Facility Type | ||||||
|---|---|---|---|---|---|---|
| Facility Level | Center | CCF | TRACON | Up/Down | Tower | All |
| 10–12 | –0.593 | –0.559 | –0.833 | –0.440 | –0.457 | |
| 7–9 | –0.776 | –0.227 | –0.311 | –0.298 | –0.298 | |
| 4–6 | –0.474 | –0.244 | –0.306 | |||
| –0.593 | –0.776 | –0.456 | –0.284 | –0.365 | –0.360 | |
| Facility Type | ||||||
|---|---|---|---|---|---|---|
| Facility Level | Center | CCF | TRACON | Up/Down | Tower | All |
| 10–12 | –0.702 | –0.511 | –0.612 | –0.586 | –0.586 | |
| 7–9 | 0.237 | –0.508 | –0.385 | –0.387 | –0.387 | |
| 4–6 | –0.262 | –0.240 | –0.257 | |||
| –0.702 | 0.237 | –0.448 | –0.258 | –0.242 | –0.245 | |
| Facility Type | ||||||
|---|---|---|---|---|---|---|
| Facility Level | Center | CCF | TRACON | Up/Down | Tower | All |
| 10–12 | –0.696 | –0.510 | –0.601 | –0.547 | –0.570 | |
| 7–9 | –0.327 | –0.513 | –0.369 | –0.362 | –0.362 | |
| 4–6 | –0.252 | –0.215 | –0.238 | |||
| –0.696 | –0.327 | –0.453 | –0.240 | –0.205 | –0.224 | |
standards (see Tables B-1 and B-2) and the second two using the Collaborative Resource Working Group (CRWG) staffing targets (see Tables B-3 and B-4).
The scatterplots in Figure B-6 illustrate the lack of a correlation between AFN fill rate and overtime hours per FTE in general but with stronger correlations for higher-level Centers, TRACONs, and Towers.
TRENDS IN TRAINING FAILURE RATES
Chapter 6 describes increasing training failure rates among Academy attendees and Developmental (DEV) and Certified Professional Controller-In Training (CPC-IT) trainees at facilities. As shown in Table B-5, the Academy failure rate rose from 7% to 26% over the entire FY 2010–2024 period. As described in Chapter 5, Academy training failures tend to increase with increasing hiring class size. The trainee (DEV and CPC-IT) training failures during OJT training are also estimated in Table B-5, but the trends in more recent years have to be interpreted with regard to the percentage of trainees still in progress (third row of Table B-5). By 2020, with 12% still in progress, the failure rate was the same as in 2010 (11%), but it had fallen to as low as 4% in 2016. CPC success rates (survivors from Academy and OJT training failures) had fallen from 81% in FY 2010 to 57% by FY 2020.
Tables B-6 through B-8 show the trends in Table B-5 separately for new hires in the Centers and Terminal Tracks (see Tables B-6 and B-7) and for new hires with Previous Experience who were placed in facilities for OJT (almost always in Terminals) (see Table B-8).
TRAINING GOALS
One of the important concerns regarding trainees is whether they are meeting the training goals set by FAA’s Air Traffic Organization (ATO), as described in Chapter 6. As shown in Table B-9, goals are being met in Level 4–9 but not in Level 10–12 facilities, where training times to reach CPC following initial placement have increased from 2.8 to 3.1 years to 3.9 to 4.3 years.1
As described in Chapter 4, the CRWG modeling process has the explicit goal of allowing trainees to devote their time to training to accelerate the time to reach CPC certification and not spend time on TOP. However, examination of time spent on OJT by trainees (non-CPCs) by AFN fill rate does not suggest that being in an understaffed facility affects time spent in OJT (see Figures B-7 and B-8). There is no apparent correlation in general
___________________
1This sentence was revised after release of the report to correct estimates of training times.

| Fiscal Year | 2010 | 2011 | 2012 | 2013 | 2014 | 2015 | 2016 | 2017 | 2018 | 2019 | 2020 | 2021 | 2022 | 2023 | 2024 |
|---|---|---|---|---|---|---|---|---|---|---|---|---|---|---|---|
| Academy Failure Rate | 7% | 7% | 17% | 14% | 18% | 27% | 29% | 41% | 30% | 21% | 16% | 28% | 29% | 30% | 26% |
| In Progress | 0% | 0% | 0% | 0% | 0% | 0% | 1% | 2% | 4% | 7% | 12% | 12% | 29% | 50% | 71% |
| DEV Failure Rate | 11% | 9% | 8% | 8% | 9% | 6% | 4% | 5% | 7% | 9% | 11% | 7% | 4% | 2% | 0% |
| CPC Success Rate | 81% | 82% | 74% | 77% | 71% | 65% | 63% | 51% | 56% | 61% | 57% | 50% | 37% | 18% | 2% |
SOURCE: Generated by the committee with data provided by FAA.
(see Figure B-7), or when examining facilities by type and Level of AFN staffing (see Figure B-8).
Another concern related to training is whether trainees must cover positions for which they are certified on overtime. Based on the committee’s review of overtime hours by CPCs and trainees by Facility Level, it appears that CPCs are working almost all overtime hours and non-CPCs working about 1% of overtime.
| 2010 | 2011 | 2012 | 2013 | 2014 | 2015 | 2016 | 2017 | 2018 | 2019 | 2020 | 2021 | 2022 | 2023 | 2024 | |
|---|---|---|---|---|---|---|---|---|---|---|---|---|---|---|---|
| Academy Failure Rate | 7% | 14% | 28% | 21% | 31% | 42% | 42% | 52% | 40% | 31% | 28% | 44% | 42% | 40% | 32% |
| In Progress | 0% | 0% | 0% | 0% | 0% | 0% | 1% | 3% | 6% | 13% | 26% | 21% | 47% | 58% | 67% |
| DEV Failure Rate | 10% | 7% | 5% | 6% | 7% | 3% | 3% | 3% | 6% | 8% | 9% | 6% | 3% | 1% | 0% |
| CPC Success Rate | 80% | 77% | 66% | 72% | 61% | 54% | 51% | 41% | 45% | 46% | 36% | 27% | 8% | 0% | 0% |
| 2010 | 2011 | 2012 | 2013 | 2014 | 2015 | 2016 | 2017 | 2018 | 2019 | 2020 | 2021 | 2022 | 2023 | 2024 | |
|---|---|---|---|---|---|---|---|---|---|---|---|---|---|---|---|
| Academy Failure Rate | 7% | 4% | 4% | 9% | 9% | 22% | 22% | 49% | 33% | 32% | 24% | 32% | 36% | 32% | 25% |
| In Progress | 0% | 0% | 0% | 0% | 0% | 0% | 0% | 0% | 3% | 4% | 6% | 8% | 10% | 47% | 73% |
| DEV Failure Rate | 11% | 11% | 12% | 9% | 11% | 6% | 5% | 4% | 7% | 8% | 9% | 4% | 4% | 2% | 0% |
| CPC Success Rate | 80% | 84% | 84% | 81% | 80% | 70% | 71% | 46% | 55% | 54% | 57% | 53% | 48% | 19% | 2% |
| 2010 | 2011 | 2012 | 2013 | 2014 | 2015 | 2016 | 2017 | 2018 | 2019 | 2020 | 2021 | 2022 | 2023 | 2024 | |
|---|---|---|---|---|---|---|---|---|---|---|---|---|---|---|---|
| In Progress | 0% | 0% | 0% | 2% | 0% | 0% | 1% | 0% | 1% | 1% | 3% | 3% | 11% | 34% | 85% |
| DEV Failure Rate | 9% | 9% | 0% | 11% | 16% | 11% | 7% | 12% | 11% | 10% | 16% | 12% | 6% | 2% | 1% |
| CPC Success Rate | 90% | 81% | 88% | 84% | 78% | 84% | 91% | 85% | 83% | 86% | 77% | 81% | 81% | 63% | 14% |
TABLE B-9 Average Training Time (Years) to CPC by Level of Facility, FY 2010–2019
| Average to CPC | FY | ||||||||||
|---|---|---|---|---|---|---|---|---|---|---|---|
| Facility Level | 2010 | 2011 | 2012 | 2013 | 2014 | 2015 | 2016 | 2017 | 2018 | 2019 | Grand Total |
| 4 | 3.6 | 2.5 | 2.7 | 2.0 | 1.9 | 2.5 | 1.5 | 2.1 | 1.6 | 2.0 | |
| 5 | 2.5 | 2.1 | 2.0 | 1.9 | 1.9 | 1.7 | 2.1 | 1.8 | 1.8 | 1.9 | 1.9 |
| 6 | 2.7 | 2.2 | 2.3 | 2.0 | 1.9 | 1.9 | 2.3 | 1.9 | 1.9 | 1.8 | 2.1 |
| 7 | 2.5 | 2.1 | 2.2 | 2.5 | 2.0 | 2.0 | 2.2 | 2.1 | 2.3 | 2.3 | 2.2 |
| 8 | 2.3 | 2.1 | 2.2 | 2.4 | 2.2 | 2.6 | 2.5 | 2.4 | 2.3 | 2.2 | 2.3 |
| 9 | 2.9 | 2.7 | 2.9 | 3.3 | 2.3 | 2.9 | 2.9 | 2.3 | 2.8 | 3.0 | 2.7 |
| 10 | 3.1 | 2.5 | 2.7 | 2.7 | 2.6 | 3.0 | 3.1 | 2.9 | 3.7 | 3.9 | 3.0 |
| 11 | 3.0 | 2.8 | 2.8 | 2.8 | 2.8 | 3.0 | 3.3 | 3.4 | 4.0 | 4.3 | 3.2 |
| 12 | 2.8 | 3.0 | 3.1 | 2.8 | 2.6 | 2.9 | 3.4 | 3.7 | 4.2 | 4.3 | 3.3 |
| Grand Total | 2.7 | 2.4 | 2.6 | 2.5 | 2.3 | 2.4 | 2.8 | 2.6 | 2.9 | 2.9 | 2.6 |
NOTE: Grand Totals are not averages of rows or columns. Rather, they are recalculated in each case based on the amount of training time divided by the controllers involved.


TABLE B-10 Overtime by CPCs and Non-CPCs by Facility Level, FY 2010–2024
| Facility Level 4–6 | ||||||||||||||||
|---|---|---|---|---|---|---|---|---|---|---|---|---|---|---|---|---|
| Certification | FY 2010 | 2011 | 012 | 2013 | 2014 | 2015 | 2016 | 2017 | 2018 | 2019 | 2020 | 2021 | 2022 | 2023 | 2024 | Grand Total |
| CPC | 2% | 2% | 2% | 1% | 1% | 2% | 3% | 5% | 5% | 5% | 4% | 5% | 6% | 7% | 8% | 4% |
| Non-CPC | 0% | 0% | 0% | 0% | 0% | 0% | 0% | 0% | 0% | 1% | 0% | 0% | 1% | 1% | 0% | 0% |
| Grand Total | 1% | 1% | 1% | 1% | 1% | 2% | 2% | 3% | 3% | 4% | 3% | 4% | 5% | 6% | 6% | 3% |
| Facility Level 7–9 | ||||||||||||||||
| Certification | FY 2010 | 2011 | 012 | 2013 | 2014 | 2015 | 2016 | 2017 | 2018 | 2019 | 2020 | 2021 | 2022 | 2023 | 2024 | Grand Total |
| CPC | 2% | 2% | 2% | 2% | 2% | 3% | 4% | 6% | 6% | 7% | 5% | 7% | 8% | 9% | 10% | 5% |
| Non-CPC | 0% | 0% | 0% | 0% | 0% | 0% | 0% | 1% | 1% | 1% | 1% | 1% | 1% | 1% | 1% | 1% |
| Grand Total | 2% | 2% | 2% | 1% | 2% | 2% | 3% | 4% | 4% | 5% | 4% | 6% | 7% | 8% | 8% | 4% |
| Facility Level 10–12 | ||||||||||||||||
| Certification | FY 2010 | 2011 | 012 | 2013 | 2014 | 2015 | 2016 | 2017 | 2018 | 2019 | 2020 | 2021 | 2022 | 2023 | 2024 | Grand Total |
| CPC | 3% | 3% | 3% | 3% | 3% | 4% | 5% | 7% | 8% | 9% | 7% | 7% | 11% | 11% | 11% | 6% |
| Non-CPC | 0% | 0% | 0% | 0% | 0% | 1% | 1% | 1% | 1% | 1% | 1% | 0% | 1% | 1% | 1% | 1% |
| Grand Total | 2% | 2% | 3% | 2% | 3% | 4% | 4% | 6% | 6% | 7% | 5% | 6% | 9% | 9% | 9% | 5% |
NOTES: Table entries show Overtime (OT) as a % of Total Work Hours (i.e., OT/(Reg Work Hrs + OT)). Grand Totals for rows and columns are not averages. Rather they are recalculated based on the total OT by controllers within or across Levels or years divided by Total Work Hours across Levels or years.
SOURCE: Generated by the committee with data provided by FAA.

SOURCE: Generated by the committee using data provided by FAA.
COMPARATIVE FILL RATES
The fill rates reported in Chapter 2 and 3 tables are limited to those that apply to AFN’s modeled estimates of staffing targets because, as noted in Chapter 5, the CRWG estimates that 92% of facilities are understaffed by more than 85%. CRWG fill rates with those of AFN’s are shown for all facilities in Figure B-9 along with the CPC-Equivalent Workforce Concept (CEW) discussed in Chapter 5.
EXAMPLE OF AFN REGRESSION EQUATION: DAILY STAFFING FORECAST
See Figure B-10 on next page.

SOURCE: FAA presentation to the committee, FAA Staffing Standards Overview, June 2024.
This page intentionally left blank.


