Practices to Enhance Resiliency of Existing Roadway and Embankment Culverts (2025)
Chapter: 3 State of the Practice (Survey Results)
CHAPTER 3
State of the Practice (Survey Results)
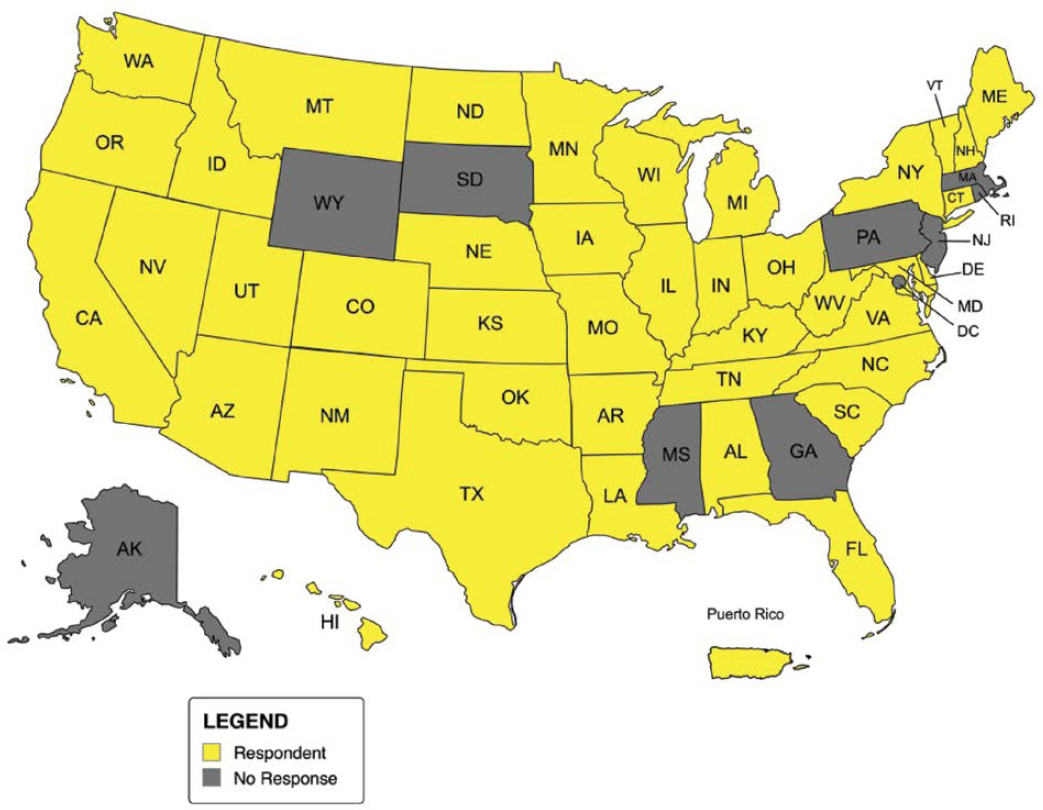
This chapter documents the current state of the practice for statewide culvert resilience enhancement by synthesizing findings from the survey. The survey was distributed to 52 departments of transportation: all 50 state DOTs, the District of Columbia DOT, and the DOT of Puerto Rico. The survey questionnaire is detailed in Appendix A, and a compilation of survey responses is provided in Appendix B. Of the 52 DOTs that were contacted, 42 participated in the survey (81% response rate). Participating DOTs are shown in Figure 12. This chapter outlines the results of the survey, including culvert types and materials employed by the DOTs; life-cycle cost analysis and risk assessment methodologies; current maintenance and management practices; failure mechanisms, durability, and practices to enhance resiliency; and types of extreme weather events of concern for culvert resilience.
The survey was distributed through a link via email to DOT representatives best suited to complete the survey. A PDF copy of the survey was also provided, and collaboration across teams and departments was encouraged so that all questions in the survey could be thoroughly answered. Some DOTs stated that collaboration was necessary because the survey questions spanned a wide breadth of expertise.
For the purpose of consistency, the following definition was provided at the beginning of the survey:
- Culvert: A buried drainage structure underneath a roadway or embankment that is open at both ends and used to convey and transport water from one side of the roadway or embankment to the other. They can range in diameter/diagonal size from 15 in. to 240 in. (20 ft) and can be circular, arched, elliptical, or box shaped. For the purposes of this survey, the questions on culverts pertain only to those structures owned or maintained by the state DOT.
3.1 Culvert Types and Materials Employed by DOTs
The first several questions in the survey asked about the different types and materials of culverts currently under the jurisdiction of the DOT.
In Question 1, respondents were asked to identify the approximate percentage of state DOT culverts of various materials and shapes within their inventory. Twenty respondents (48%) commented on a lack of available information or indicated a degree of uncertainty in their reporting. Based on the respondents that provided information related to the estimated percentage breakdown of culvert materials and shapes in their inventory, circular reinforced concrete culverts made up approximately 35% of the total reported culvert inventory, and circular galvanized corrugated metal culverts made up approximately 30%.
Respondents cited the following additional culvert types, which were absent from the options presented:
- Masonry
- Masonry arch
- Terracotta
- Smooth steel
- Metal box
- Metal three-sided
- Structural plate pipe
- Cast-in-place
- Corrugated metal pipe with high-density polyethylene (HDPE) liner
- Timber
- Limestone block
- PVC
- Cast or ductile iron.
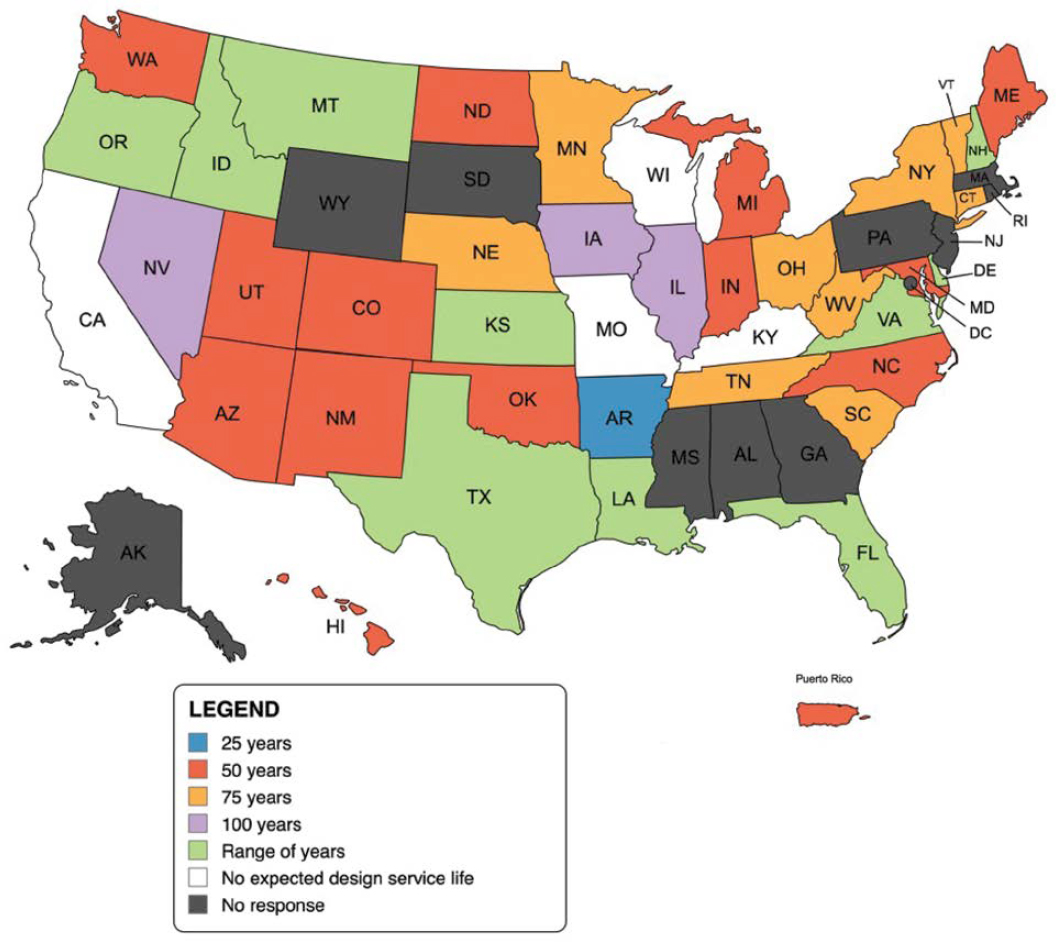
In Question 2, four states (10%) answered that they do not have an expected design service life of state DOT roadway and embankment culverts. Question 2a was provided to the 37 respondents that answered “yes” to having an expected design service life for roadway and embankment culverts. Question 2a offered choices for expected design service life of 25 years, 50 years,
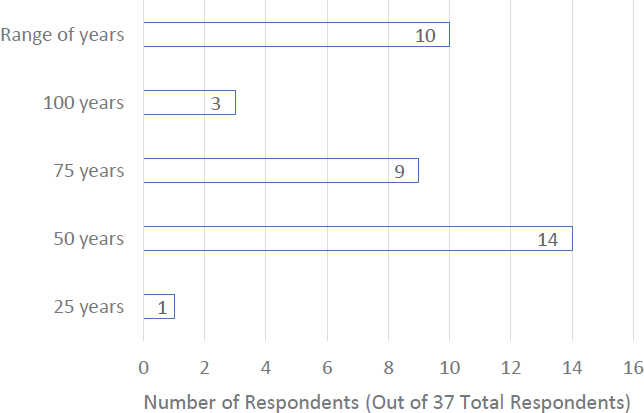
75 years, and 100 years, and also gave the option to write in a short answer if these options did not fit what the DOT specifies. Ten states (27%) wrote in that there is a range to expected design service life that depends on the roadway classification or culvert material. Figure 13 shows expected design service life of culverts as specified by state DOTs, and Figure 14 shows a summary of the data.
Question 2b asked respondents whether culvert material or surrounding soil type influences the expected design service life of the culvert. Seventeen respondents (46%) answered that culvert material affects specified service life, including nine (24%) that indicated that soil type also affects this attribute. Eighteen respondents (49%) indicated that neither culvert material nor soil type affect the specified service life of roadway and embankment culverts. The results of Question 2b are shown in Figure 15.
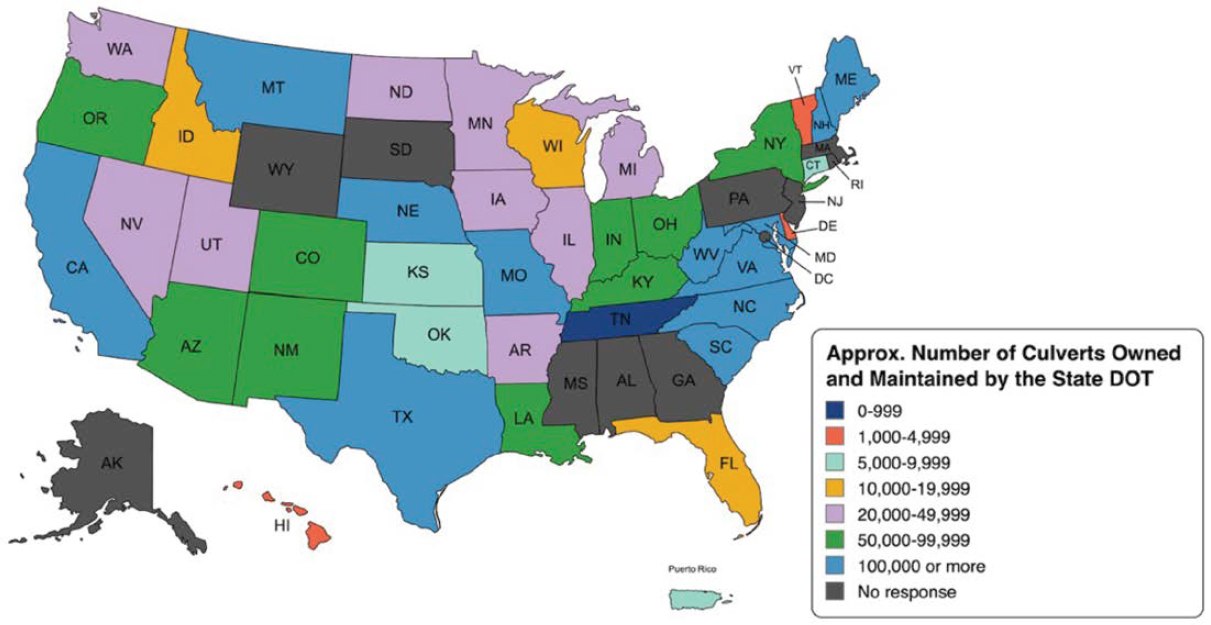
Question 3 asked respondents to estimate the number of culverts owned and maintained by their DOT. Of 41 that responded, 12 states (29%) own and maintain 100,000 or more culverts;

18 states (44%) own and maintain between 20,000 to 100,000 culverts; and 11 states (27%) own and maintain fewer than 20,000 culverts. Based on this information, it was estimated that a total of 2.57 ± 0.69 million culverts are owned and maintained by the state DOTs that responded to this question. A geographical representation of the responses is shown in Figure 16.
Using the information obtained from Question 3 regarding the number of culverts each state DOT maintains, the total number of state DOT-maintained culverts reported by the 42 respondents is around 2.57 million (± 690,000, based on the ranges offered for selection in the survey).
3.2 Life-Cycle Cost Analysis and Risk Assessment Methodologies
The following note was provided before the next section of questions:
For the purposes of the questions below, life-cycle cost analysis (LCCA) refers to an economic analysis tool to determine the most cost-efficient option from a selection of choices. Risk assessment refers to a formal analysis tool to evaluate and quantify the vulnerability and relative resilience of culverts. Cost–benefit analysis (CBA) refers to a formal method of comparing the benefits of taking some type of action on the culvert (e.g., repair or replacement) with the costs associated with that action.
Question 4 asked whether the state DOT uses a formal risk assessment methodology to evaluate culvert resiliency and durability. Of the 41 DOTs that responded, 32 (78%) answered that they do not have a formal risk assessment methodology to evaluate culvert resiliency and durability. If the respondent answered “yes,” Question 4a and Question 4b were displayed as text boxes where the respondent could upload documents or links associated with the formal risk assessment methodology for their state. Six of the seven write-in responses (86%) provided links and documents related to service life of culvert material but did not explicitly provide risk assessment methodologies. Colorado DOT provided a link to a formal risk assessment program employed
by the state (https://www.codot.gov/programs/planning/cdot-resilience-program). State DOTs may have formal risk assessment methodologies that are not posted on their websites.
Question 5 asked how state DOTs determine if a culvert should be considered for replacement or rehabilitation. Thirty-eight respondents (90%) reported that conducting field inspections is the most frequently implemented practice to determine if a culvert should be considered for replacement or rehabilitation, followed by routine maintenance (25 respondents, 60%). Twenty-nine respondents (69%) indicated that multiple practices are implemented concurrently to help determine if a culvert should be considered for replacement or rehabilitation. Figure 17 shows the number of state DOTs that implement various practices to determine culvert replacement or rehabilitation to enhance resiliency. Additional practices not specified in the survey answer options are detailed in Table 1.
Question 6 asked respondents to identify all methodologies that aid in making decisions determining culvert replacement or rehabilitation to enhance resiliency. Respondents were allowed to select one or more answer options unless “no formal analysis” was selected. Seventeen respondents (40%) indicated that their state DOT uses risk assessment to assist in decision-making for determining culvert replacement or rehabilitation. An equal number of respondents answered that they had no formal analysis tool to assist in decision-making about resilience-enhancing replacement of culverts. Figure 18 shows the number of state DOTs that use various methodologies to aid in decisions regarding culvert replacement or rehabilitation to enhance resiliency.
If the respondent selected any of the answer options besides “no formal analysis” in Question 6, Question 6a and Question 6b were displayed as text boxes where the respondent could upload the documents or links associated with their decision process of replacement and rehabilitation of culverts. The links and documents provided in Questions 6a and 6b are included in Appendix B.
3.3 Current Maintenance and Management Practices
Question 7 asked for which culvert sizes the state DOT has a formal asset management system in place. Respondents were given the option to select one or more culvert sizes. Thirty-two respondents (76%) answered that multiple culvert sizes are inventoried within the state DOT asset management system. Seventeen respondents (40%) have an asset management system for all culverts (15”–240”). Ten respondents (24%) wrote that certain culvert sizes are managed under the bridge division inventory, although this culvert size threshold varied between answers.
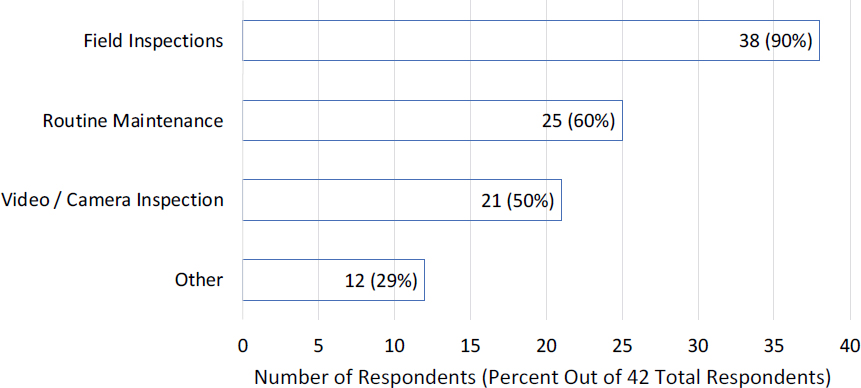
Table 1. Responses to Question 5: Other practices to determine culvert replacement or rehabilitation.
| State DOT | Other (Please Specify) |
|---|---|
| Nebraska | NDOT’s 5-year program is the trigger on identifying the condition of culverts in order to determine whether to replace/rehab. The NDOT’s culvert inventory is underway but until we have an inventory of all of our culverts and inspection program, we use the 5-year program as a trigger. |
| Nevada | Project by project evaluation. |
| New Hampshire | Life cycle for durability, resiliency not formal. Stream crossing rules require resiliency to be considered in larger culverts. |
| North Carolina | Conveyance improvements. |
| North Dakota | Based on upcoming projects or failures, some districts have routine. |
| Oregon | Request from maintenance for known flooding, scour, failing culverts. |
| Texas | For Bridge class culverts, National Bridge Inspection Standard (NBIS) inspections are used. Otherwise, performance or rehabilitation projects dictate replacement. |
| Virginia | If discovered during new projects that it does not meet capacity requirements. |
| West Virginia | Roadway failure. |
| Wisconsin | Only replaced if anticipated service life will not outlast the expected life of the current pavement replacement or pavement maintenance project. |

Ten DOTs (24%) indicated that their state DOT does not have an asset management system currently in place. A summary of the responses is shown in Figure 19.
Question 8 asked respondents if size or material of DOT culverts affects inspection and maintenance practices. Respondents were given the choice to select one or both size and culvert material, or to select neither. Twenty-six respondents (62%) indicated that culvert size or material affects inspection and maintenance practices, with 19 respondents (45%) indicating that only culvert size affects these practices, and seven respondents (17%) indicating that culvert material also affects these practices. Sixteen respondents (38%) answered that neither size nor culvert material affect inspection and maintenance practices. Figure 20 shows a summary of the responses.
Question 8a was presented to the 16 respondents that answered that size does not affect inspection and maintenance practices. Question 8a asked with what frequency culverts under state DOT jurisdiction are inspected or assessed. Answer options included every year, every 2 years, every 3 years, every 4 years, and every 5 to 10 years, with the option to write in an answer that was not presented. There was not a clear trend in culvert inspection frequency for DOTs that do not factor culvert size into inspection practices, as shown in Figure 21. Of the 16 respondents, seven (44%) wrote in an answer. The write-in responses are shown in Table 2.
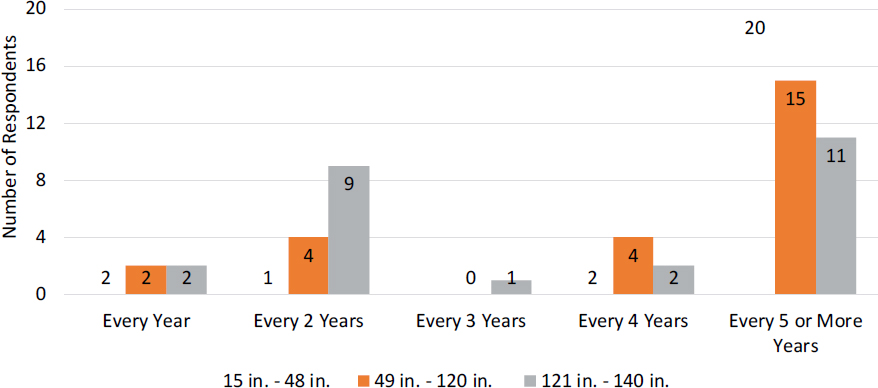
Question 8b was presented to respondents that answered that culvert size does affect inspection and maintenance practices and included respondents that answered both size and material affect inspection and maintenance practices. Question 8b asked with what frequency culverts under state DOT jurisdiction are inspected or assessed based on various culvert sizes. As shown in Figure 22, respondents indicated that culvert inspections typically take place every 5 years or more. The results also show that larger-sized culverts are inspected more frequently than smaller-sized culverts.
The next questions presented lists of culvert maintenance and inspection practices to enhance culvert resilience and allowed respondents to rank them based on level of important or frequency of practice.
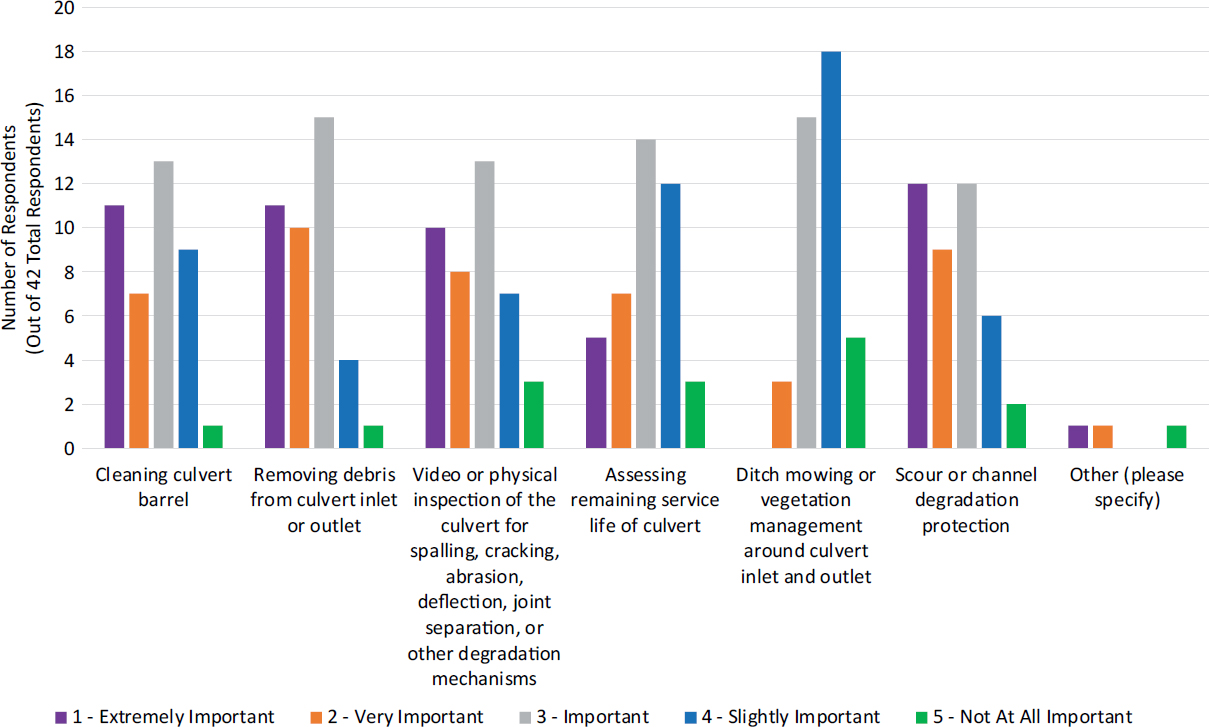
Question 9 asked respondents to rank culvert maintenance and inspection practices with regard to enhancing culvert resiliency. Respondents indicated that scour or channel degradation
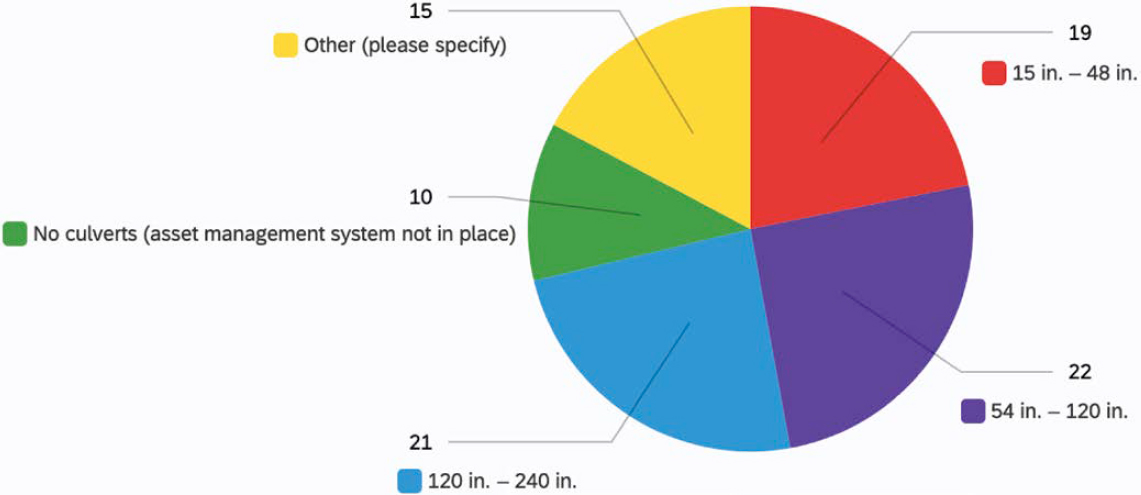
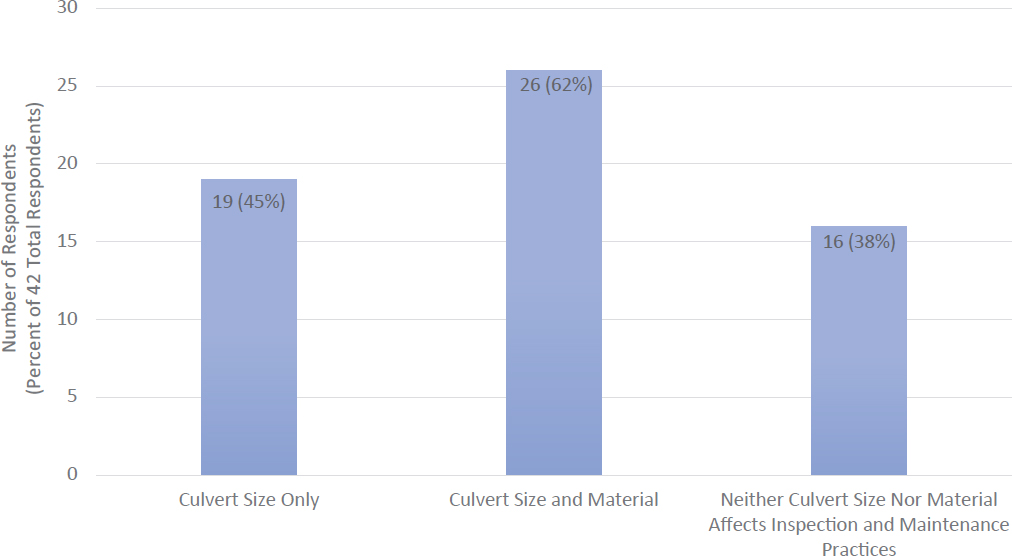
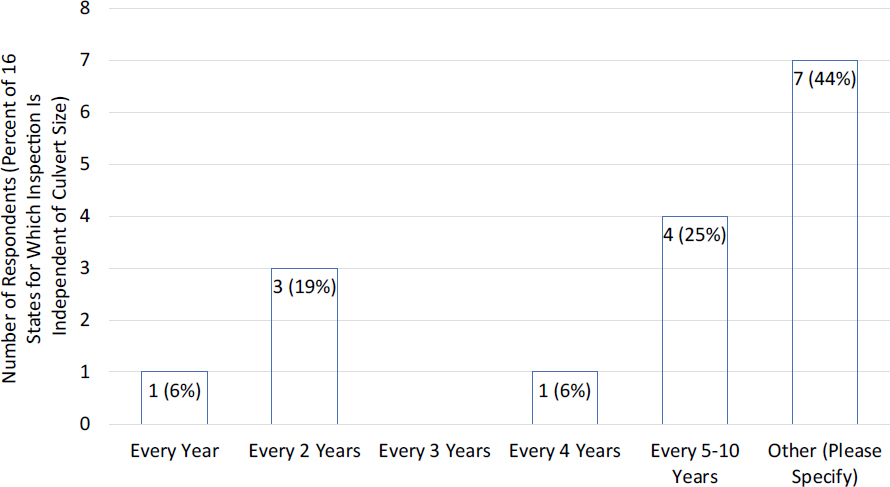
Table 2. Responses to Question 8a: With what frequency are the culverts under state DOT jurisdiction inspected or assessed?
| State | Frequency of Culvert Inspection or Assessment – Other (Please Specify) |
|---|---|
| Alabama | As needed |
| Arizona | Only one-third of the system is evaluated annually under Annual Condition Assessment program based on random sampling approach, so not all culverts are inspected annually. Whichever pipe type (RCP, CMP, etc.) and size (15-in. to 240-in.) is located within the sample segment are inspected as part of the annual assessment. |
| Kentucky | As needed |
| Minnesota | Depends on condition (See TAMS HydInfra Manual) |
| Nebraska | NDOT is currently drafting a culvert inspection manual and recommended inspection periods will be included in the manual. |
| New Mexico | We are just starting this program. Our intention is to inspect culverts every 4 or 5 years. |
protection is extremely important for enhancing the resilience of culverts. Removing debris from the culvert inlet or outlet and cleaning the culvert barrel rank as similarly important maintenance practices. The ranking of culvert maintenance and inspection practices based on importance to state DOTs for enhancing resiliency is shown in Figure 23.
Question 10 asked respondents to rank the same list of culvert maintenance and inspection practices as listed in Question 9 but based on frequency of implementation with regard to enhancing culvert resiliency. Although video or physical inspection of the culvert and assessment of remaining service life ranked as similarly important, respondents indicated that these practices are implemented every 5 years or more or are not practiced at all. Figure 24 shows the implementation frequency of culvert maintenance and management practices for the purpose of enhancing resiliency.
3.4 Failure Mechanisms, Durability, and Practices to Enhance Resiliency
Question 11 asked respondents to rank the most frequently documented failures exhibited by state DOT culverts related to deficiencies in resiliency. The answer options ranged from “most/extremely common” to “not at all common.” The most frequently documented resilience deficiency failures reported by DOTs were debris clogging and premature degradation of the culvert material or system, with 18 DOTs (43%) and 16 DOTs (38%) ranking each of those respective failures as most/extremely common or very common. Erosion of embankment materials (12 DOTs, 29%) and joint separation (13 DOTs, 31%) also ranked as most/extremely common or very common failures related to resilience deficiency. Less common documented failures were flotation and burning of culverts. Thirty-eight DOTs (90%) ranked flotation as not at all common or less common, and 34 DOTs (81%) ranked burning of the culvert as not at all common or less common. Figure 25 shows the frequency of resilience-related culvert failures by failure type, and Figure 26 shows a summary of the average rankings of various failure types among the DOT respondents.
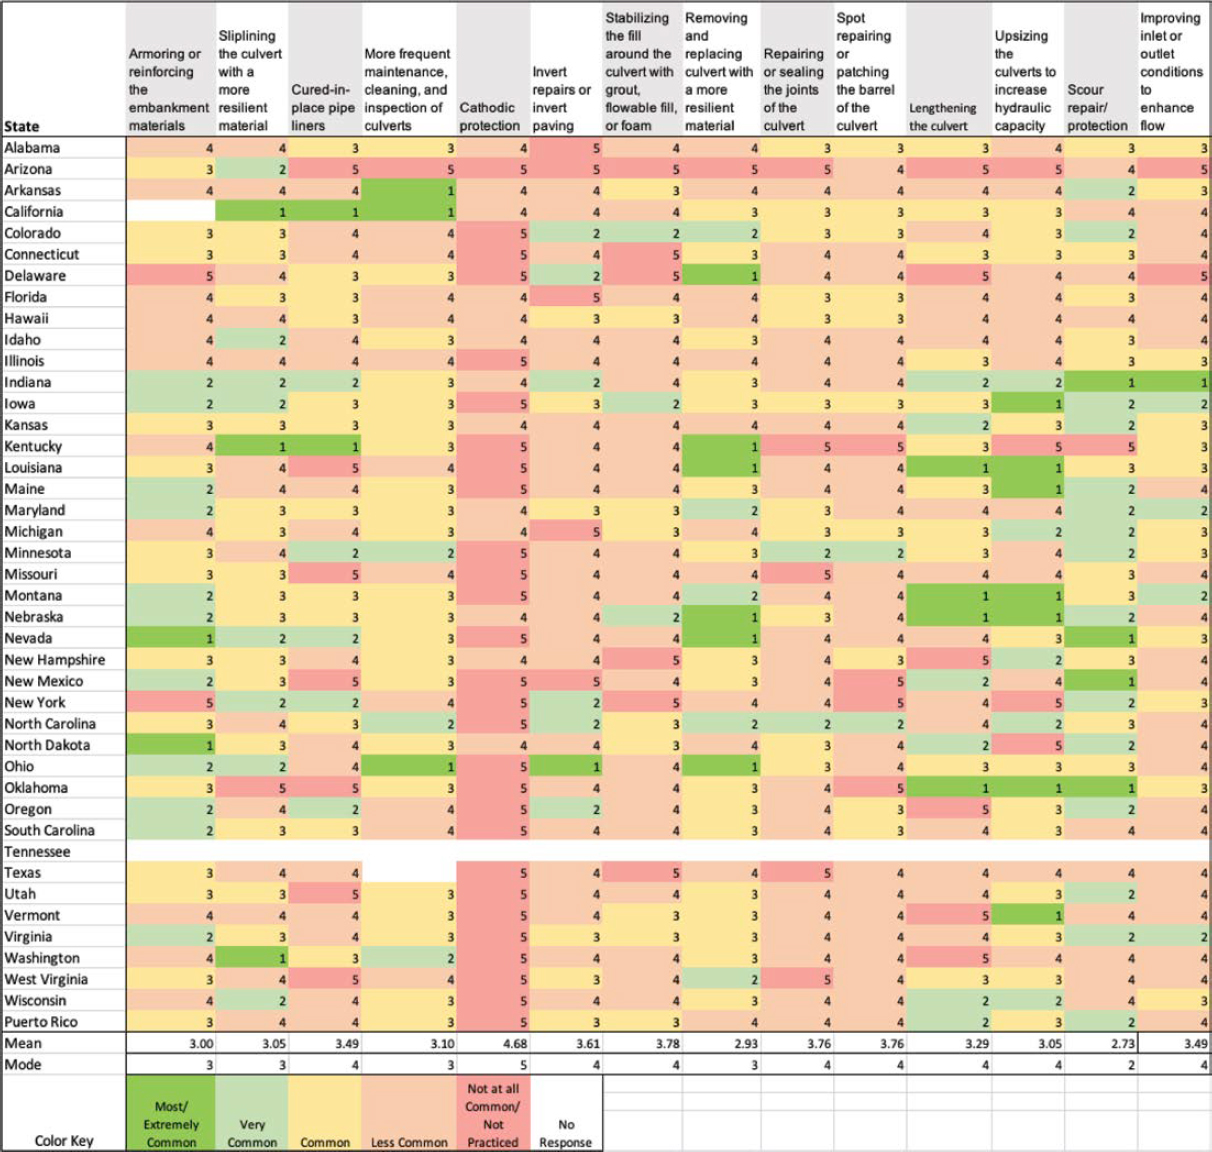
Question 12 asked respondents to rank the frequency of implementation of practices employed by the state DOT to enhance the resiliency of state DOT culverts. The largest number of respondents (22 respondents, 52%) indicated that frequent maintenance, cleaning, and inspection of culverts was commonly practiced. Fifteen respondents (36%) indicated that scour repair and protection was a very commonly employed practice. Respondents agreed that cathodic protection was the least frequently implemented or not at all employed practice to enhance culvert resilience. A summary of responses is shown in Table 3.
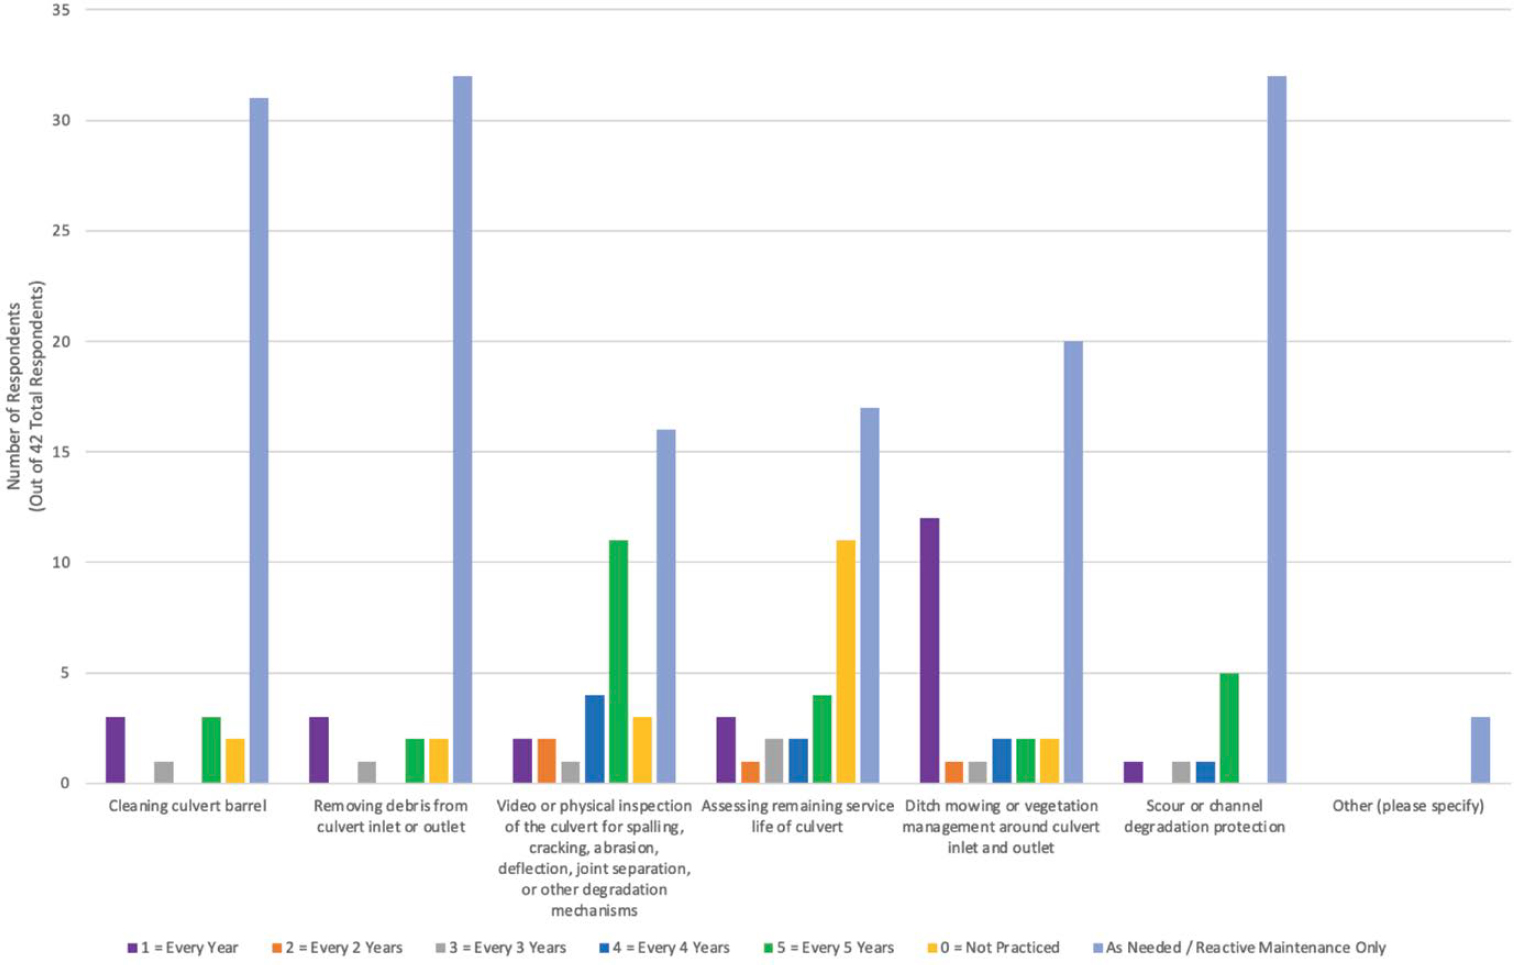
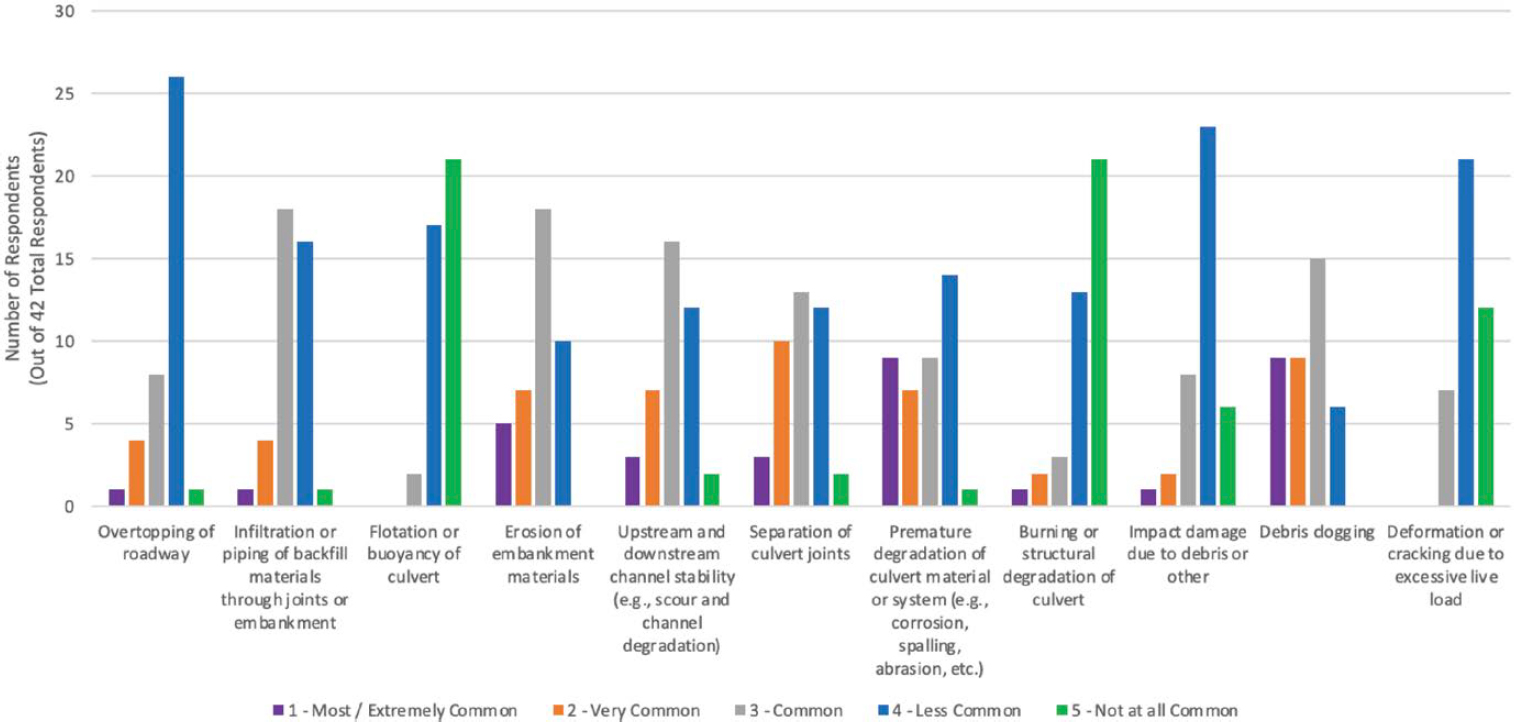

Table 3. Responses to Question 12: Select and rank the following practices employed by the state DOT to enhance the resiliency of state DOT culverts, with 1 being the most common, 2 being the second most common, . . . and 5 being not at all common or not practiced.
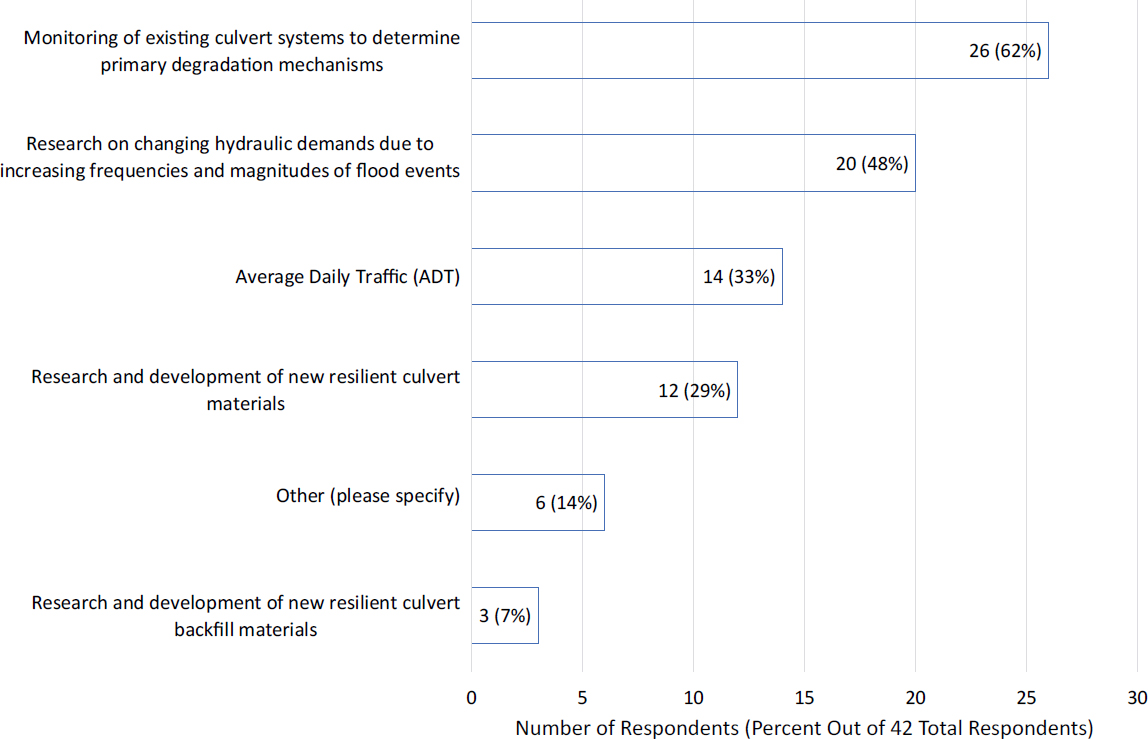
Question 13 allowed respondents to select one or multiple practices employed by their DOT to develop more resilient state DOT culverts. Twenty-six respondents (62%) answered that monitoring of existing culvert systems to determine primary degradation mechanisms is practiced to develop more resilient culverts. Twenty respondents (48%) indicated that their state DOT conducts research on changing hydraulic demands due to increasing frequencies and magnitudes of flood events for the purposes of developing more resilient culverts. Fourteen respondents (33%) answered average daily traffic (ADT) since higher ADT roads have a greater cost of failure due to rerouted traffic. A graphical representation of the responses to Question 13 is shown in Figure 27.
Question 14 asked respondents to select one or multiple practices employed by the state DOT to mitigate piping at the outlets and soil loss through joints due to pressure heads induced by storm-event flooding and inundation. Twenty-seven respondents (64%) answered that their DOT practices sliplining of culverts with a more resilient and watertight material to mitigate piping. Additional practices employed by DOTs include specifying watertight joints (20 DOTs, 48%) and backfill materials less prone to piping and soil loss (20 DOTS, 48%) on new culvert installations or replacements. Figure 28 shows the number of state DOTs that employ each of these practices.
Question 15 asked respondents to estimate the number of state DOT culverts of each shape and material that had been replaced due to lack of resiliency or premature damage over the previous 20 years. Fourteen of the 42 DOT respondents (33%) indicated that this information is unknown

due to lack of data. Fourteen respondents (33%) answered that over 100 circular galvanized corrugated metal culverts had been replaced due to lack of resiliency or premature damage, and seven DOTs (17%) answered that over 100 circular reinforced concrete pipe culverts had been replaced. A summary of the data is shown in Figure 29. The data are plotted in a stacked bar chart format to indicate the distribution of the number of culverts of each material that have been replaced due to lack of resiliency or premature damage. For example, the bottom bar on the chart indicates that seven DOTs responded that they have replaced no circular reinforced concrete culverts due to lack of resilience or premature damage, nine have replaced one to 10 culverts, three have replaced 11 to 50 culverts, two have replaced 51 to 100 culverts, seven have replaced over 100 culverts, and 14 responded that they did not know or the information was not available to them.
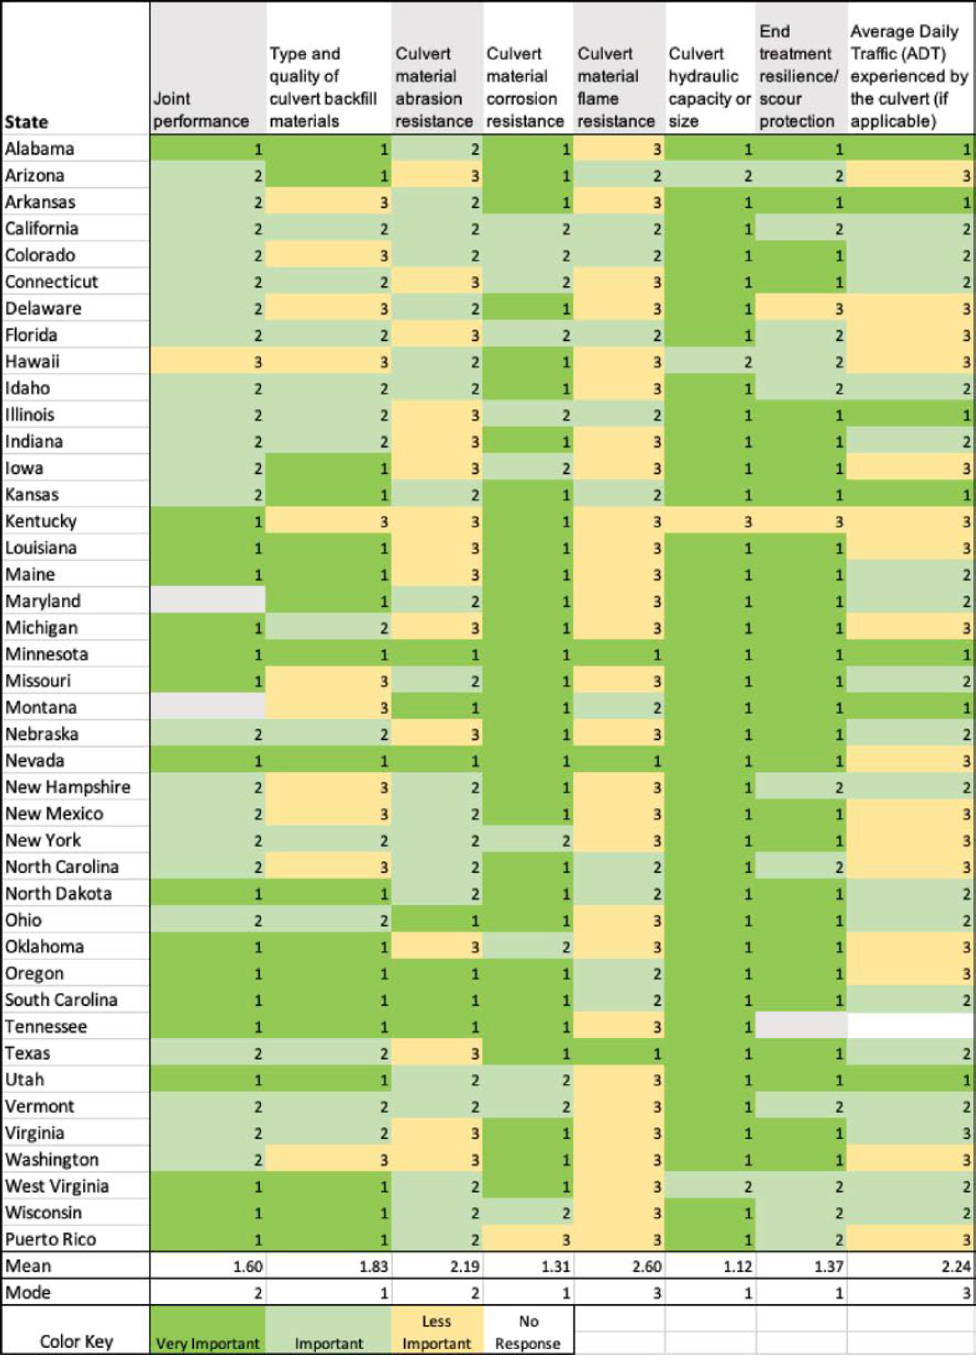
Question 16 asked respondents to rank the importance of specific attributes when replacing state DOT culverts to enhance resiliency. Thirty-eight respondents (90%) indicated that culvert hydraulic capacity or size is very important when replacing culverts to enhance resiliency. Additional important attributes were material corrosion resistance (30 respondents, 71%) and end treatment resilience or scour protection (28 respondents, 67%). The culvert material’s flame resistance ranked as the least important attribute to consider when replacing culverts to enhance resiliency, with 28 DOTs (67%) ranking that attribute as less important. Table 4 shows the importance of specific attributes to state DOTs when replacing culverts to enhance resiliency. The mean and mode for the 42 respondents are also shown in Table 4. The attributes with the lowest mean scores (indicating the most important attributes to enhance resiliency) were culvert hydraulic capacity (1.12), culvert material corrosion resistance (1.31), culvert end treatment resilience/scour protection (1.37), and culvert joint performance (1.60). The least important attributes were culvert material flame resistance (2.60) and average daily traffic (2.24).
3.5 Types of Extreme Weather Events of Concern for Culvert Resilience
Question 17 asked for the state DOT’s level of concern about the performance of culverts during extreme weather events based on likelihood of occurrence. All 42 respondents answered that their state DOTs are concerned about flood events and severe storms, with 34 respondents
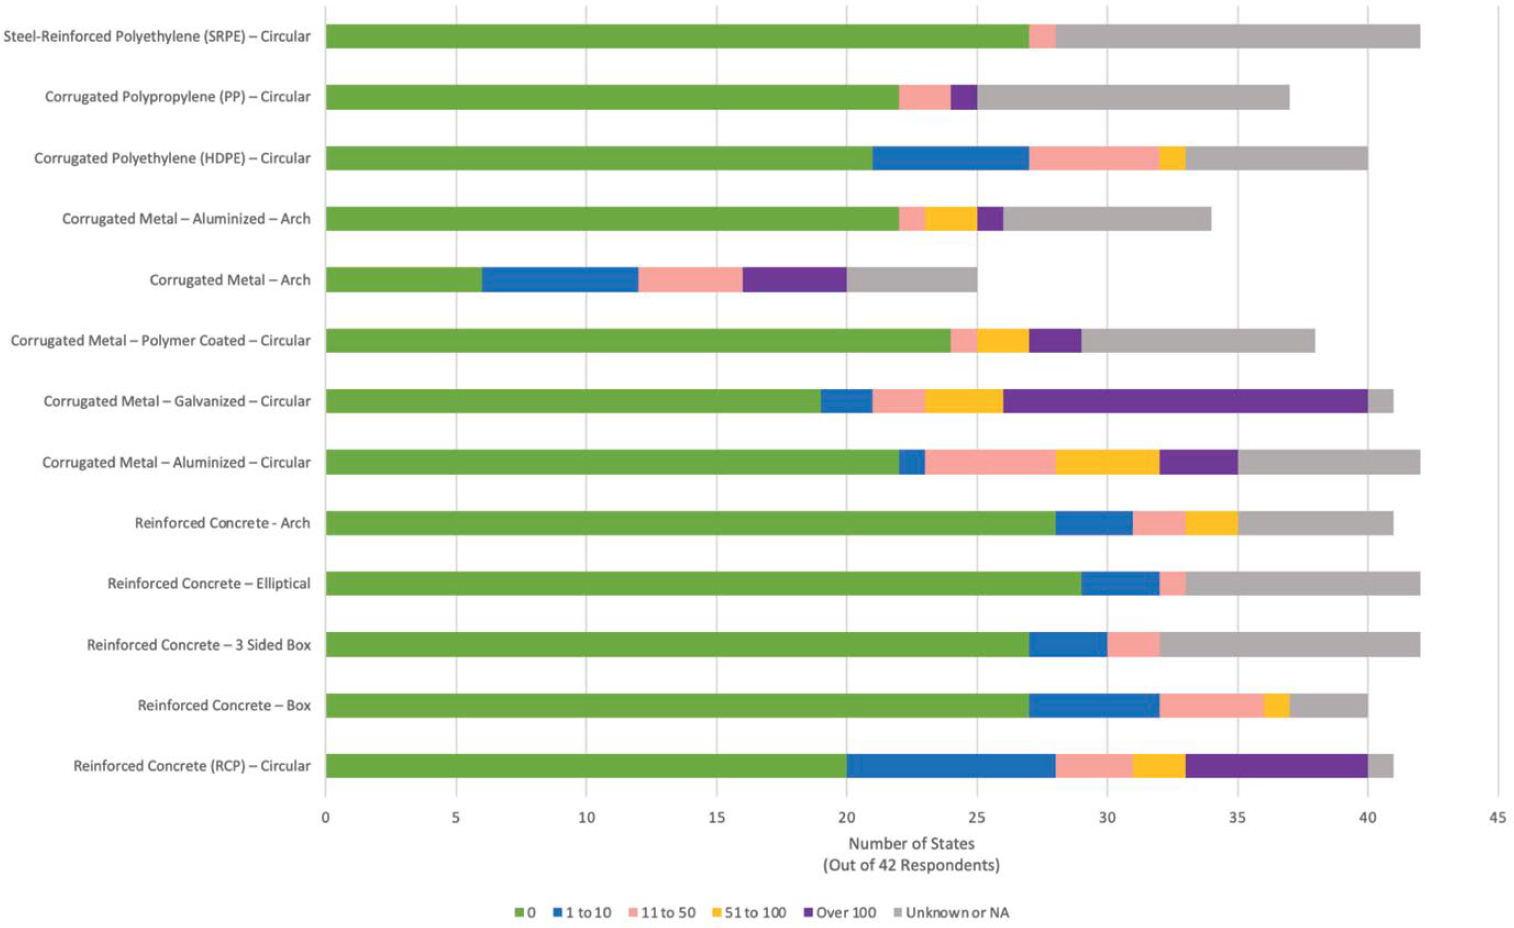
Table 4. Responses to Question 16: When replacing state DOT culverts to enhance resiliency, assign the importance of the following attributes.
(81%) indicating their state DOTs are extremely concerned. Seven coastal DOTs (17%) indicated extreme concern for hurricanes (Virginia, Louisiana, Connecticut, South Carolina, New York, Puerto Rico, and New Hampshire). Six western and southwestern states (14%) indicated extreme concern for wildfires (California, Utah, Arizona, Colorado, Idaho, and New Mexico). The least-concerning extreme weather events were tornados and droughts, with 35 and 34 respondents indicating their state DOTs are not concerned about these events, respectively (81% and 83%).
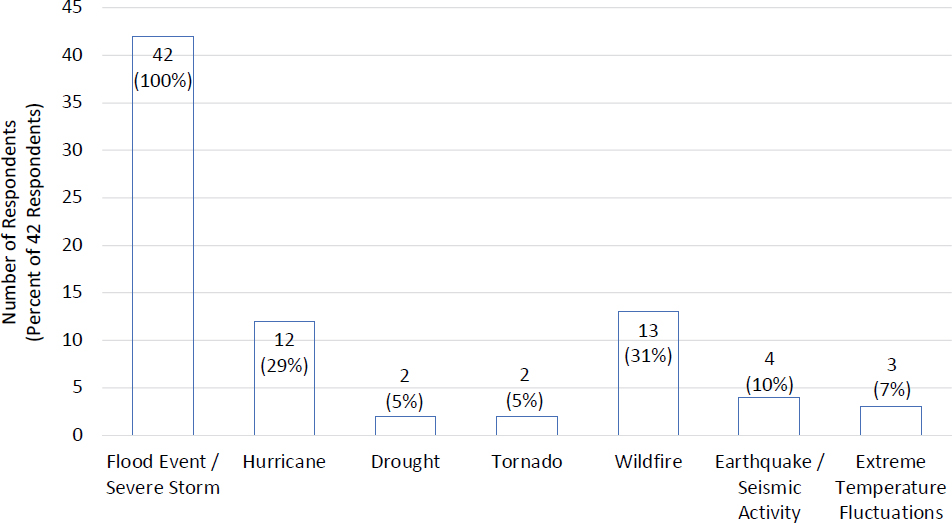
Question 18 asked which extreme weather events have resulted in the repair or replacement of a state DOT culvert. The question gave respondents the option to select one or multiple extreme weather events. All 42 respondents (100%) indicated that a flood event or severe storm had resulted in the repair or replacement of a state DOT culvert. Of the 13 states (31%) that indicated wildfires had resulted in repair or replacement of a culvert, 11 are Pacific or mountain states located in the western half of the United States. All of the states that answered that hurricanes had led to repair or replacement of a culvert are located on a coast. A summary of the responses is shown in Figure 30.
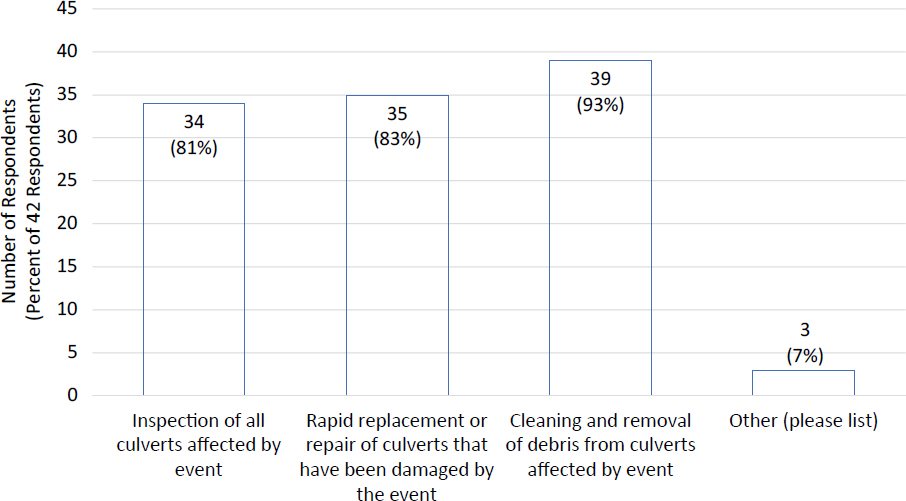
Question 19 inquired about post-event response practices that had been employed by the state DOT to maintain, manage, and resume culvert function and performance. The question gave respondents the option to select one or more post-event responses employed by their state. Thirty-eight DOTs (90%) employ at least two or all three of these practices to maintain, manage, and resume culvert function after an extreme weather event. Figure 31 details the number of state DOTs that engage in these post-event responses.
3.6 Summary of Survey Results
This chapter has presented the results of the survey about state DOT practices to enhance resiliency of roadway and embankment culverts. Forty-two state DOTs completed the survey and shared their current state of the practice. Key findings of the survey are summarized in the following subsections.
3.6.1 Culvert Types and Materials
- Twelve state DOTs (29%) own and maintain 100,000 or more culverts. Eighteen state DOTs (44%) own and maintain between 20,000 and 100,000 culverts. Eleven state DOTs (27%) own and maintain fewer than 20,000 culverts.
- Thirty-six state DOTs (86%) provided information related to the estimated percentage breakdown of culvert materials and shapes in their inventory. Of these, circular reinforced concrete culverts made up approximately 35% of the total reported culvert inventory, and circular galvanized corrugated metal culverts made up approximately 30%.
- Based on the data reported, it was estimated that the state DOTs that responded to the survey maintain and manage a total of around 2.57 ± 0.69 million culverts.
- Of the 41 state DOTs that responded, 37 (90%) have an expected design service life for culverts ranging from 25 to 100 years, and 10 of these DOTs (27%) specify a range to service life depending on the culvert material or the roadway classification under which the culvert is installed.
- Of the 37 that responded, 17 state DOTs (46%) answered that culvert material does affect the expected design service life, while 18 DOTs (49%) indicated that neither culvert material nor soil type affects the expected design service life of culverts.
3.6.2 Life-Cycle Cost and Risk Assessment
- Thirty-two of the 41 state DOTs that responded (78%) do not have a formal risk assessment methodology to evaluate culvert resiliency and durability.
- Twenty-nine state DOTs (69%) implement multiple practices to determine if a culvert should be considered for replacement or rehabilitation. Commonly employed practices include field inspections (38 DOTs, 90%) and routine maintenance (25 DOTs, 60%).
- Seventeen state DOTs (40%) use a risk assessment methodology to aid in making decisions regarding culvert replacement or rehabilitation. Seventeen state DOTs (40%) answered that
- they do not have a formal analysis tool to aid in making decisions regarding culvert replacement or rehabilitation to enhance resiliency.
3.6.3 Maintenance and Management
- Thirty-two state DOTs (76%) have an asset management system in place that inventories a range of different culvert sizes. Ten state DOTs (24%) indicated that certain culvert sizes are inventoried under the bridge division asset management system, although the size thresholds across answers were not consistent. Ten state DOTs (24%) do not have an asset management system for culverts in place.
- Twenty-six state DOTs (62%) answered that culvert size affects inspection and maintenance practices, and seven DOTs (17%) indicated that culvert material affects these practices as well. An example of these practices is more frequent inspection of corrosion-susceptible culverts in coastal areas. Sixteen state DOTs (38%) answered that neither size nor material affect culvert inspection and maintenance.
- Of the state DOTs that indicated size does not affect culvert inspection and maintenance practices, there were no clear or consistent culvert inspection and maintenance frequencies. Of the state DOTs that indicated size does affect culvert inspection and maintenance practices, the survey results indicate that culvert inspections typically take place every 5 years or more, but larger-sized culverts are generally inspected more frequently than smaller-sized culverts.
- Many of the practices the state DOTs ranked as extremely important, very important, and important for enhancing culvert resiliency are implemented every 5 years or more or are not practiced at all. State DOTs answered that most inspection and maintenance practices are employed on an as-needed basis or in a reactive maintenance schedule.
3.6.4 Failure Mechanisms, Durability, and Practices to Enhance Resiliency
- The most frequently documented failures related to deficiencies in resiliency are debris clogging (18 DOTs, 43%), premature degradation of the culvert material or system (16 DOTs, 38%), and joint separation (13 DOTs, 31%). The resilience-related failures reported as not at all common or less common are flotation (38 DOTs, 90%) and burning of the culvert (34 DOTs, 81%).
- Twenty-two state DOTs (52%) indicated that frequent maintenance, cleaning, and inspection of culverts are common practices to enhance culvert resiliency. Of the practices listed, cathodic protection was the least frequently implemented or not at all employed practice to enhance culvert resilience.
- Twenty-six state DOTs (62%) monitor existing culvert systems to determine primary degradation mechanisms, and 20 state DOTs (48%) indicated that they conduct research on changing hydraulic demands due to increasing frequencies and magnitudes of flood events for the purposes of developing more resilient culverts.
- To mitigate piping at the outlets and soil loss through joints, 27 DOTs (64%) reported sliplining culverts with a more resilient and watertight material, 20 DOTs (48%) reported specifying watertight joints on their culverts, and 20 DOTs (48%) reported specifying backfill materials that are less prone to piping and soil loss through joints.
- Fourteen respondents (33%) explicitly noted that the number of resilience-related culvert failures is not tracked by their state DOT.
- Thirty-eight state DOTs (90%) ranked culvert hydraulic capacity or size as a very important attribute to consider when replacing culverts to enhance resiliency, and 30 DOTs (71%) ranked culvert material corrosion resistance as very important. The culvert material’s flame resistance ranked as the least important attribute to consider when replacing culverts to enhance resiliency, with 28 DOTs (67%) ranking that attribute as less important.
3.6.5 Extreme Weather Events
All 42 participating state DOTs (100%) answered that flood events and severe storms have led to the replacement of culverts. Hurricanes and wildfires have also led to culvert replacements, but these events have affected DOTs located along eastern coastlines and in the western half of the United States, respectively.
Thirty-eight state DOTs (90%) employ multiple post-event response practices to maintain, manage, and resume culvert function and performance after extreme weather events. Thirty-nine DOTs (93%) reported cleaning and removal of debris from affected culverts to maintain, manage, and resume culvert function and performance after events.


