A Guide to Applying the Safe System Approach to Transportation Planning, Design, and Operations (2025)
Chapter: 3 Safe System Planning
CHAPTER 3
Safe System Planning
Planning is the process of creating a vision, goals, and proposed actions for a community in the short, medium, and long term. Planning is a critical forum for creating safer transportation systems at the local, regional, state, and federal levels.
Making planning decisions based on Safe System principles would allow future land use and transportation network decisions to actively improve safety for all road users and prevent some of the conflicts that might otherwise need to be mitigated through other measures such as design or enforcement.
Traditional planning in the 20th and early 21st centuries focused on using traffic generation models to predict the future needs of drivers (Lana et al. 2018). These models were typically built on the assumption that vehicle demand would always increase and that municipalities should treat this increase in VMT as though vehicular traffic were water overflowing a network of too-small pipes by building larger pipes (or in this case, roads) (Downs 2000).
This assumption has been used to justify directing immense energy and public funds toward adding extra vehicle capacity into the road network. However, because of the well-established principle of induced demand (Lee, Klein, and Camus 1999; Hymel 2019), this planning approach has led to increased traffic and a vicious cycle of expanding roadways and intersections to serve increasing volumes of vehicles. Increasingly wide roads and fast-moving traffic have come at an enormous financial expense and led to increased crash potential for all road users but especially people walking, rolling, and using transit (Schmitt 2020).
A paradigm shift is needed to embed safety as a primary objective of long-range transportation plans and to program funding for safety-oriented projects in transportation improvement plans. Federal adoption of the Safe System approach is explicitly aimed at changing these processes to embed safety at all levels of the planning process (Evenson et al. 2023).
The Safe System approach, which has roots in Sweden and the Netherlands, prioritizes human health and safety above all other transportation goals and aims to reduce the frequency and severity of collisions through layers of systemic decisions that insulate users from injurious human errors (Tingvall and Haworth 1999). Vision Zero gained popularity in the United States in 2014 when New York City became the first U.S. city to adopt a goal of zero traffic fatalities and serious injuries (City of New York 2014). Since then, nearly 90 U.S. cities have adopted Vision Zero programs (Evenson et al. 2023). There is an immense appetite for this planning shift, as evidenced by the spread of Vision Zero plans across the United States and the increase in safety-focused federal transportation grants, as well as other measurable results. For example, in 2024 Hoboken, New Jersey, celebrated its seventh consecutive year without a single road death (Brey 2024).
3.1 Key Planning Strategies
The most effective method of managing traffic conflicts is to prevent them from occurring in the first place. Safe System planning encompasses a wide variety of approaches for reducing fatalities and serious injury, from reducing the use of transportation modes that tend to increase the frequency and severity of crashes to planning urban areas so that most motor traffic is kept away from the areas where people live, work, and play.
To apply the principles of a Safe System in the context of planning, the following planning strategies can encourage practices that contribute to a Safe System:
- Start from a collective vision for a Safe System.
- Integrate planning vertically and horizontally.
- Clearly define the functionality of roads.
- Separate motor vehicle networks from active transportation networks.
Start from a Collective Vision for a Safe System
A vision-led planning process can effectively guide the way toward fostering a Safe System. Vision-led planning, also called a decide-and-provide approach, identifies transportation system needs and investments based on their alignment with a collective vision for the future. Rather than predicting and accommodating future travel demand, it instead orients investments toward the foundational goals and aims of the community and transportation system itself. The process defines what the future of the system should be and then implements policies and makes choices that can help bring about these intended changes (Lyons et al. 2015; International Transport Forum 2021).
A consequence of a Safe System vision is a general reduction in the public’s dependence on the automobile (Corben, Peiris, and Mishra 2022). It is common practice to evaluate road safety using metrics such as the fatality rate per 100 VMT. While this is a valuable statistic that can facilitate comparisons between infrastructure types, the goal of a Safe System is not merely to reduce the fatalities per vehicle mile, but to reduce fatalities overall. In addition to reducing the fatalities per vehicle mile, it is also helpful to reduce the total number of VMT. To support this strategy, planners support mode shift toward modes with lower fatality and serious injury outcomes such as trains and buses (Ibrahim et al. 2023).
Integrate Planning Vertically and Horizontally
Ensuring vertical integration across regional and local jurisdictions operating at different levels of government helps embed Safe System decision-making along all scales of the U.S. transportation system, from policy to network planning and implementation of street design projects (Tayarani et al. 2018; Bax, Leroy, and Hagenzieker 2014). This coordination could result in something akin to Australia’s and New Zealand’s “Movement and Place” framework (Chiarenza, Sharplin, and McGill 2023), which outlines the types of movement and place-making privileged in designated areas throughout rural and urban transportation networks (Figure 4).
At more local levels of government, horizontal integration requires transportation planners and urban designers to coordinate their site plan reviews, corridor audits, and street standard policies with local land-use planners and coding officials and developers. The horizontal alignment of the transportation and land-use planning disciplines has the potential to harmonize the transportation and land-use systems in ways that vastly improve the safety of road users (Heanue 1998; Combs and McDonald 2021), for example, by systematically rendering roads “self-explaining,” with a clear priority for mobility or access purposes (Dumbaugh, Saha, and

Source: Chiarenza, Sharplin, and McGill 2023.
Merlin 2020; Dumbaugh et al. 2020). This approach to horizontal integration also holds promise to discourage the proliferation of cross-purpose, higher-speed arterial roads, which have been shown to disproportionally impact Black, Indigenous, and Latin pedestrians and cyclists in suburban and urban areas of the United States (Schneider 2020; Barajas 2018; Sanders, Schneider, and Proulx 2022).
Clearly Define the Functionality of Roads
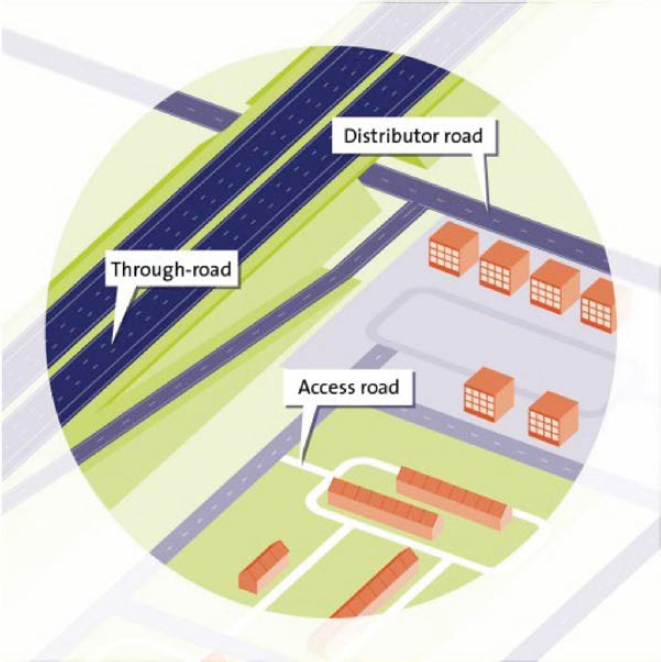
For motor traffic to operate safely at high speeds, separation from conflicting uses such as on-street parking, driveways, frequent cross-streets, and uncontrolled pedestrian crossings must be considered. The most effective method of minimizing conflicting road uses is to separate motor traffic through-routes from areas where people live, work, and play. When planning road networks, this entails concentrating motor traffic onto the streets and areas where it has the least impact on the daily life of residents, and, when planning land uses, development can be directed away from roads that have been designated as through-movement corridors for motor traffic, as depicted in the functional road categories used in the Netherlands (see Figure 5).
In the United States, road classification is a well-established method for defining the purpose of roadways. Per the existing classification, streets fall along a spectrum of local streets, collectors, arterials, and interstates. Local streets are intended solely for local access and nontransportation functions (e.g., playing, gathering). On the other extreme, interstates are intended solely to move motorized vehicles at high speeds, so they do not have access to properties, they are fully grade-separated, and pedestrians are forbidden from using them (Stamatiadis et al. 2018).
In the United States, many streets that serve as destinations also act as arterial roads, carrying large volumes of fast-moving traffic. Yet in a Safe System, major arterial roads would provide little to no access to properties given their designated role of transporting large volumes of motor traffic (McCombs et al. 2024).
Source: SWOV 2023.
Separate Motor Vehicle Networks from Active Transportation Networks
As motor traffic speeds and volumes increase, the level of separation from vulnerable road users should also increase. This can occur within the streetscape in the form of separate infrastructure such as cycle tracks and median islands, but it can be even more effective to separate motor traffic from active transportation at a network level (van Ommeren et al. 2017).
In the Netherlands, this practice is referred to as “unbundling” or “detangling” networks. An example of this strategy is found in the network design of the Dutch town of Houten. Houten’s street network is organized around the principle that trips for people walking, biking, and taking transit should be short and direct, while trips for private vehicles can take longer, more circuitous routes because these users are less sensitive to delay. Although the entire town is accessible by car, the only through-routes for private motor traffic are the ring road around the town and one crosstown connecting road. This means that cycling, walking, and transit are more attractive for most trips than private vehicles, and there are fewer traffic conflicts in the areas where people live, work, and play.
3.2 Study-Identified Planning Practices
Building on planning strategies leads to more specific practices. To identify Safe System–aligned planning practices, the team surveyed public health, planning, and engineering professionals regarding the challenges of Safe System planning. Survey participants were asked to rate the safety impact and the financial, social, and political feasibility of each practice, based on their professional experience and institutional knowledge. Analysis of the responses revealed a
wide range of feasibility scores, and a more modest range of impact scores, which can be found in Appendix B.
The research team identified 10 Safe System–aligned planning practices from the literature review phase of the research and presented them to safety practitioners via an online survey. Survey participants were asked to rate the safety impact and the financial, social, and political feasibility of each practice, based on their professional experience and institutional knowledge. Participants’ responses on the perceived impact and feasibility of the 10 planning practices can be found in Appendix B.
In keeping with Safe System principles and planning strategies, the team determined whether each planning practice would reduce road users’ exposure to severe crash types (e.g., run-off-road, head-on, intersection, pedestrian, bicyclist, or motorcyclist crashes) and the likelihood road users would be involved in one or more of these crash types.
- Exposure reflects the number of people with the potential to be involved in serious crash types.
- Likelihood reflects the probability road users will be involved in a crash.
- Severity reflects the chances a crash will result in a fatality or serious injury to the road users involved.
- Improves injury risk assessment, professional and community coordination, or crash diagnoses reflects a practice’s ability to estimate road-user injury risks associated with land use, policy, or engineering interventions; improve coordination among professionals in different sectors and with the public; or uncover contributing factors to serious crash events.
Table 4 provides example planning practices and their change mechanisms (i.e., the steps or processes responsible for improving road users’ safety).
Implementing Safe System–Aligned Planning Practices
Safe System planning practices center around strategies to start with a collective vision for a Safe System, integrate planning efforts vertically and horizontally, clearly define roads’ functionality, and where possible, separate motor vehicle networks from active transportation networks.
To begin implementing Safe System–aligned planning practices, consider following these steps and substeps:
- Identify at least one significant safety problem. Identification and prioritization of the problem might be based on the following:
- – Severity and magnitude of a safety problem
- – Disproportionate harm that the problem imposes on some community members
- – Stated importance of addressing the safety problem, according to community representatives
- – Availability of resources to address the problem
- Once a safety problem has been identified and prioritized, ask the following two questions:
- –To what extent does the proposed practice align with Safe System–aligned planning strategies?
- Start from a collective vision for a Safe System
- Vertically and horizontally integrate planning
- Clearly define the functionality of roads
- Separate motor vehicle networks from active transportation networks
- – To what extent does the proposed practice address the following?
- Users’ exposure to serious crashes
- Likelihood of serious crashes
- Severity of crashes when they occur
- Improvements to injury risk assessment, professional and community coordination, or crash diagnoses
- –To what extent does the proposed practice align with Safe System–aligned planning strategies?
Table 4. Safe System planning practices.
| Practice | How Safety Is Improved | Exposure | Likelihood | Severity | Improves IRA, PCC, or CD1 | Costs2 |
|---|---|---|---|---|---|---|
| Incorporating road safety audits in project scoping/planning phases | Helps identify safety concerns prior to construction | − | − | − | Low | |
| Prioritizing injury risk-based (systemic) safety assessments over crash “hot spot” or “black spot” approaches | Assists in discerning crash potential before injurious crashes manifest | − | − | − | Low | |
| Prioritizing interventions to reduce severe-injury crashes over property-damage-only crashes | Focuses resources on interventions to reduce the odds of the most impactful crash types occurring | − | − | Low | ||
| Communicating with communities previously not involved in decision-making to learn about their safety issues and concerns on a routine basis (annually, quarterly) | Builds trust with community members and aligns practice with community concerns and values | − | − | − | Medium | |
| Coordinating with land-use planners to align land-use and roadway purposes | Results in greater agreement on roadway access and mobility purposes | − | Low | |||
| Implementing or expanding car-free zones in areas with high pedestrian activity | Protects pedestrians by physically separating them from motor vehicles | − | Medium | |||
| Setting a goal in safety plans to reduce road deaths by a specific amount (e.g., 50%, by 2030) | Sets a policy goal to motivate and drive safety investment | − | − | − | Low | |
| Encouraging and facilitating public use of self-reporting (via mobile app or survey) to capture collisions and other events falling outside the scope of traditional crash reporting (e.g., near misses, pedestrian and bicyclist falls) | Allows for more encompassing data collection of roadway features, characteristics, and conflicts | − | − | − | Medium |
| Practice | How Safety Is Improved | Exposure | Likelihood | Severity | Improves IRA, PCC, or CD1 | Costs2 |
|---|---|---|---|---|---|---|
| Simulating the safety effects of land developments and investments in long-range plans. Not only in the plan but implemented in practice | Applies a safety-oriented lens on redevelopment areas | − | − | − | Medium | |
| Incorporating nontraditional transportation safety data sources as part of problem identification and project prioritization processes | Leads to a broader understanding of safety and need | − | − | − | Medium | |
| Replacing travel forecasting (“predict and provide”) with backcasting (“decide and provide”) | Starts from a vision of safe, desirable travel patterns and works backward to realize the vision | − | − | − | Low |
Note: − = Not applicable.
1 IRA = injury risk assessment, PCC = professional and community coordination, CD = crash diagnoses.
2 Costs correspond to the total financial cost associated with a policy or practice, including labor, equipment, and infrastructure (Low ≤ $100k; Medium = $100k−$1 million; and High ≥ $1 million in total or per year).
For example, in step 1, if a safety team identifies and prioritizes addressing injurious crash potential on the road network, they might pursue prioritizing injury risk-based (systemic) safety assessments over crash “hot spot” or “black spot” approaches given the severity and magnitude of serious crash potential on the network and the disproportionate harm endured by some community members by failing to capture all injurious crashes in police crash data.
Then, in step 2, a safety team might conclude that prioritizing injury risk-based (systemic) safety assessments over hot spot analyses aligns with the Safe System strategy to clearly define the functionality of roads. They might also conclude that injury risk-based (systemic) safety assessments can reduce the likelihood of serious crashes on the network and the severity of crashes that occur.
At this point, a team should reflect on whether a selected safety practice (1) aligns with one or more Safe System design strategies; (2) can significantly reduce the likelihood of users’ exposure to severe crash forces or enhance injury risk assessment, professional and community coordination, or crash diagnoses; and (3) is feasible given available resources to institute the practice. If the team concludes that all three criteria are satisfied, the practice should be considered for implementation, and the safety team could follow the steps outlined in Table 5. However, if one or more of these three criteria are not satisfied, teams are recommended to start over from step 1 until all three criteria are satisfied.
For illustrative purposes, a safety team looks to carry out injury risk-based (systemic) safety assessments across their roadway network. Table 5 provides recommended steps to implement this safety practice along with elements to consider within each step.
Table 5. Planning practice implementation steps and example elements.
| Step | Example Step Elements |
|---|---|
| Determine the practice’s intended goals, the factors that contribute to practice performance and interactions among factors, what key factors might look like in the future, and success indicators. |
|
| Enable innovation of practices to meaningfully respond to foreseen and unforeseen opportunities. |
|
| Monitor indicators of performance in relation to practice objectives, key factor indicators and thresholds for adjusting the practice, and interested party feedback on the practice. |
|
| Improve learning of practice performance to make necessary adjustments to shore up practice performance or to change up the practice altogether. |
|
Conclusion
The shift toward Safe System planning practice is possible and necessary for the United States to realize zero deaths and serious injuries on the nation’s roadways. Planners can work with partners to develop a collective vision for a Safe System. They can integrate their practice vertically with partners operating at different levels of government and horizontally with road designers, land-use planners, coding officials, and developers. Planners can also coordinate with designers to establish a clear and legible priority for mobility or access functions on all roads. Planning is among the first steps toward building and modifying a street network aligned with a Safe System. Chapter 4 addresses Safe System design.


