A Guide to Applying the Safe System Approach to Transportation Planning, Design, and Operations (2025)
Chapter: 5 Safe System Operations and Maintenance
CHAPTER 5
Safe System Operations and Maintenance
Operations and maintenance are key components of advancing and maintaining a Safe System. Effective operations allow the system to adapt to shifting injury risk and safety realities like changing demographics, aging populations, and varying weather or climate patterns. For example, adequately timed signals that are routinely updated and coordinated for the desired travel speeds could be a step toward a Safe System. Additionally, robust asset management and inventory can facilitate safety effectiveness studies and indicate the need for infrastructure maintenance, repair, or replacement to ensure adequate performance of roadway surfaces, signing, pavement markings, barriers, and other features helping to inform drivers and keep vehicles safely on the roadway.
Integrating the Safe System into operations and maintenance complements safer roads by ensuring roadway pavement, signing, markings, and safety devices are in optimal condition for informing and protecting roadway users.
The current practice of evaluating operations and mobility is primarily focused on the efficient movement of motor vehicles, minimizing the vehicle delay incurred by focusing only on LOS (FHWA 2022). Many agencies have maximum thresholds built into their design manuals for allowable vehicular delays and LOS at intersections. However, a focus on improving or maintaining traffic flow can overshadow regard for road users’ safety. Even when road-user safety is considered, improvements that might increase driver delay are often not viewed favorably. To realize a truly Safe System, there is a need to shift the operations paradigm from “balancing safety and mobility of vehicles” to prioritizing safety (i.e., harm minimization) for all users.
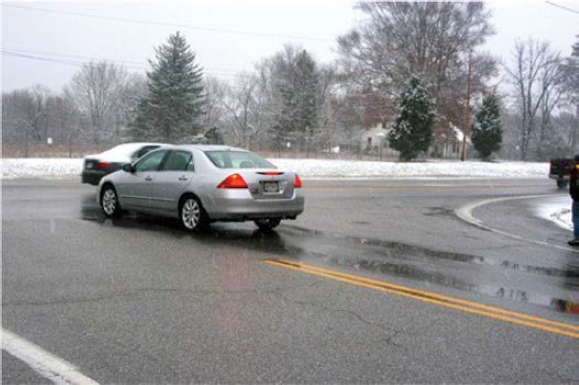
Additionally, safety considerations within maintenance regimes are often limited to work zone schemes and inclement weather issues (Nahed et al. 2023). Moreover, common procedures for maintaining road infrastructure tend to be reactive and organized around responding to user complaints rather than proactively ensuring facilities and their operations are functioning optimally and not compromising road users’ safety. Furthermore, some Safe System infrastructure improvements face opposition because of the maintenance and upkeep required. There are many tradeoffs between maintenance and operations and safety. A part of adopting the Safe System includes understanding and accepting these tradeoffs. To better accommodate operations and maintenance, an agency may develop design standards and maintenance plans for these roadway elements to aid in maintaining the feature. An example includes raised crosswalks. Reasons for opposing raised crosswalks include maintenance concerns related to snow events and adequate drainage, as well as design concerns related to balancing desires to reduce vehicle speeds while avoiding damage to vehicles. FHWA has developed a case study to demonstrate how agencies design raised crosswalks for snow, rain, and heavy vehicles (FHWA n.d). Instead of opposing the installation of raised crosswalks anywhere, an agency can look at this case study, and others, and develop processes of their own for their crews to maintain raised crosswalks.
Operations and maintenance personnel can be proactive in preventing crashes from occurring. Maintaining assets through their useful life and replacing assets as they degrade beyond
repair provides a roadway system for safer travel. Often maintenance and operations personnel travel their roadways more frequently than the average roadway user. Being mindful of the impacts that asset management and traffic operations have on the Safe System, these personnel can make improvements to the system and potentially prevent a crash from occurring. For example, if a maintenance worker notices a sign that has lost its retroreflectivity, the worker may replace it as soon as possible, not waiting for a crash to occur or for the sign to be replaced on its regularly scheduled maintenance cycle. As a result of the new sign, a driver may be adequately informed of the upcoming curve and be able to slow down to safely traverse the curve in dark, rainy conditions.
With a Safe System as the desired state for the transportation system, operations and maintenance activities must be adaptable to changing conditions and protect all road users. Effective operations and maintenance activities can provide a level of redundancy within the roadway network so when a mistake is made, a serious crash does not occur. Examples of such redundancies in the maintenance and operations space include appropriate vehicular and pedestrian clearance intervals at traffic signals, the installation of crash-absorbing roadside barriers, well-maintained drainage structures, and pavement free of potholes and rutting. A proactive approach to operations and maintenance through asset management and inventory can also advance the Safe System.
This paradigm shift in operations and maintenance is necessary and possible. The following sections outline methods, strategies, and practices to employ in advancing toward a Safe System.
5.1 Key Operations and Maintenance Strategies
To apply the principles of a Safe System in the context of operations and maintenance, employ the following strategies:
- Separate road users of different mass, directions, and speeds in time.
- Adapt road operations to changing environmental and social conditions.
- Inventory and manage infrastructure assets to sustain safety-related efficacy.
Separate Road Users of Different Mass, Directions, and Speeds in Time
Safe System–aligned traffic operations allow the separation of road users in time rather than relying on road users to simultaneously share road space. For example, this separation is accomplished by providing pedestrians opportunities to cross the roadways during a designated phase of traffic signals. Per FHWA’s Safe System Roadway Design Hierarchy, managing conflicts in time is a Tier 3 solution within the Safe System Design Hierarchy—i.e., “Manage Conflicts in Time” (Hopwood, Little, and Gaines 2024). Providing discrete and alternating opportunities for users to safely navigate the roadway aligns with the Safety is Proactive principle of a Safe System. Not only a safety strategy, this separation in time also enhances user comfort and convenience, especially for nonmotorized users (Blackburn et al. 2022). Examples of these strategies outlined in FHWA’s design hierarchy include clearance intervals, left-turn signal phasing, coordinated signal timing, leading pedestrian intervals, emergency vehicle preemption, and pedestrian hybrid beacons (Figure 11).
Adapt Road Operations to Changing Environmental and Social Conditions
Two of the many benefits of fostering a Safe System via operations are the immediacy of its effects and the temporary nature of implementation. Practitioners can track and assess environmental

Source: Hopwood, Little, and Gaines 2024.
and social conditions and adapt road operations accordingly. Often these changes, driven by financial, political, health, and other social dynamics, are unpredictable and could impact the performance of traffic operations. Examples of such changes in recent history include lower traffic volumes and higher travel speeds due to the shelter-in-place policies instituted in the early months of the COVID-19 pandemic and the increased use of e-bikes or e-scooters (Buehler and Pucher 2024; NHTSA 2023a). More predictable changes like aging populations or an increase in pedestrian activity due to new development can alter traffic operations safety performance. Regardless of the predictability of the change, practitioners must be mindful of the effects of changes to the traffic operations. Regularly tracking operations performance and adjusting as needed—for example, every three to five years or more often if there are significant changes in traffic volumes, roadway conditions, land uses, travel patterns, vehicle mixes (FHWA 2021b)—is an integral part of fostering and sustaining a Safe System.
Additionally, the capacity to make midstream adjustments is at the heart of quick-build projects. With the urgent need for safety solutions and the introduction of the Safe Streets and Roads for All program, quick-build projects have become more common across the United States (Oluyede, Combs, and Pardo 2024). These projects can be installed roughly within one year of the start of planning and are built with materials that allow changes as needed (People for Bikes 2016). Ideally, quick builds are put in place for testing purposes or until the longer, more permanent solutions can be installed. If these projects are not proactively maintained, the original intent and purpose of the solutions can be lost, which could adversely affect the safety performance of the roadway. Furthermore, an agency might plan to remove a quick-build installation if evaluations and performance measures indicate the project is not effective. Regular performance monitoring should be conducted to measure the effectiveness of the solution and inform any modification necessary to improve performance. Another consideration for these temporary projects is snow and debris removal. For example, if an agency does not have equipment to remove snow within bike lanes, a maintenance plan may be needed before the installation of a separated bike lane. Maintenance considerations should be evaluated at the onset of every quick-build project.
Inventory and Manage Infrastructure Assets to Sustain Safety-Related Efficacy
As assets deteriorate over time, they can lose their safety effectiveness. Practitioners must assess when assets should be restored or replaced to maintain optimal safety performance. Austroads (2010) developed a report on road safety and maintenance that highlighted the implications of asset deterioration as they relate to safety. Some examples from the report include the following:
- Pavement rutting—Crash rates are shown to increase by 25 percent when rut depth exceeds 20 mm (about .75 inches), as shown in Figure 12.
- Drainage—If a water film forms across a road, it can result in partial or total loss of contact between the tire and the road surface, which greatly reduces the ability of the driver to stop and steer the vehicle.
- Pavement markings—The renewal of center-line and edge-line markings has shown a reduction in crash risk by 20 percent.
- Vegetation—Reducing sight distance at intersections increases the crash potential by 33 percent.
Additional studies indicate a crash reduction of 5 to 10 percent when older stop signs were replaced with signs of higher retroreflectivity (Persaud et al. 2008). According to the NHTSA (2023c), only about 25 percent of travel occurs in dark conditions, however, more than 50 percent of all crashes occur under dark conditions. Although the goal is to improve the visibility of signing for nighttime drivers, adequate signage and retroreflectivity benefit all road users in all lighting conditions (FHWA 2012).
One application of managing infrastructure assets is to “stripe it safer” with resurfacing projects. Many agencies maintain a regular or semiregular resurfacing schedule for their roadways. As part of the resurfacing efforts, considerations for safety improvements should be included. Figure 13 illustrates a four- to three-lane roadway reconfiguration—otherwise known as a “road diet” (Albee and Bobitz 2021). This sort of reconfiguration can occur when roadways are restriped during resurfacing. These modifications can also be included in agencies’ resurfacing budgets, thereby avoiding the need to modify curb lines or acquire additional right-of-way. With a 47 percent average crash reduction factor, road diets, and the resurfacing improvements making them possible, can facilitate agencies’ shift toward fostering a Safe System (Persaud et al. 2010).
Source: FHWA 2009.
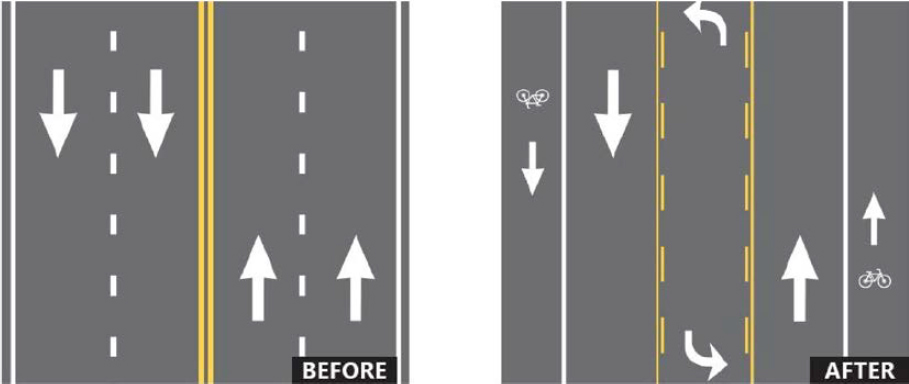
Source: Albee and Bobitz 2021.
Developing and maintaining an inventory and subsequently repairing or replacing degraded assets can help agencies sustain the safety-related efficacy of their roadway assets. Additionally, agencies should create a regularly scheduled inspection and maintenance cycle of the roadway assets to be more proactive in maintaining a Safe System.
5.2 Study-Identified Operations and Maintenance Practices
Stemming from these operations and maintenance strategies are more specific safety practices. To identify Safe System–aligned practices, the team extracted 21 of them from the literature review phase of the research (see Appendix D for a complete list) and presented them to safety practitioners via an online survey. Survey participants were asked to rate the financial, social, and political feasibility of each practice and the safety impact based on their professional experience and institutional knowledge. Analysis of the responses revealed a wide range of feasibility scores and a more modest range of impact scores (see Appendix D).
In keeping with Safe System principles and operations and maintenance strategies, the team determined whether each operations and maintenance practice would reduce road users’ exposure to severe crash types [e.g., run-off-road, head-on, intersection, pedestrian, bicyclist, or motorcyclist crashes (Adapted from Waka Kotahi NZ Transport Agency 2022)] and the likelihood road users would be involved in one or more of these crash types.
- Exposure reflects the number of people with the potential to be involved in serious crash types.
- Likelihood reflects the probability road users will be involved in a crash.
- Severity reflects the chances a crash will result in a fatality or serious injury to the road users involved.
- Improves injury risk assessment, professional and community coordination, or crash diagnoses reflects a practice’s ability to estimate road-user injury risks associated with land-use, policy, or engineering interventions; to improve coordination among professionals in different sectors and with the public; or to uncover contributing factors to serious crash events.
Table 8 provides example operations and maintenance practices and their change mechanisms (i.e., the steps or processes responsible for improving road users’ safety).
Table 8. Safe System operations and maintenance practices.
| Example Practice | How Safety Is Improved | Exposure | Likelihood | Severity | Improves IRA, PCC, or CD1 | Costs2 |
|---|---|---|---|---|---|---|
| Installing leading pedestrian intervals with right-turn-on-red restrictions in areas with high pedestrian activity | Separates pedestrians and right-turning vehicles in time at signalized intersections | − | − | Low | ||
| Removing roadside objects posing a danger when impacted upon a lane departure | Removes the potential for a severe crash if a vehicle runs off the road | − | Medium | |||
| Including crash risk potential in prioritizations of resurfacing schedules (e.g., prioritizing surfaces with low skid resistance for resurfacing) | Proactively minimizes the risks for crashes by improving pavement conditions | − | − | Low | ||
| Providing an exclusive signal phase for pedestrians in areas with high pedestrian volumes (e.g., pedestrian scramble or “Barnes Dance”) | Separates pedestrians and vehicles in time at signalized intersections | − | − | Low | ||
| Developing joint action plans with emergency services partners to integrate operational planning with emergency services planning | Fosters collaboration between agencies and partners to provide adaptable operations to prevent crashes | − | − | − | Low | |
| Integrating asset management and crash analyses to determine when roadway conditions have degraded to the point of increasing the likelihood/severity of crashes | Ensures optimal and effective roadway assets to reduce the likelihood and severity of crashes | − | − | − | Medium | |
| Improving signal progression on designated routes for emergency vehicles with predetermined signal linking plans | Separates slower-moving vehicles (queued traffic) with emergency vehicles at signalized intersections | − | − | − | Low | |
| Providing longer green times for cyclists at shared path crossings | Separates bicyclists and vehicles in time at signalized intersections | − | − | Low | ||
| Employing an active or passive equipment maintenance and replacement system | Maintains optimal and effective equipment | − | − | − | Medium |
| Example Practice | How Safety Is Improved | Exposure | Likelihood | Severity | Improves IRA, PCC, or CD1 | Costs2 |
|---|---|---|---|---|---|---|
| Developing a traffic guidance scheme that details the use of specific traffic control devices (e.g., signs, barriers) during crash events | Uses adaptable traffic operations to prevent secondary crashes from occurring | − | − | − | Medium | |
| Keeping a detailed inventory on the condition of the agencies’ transportation assets (e.g., bridges, tunnels, pavements, signs, signals, sidewalks, street furniture, vegetation) | Routinely evaluates the efficacy of assets which informs the need for replacement or repair to prevent crashes from occurring | − | − | − | Medium | |
| Routinizing network-comprehensive (including bike and sidewalk networks) winter road clearance operations (e.g., snow and ice clearing, salt spreading where applicable) | Ensures roadway assets (especially pavement) are free of hazards and are performing optimally | − | − | − | Medium | |
| Providing extended clearance intervals for passively detected pedestrians at signalized intersections | Separates pedestrians and vehicles in time at signalized intersections | − | − | Low | ||
| Implementing variable speed limits (VSL) on roads with high pedestrian activity at certain times and high potential for significant pedestrian-motor vehicle conflicts (e.g., school zones) | Reduces vehicular speeds in the presence of pedestrians and other vulnerable road users | − | − | Low | ||
| Incorporating roadway features beyond pavement and safety infrastructure (e.g., drainage features, street furniture, vegetation) into asset management programs | Provides a comprehensive database of assets with the potential to adversely affect safety performance (e.g., clogged drainage inlet causing ponding water, overgrown vegetation blocking traffic signals) | − | − | − | Medium |
| Example Practice | How Safety Is Improved | Exposure | Likelihood | Severity | Improves IRA, PCC, or CD1 | Costs2 |
|---|---|---|---|---|---|---|
| Combining passive pedestrian detection and accessible pedestrian signals to help pedestrians with low vision safely traverse intersections | Separates pedestrians, especially those visually impaired, and vehicles in time at signalized intersections | − | − | Medium | ||
| Implementing VSL in the vicinity of traffic incidents | Provides speed harmonization near crash incident scenes and lowers the risk of secondary crashes | − | − | Low | ||
| Extending clearance intervals for passively detected cyclists at signalized intersections | Separates bicyclists and vehicles in time at signalized intersections | − | − | Low | ||
| Implementing Driving Safety Support Systems to avoid sign and signal violations and collisions | Removes reliance on the driver to properly detect and react to signs and signals | − | − | − | High | |
| Implementing VSL during adverse weather conditions | Provides speed harmonization and has the potential to reduce speeds during periods of low visibility or low friction | − | − | Low | ||
| Implementing VSL at nighttime in alcohol-serving districts | Has the potential to lower travel speeds of both impaired and non-impaired drivers which may lessen the severity of a crash should it occur | − | − | Low | ||
| Providing a check list to be used in regular maintenance efforts | When regular maintenance occurs, additional assets may be improved if deemed necessary to maintain a safe roadway network | − | − | − | Low | |
| Coordinating signal timings that promote safe speeds throughout a corridor | Encouraging safer speeds by timing coordinated signals for the desired travel speeds | − | − | Low |
Note: − = Not applicable.
1 IRA = injury risk assessment, PCC = professional and community coordination, CD = crash diagnoses.
2 Costs correspond to the total financial cost associated with a policy or practice, including labor, equipment, and infrastructure (Low ≤ $100k; Medium = $100k−$1 million; and High ≥ $1 million in total or per year).
Implementing Safe System Operations and Maintenance Practices
Safe System operations and maintenance practices center around strategies to separate road users of different mass, directions, and speeds in time; adapt road operations to changing environmental and social conditions; and inventory and manage infrastructure assets to sustain safety-related efficacy.
To begin implementing Safe System–aligned operations and maintenance practices, consider following these steps and substeps:
- Identify at least one significant safety problem. Identification and prioritization of a safety problem might be based on the following:
- – Severity and magnitude of the safety problem
- – Disproportionate harm endured by some community members by the problem
- – Importance of addressing the problem to community representatives
- – Availability of resources to address the problem
- – Opportunities to address safety more generally given routine maintenance schedules
- Once a safety problem has been identified and prioritized, ask the following two questions:
- –To what extent does a proposed practice to address the identified problem align with Safe System strategies for operations and maintenance?
- Separate road users of different mass, directions, and speeds in time
- Adapt road operations to changing environmental and social conditions
- Inventory and manage infrastructure assets to sustain safety-related efficacy
- – To what extent does a proposed practice address the following?
- Users’ exposure to serious crashes
- Likelihood of these types of crashes
- Severity of these types of crashes when they occur
- Improvements to injury risk assessment, professional and community coordination, or crash diagnoses
- –To what extent does a proposed practice to address the identified problem align with Safe System strategies for operations and maintenance?
For example, in step 1, if a safety team identifies and prioritizes reducing severe crashes in the wake of crash events, they might pursue implementing VSL in the vicinity of traffic incidents given the severity and magnitude of this safety problem and the availability of resources to address it.
Then, in step 2, a safety team might conclude VSL aligns with the Safe System strategy of adapting road operations to changing environmental and social conditions, such as serious traffic crashes happening on high-volume roadways in town. A team might also conclude VSL can reduce the likelihood and severity of the secondary crashes occurring near crash sites.
At this point, a team should reflect on whether a selected safety practice (1) aligns with one or more Safe System strategies; (2) can significantly reduce the likelihood of users’ exposure to severe crash forces or enhance injury risk assessment, professional and community coordination, or crash diagnoses; and (3) is feasible given available resources to institute the practice. If the team concludes all three criteria are satisfied, the practice should be considered for implementation, and the safety team could follow the steps outlined in Table 9. However, if one or more of these three criteria are not satisfied, teams are recommended to start over from step 1 until all three criteria are satisfied.
For illustrative purposes, consider the example of a safety team looking to routinely implement VSL near traffic incidents. Table 9 provides recommended steps to implement this safety practice along with elements to consider within each step.
Table 9. Operations and maintenance practice implementation steps and illustrated step elements.
| Step | Illustrated Step Elements |
|---|---|
| Determine the practice’s intended goals, the factors contributing to practice performance and interactions among factors, what key factors might look like in the future, and success indicators. |
|
| Enable innovation of practices to meaningfully respond to foreseen and unforeseen opportunities. |
|
| Monitor indicators of performance in relation to practice objectives, key factor indicators and thresholds for adjusting the practice, and interested party feedback on the practice. |
|
| Improve learning of practice performance to make necessary adjustments to shore up practice performance or to change up the practice altogether. |
|
Conclusion
The shift toward Safe System–aligned operations and maintenance practices is possible and necessary for the United States to realize zero deaths and serious injuries on the nation’s roadways. These practices provide more reliable protection for all road users by separating vulnerable road users from vehicles in time, being adaptable to changing conditions and road-user needs, and ensuring the roadway assets are functioning at optimal safety performance. Assessing the safety performance of the roadway network is central to Safe System–aligned law enforcement strategies and practices, the subject of the Chapter 6.


