Full-Depth Reclamation: Current Practices (2025)
Chapter: Appendix C: Other Agency Survey Responses

APPENDIX C
Other Agency Survey Responses
An additional survey was sent to other agencies as well. This survey was identical to that distributed to the state DOT agencies. The respondents of this survey include the following agencies: Bitume Quebec, New Brunswick Dept. of Transportation and Infrastructure, City of Calgary, City of Ottawa, Alberta Transportation and Economic Corridors, Ministry of Transportation Ontario, Saskatchewan Ministry of Highways, Nova Scotia Public Works, Manitoba Transportation and Infrastructure, Government of Newfoundland and Labrador Transportation and Infrastructure, City of Medicine Hat, University of California Pavement Research Center, Ministère des Transports du Québec, KGS Group, U.S. Forest Service, and Halifax Regional Municipality.

Long Description.
The data is as follows. Both mechanical FDR and FDR, 8. Mechanical FDR only, 5. FDR only, 1. Mechanical FDR or FDR not used, 2.

Long Description.
The data is as follows. Less than 5 years, 0. 5 to 10 years, 1. 10 to 20 years, 6. More than 20 years, 6.

Long Description.
The data is as follows. Less than 50 lane miles, 7. 50 to 100 lane miles, 1. More than 1000 lane miles, 3. Unsure, 2.

Long Description.
The horizontal axis for the number of agencies ranges from 0 to 10 in increments of 2. The vertical axis for average daily traffic lists different categories. The data is as follows. Less than 2,500, 9. 2,500 to 5,000, 6. 5,000 to 10,000, 6. 10,000 to 20,000, 3. 20,000 to 30,000, 3. More than 30,000, 3. Unsure, 2.

Long Description.
The horizontal axis for the number of agencies ranges from 0 to 14 in increments of 2. The vertical axis lists different categories. The data is as follows. Existing primary stresses, 12. Existing pavement structure, 11. Existing ride quality, 7. Existing subgrade type, 5. Initial slash construction cost, 5. Life cycle cost or cost slash benefit, 4. Other, 6.
Possibility of grade raise |
Environmental sustainability |
FDR is considered on a case-to-case basis, not at a network level |
Structural Integrity |
Decision trees in PMS |
Frost susceptibility (frost heave, winter riding quality) |

Long Description.
The horizontal axis for the number of agencies ranges from 0 to 14 in increments of 2. The vertical axis lists different categories. The data is as follows. Fatigue cracking, 12. Potholes, 10. Longitudinal and transverse cracking, 9. Rutting, 9. Base failure, 4. Other, 2.

Long Description.
The data is as follows. Yes, always, 10. Yes, sometimes, 2. No, 1.

Long Description.
The horizontal axis for the number of agencies ranges from 0 to 12 in increments of 2. The vertical axis lists different categories. The data is as follows. Sampling of materials, 10. Evaluation of the thickness of layers, 9. Evaluation of strength or stiffness of layers, 7. Other, 7.
Boreholes, cores |
FWD is conducted on a network level, but not for the purpose of considering FDR treatment |
Project level evaluation of distresses; updated traffic counts (including classification) |
Agency site investigation guide is followed |
Frost heave evaluation |
Investigation done regardless of FDR. GPR is sometimes completed. |

Long Description.
The horizontal axis for the number of agencies ranges from 0 to 8 in increments of 2. The vertical axis lists different categories. The data is as follows. Cement, 7. Foamed asphalt, 6. Emulsified asphalt, 4. Lime or lime kiln dust, 1. Quarry by-products, 1. Calcium chloride, 0. Fly ash, 0. Other, 3.
Gel asphalt |
Choice between FDR-C and FDR-FA is based on material properties (USCS) of the combined recycled material. Emulsified asphalt may be considered in the future. |
Most FDRs in province are completed without additive however some projects have been completed with lime (no mix design). |

Long Description.
The horizontal axis for the number of agencies ranges from 0 to 6 in increments of 1. The vertical axis lists different categories. The data is as follows. Empirical design, 5. Mechanistic-empirical design, 3. No design methodology, fixed pavement cross-section for FDR projects, 2. Other, 3.
Empirical Design with a parallel M-E design if FDR is chosen treatment |
No current design standard in place for FDR |
Shell curves used for pavement design. Recycled material treated as base material. |

Long Description.
The horizontal axis for the number of agencies ranges from 0 to 5 in increments of 1. The vertical axis lists different categories. The data is as follows. Determined project by project, 4. Fixed based on the stabilizing agent used, 1. Fixed across the state, 0. Other, 0.
0.10 to 0.12 |
Level 3 – mix design value |
Depending on existing granular material and depth, consider as subbase (CBR 20) or granular base (CBR 40-80) |
1,500 MPa |
0.12 to 0.14 |
310 MPa |
0.04 to 0.14 (84 to 209 MPa) |
0.1 |
0.25 |
Level 3 – Mix design value |
300 MPa |
0.20 to 0.25 |
3,000 MPa for FDR-FA and 10,000 MPa for FDR-C |
0.09 to 0.31 (136 to 972 MPa) |
0.14 |
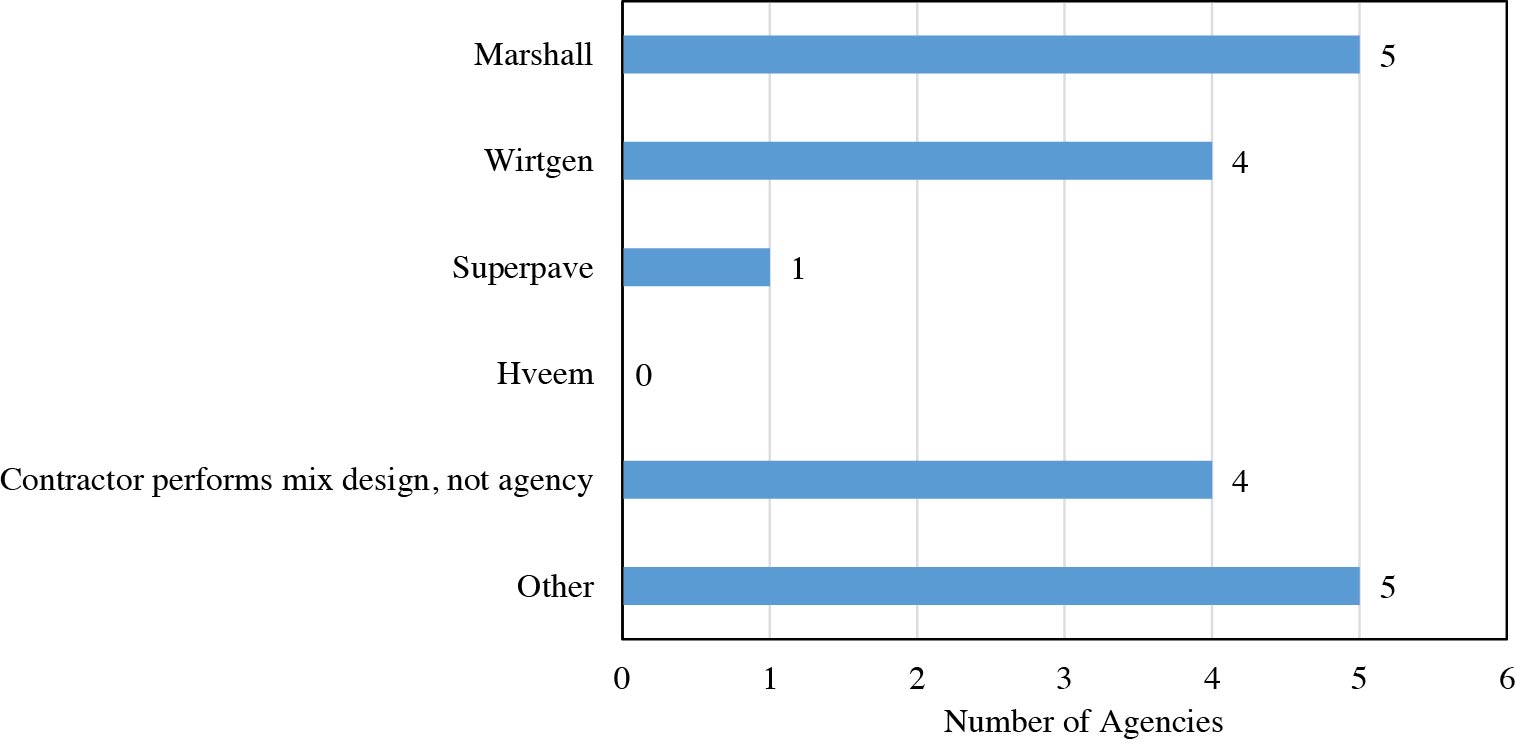
Long Description.
The horizontal axis for the number of agencies ranges from 0 to 6 in increments of 1. The vertical axis lists different categories. The data is as follows. Marshall, 5. Wirtgen, 4. Superpave, 1. Hveem, 0. Contractor performs mix design, not agency, 4. Other, 5.
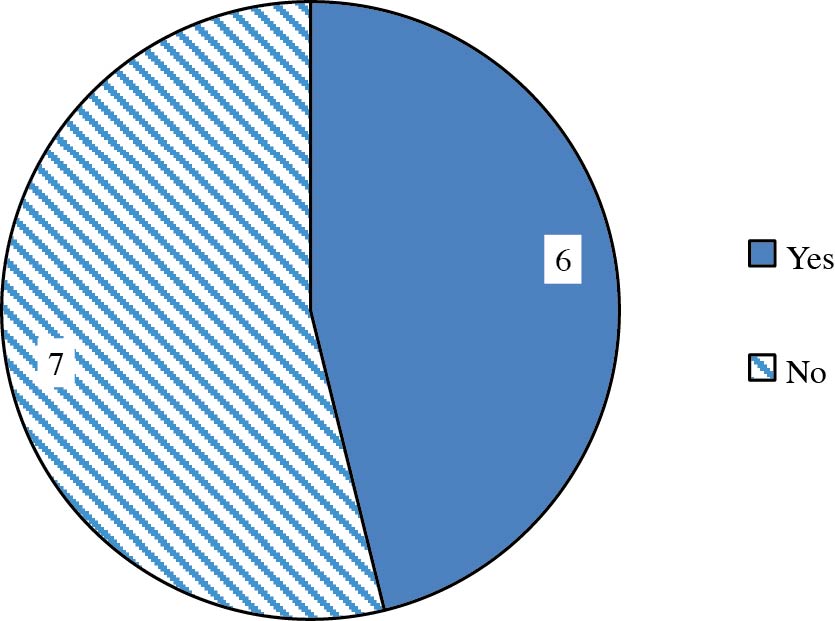
Long Description.
A pie chart shows the data as follows. Yes, 6. No, 7.
Mix Design Formulation. Sample recovery and mix design formulation will be conducted by the Department or its representative. Mix designs will be conducted in accordance with procedures outlined in the latest version of the Wirtgen Cold Recycling Manual. (Division 4 Section 22 - Subsection 6.1 https://novascotia.ca/tran/publications/asphalt/Standard-Specification-Manual-2023.pdf) |
The mix design methods for FDR-FA and FDR-C are both under revision. Please contact me and I can provide details |
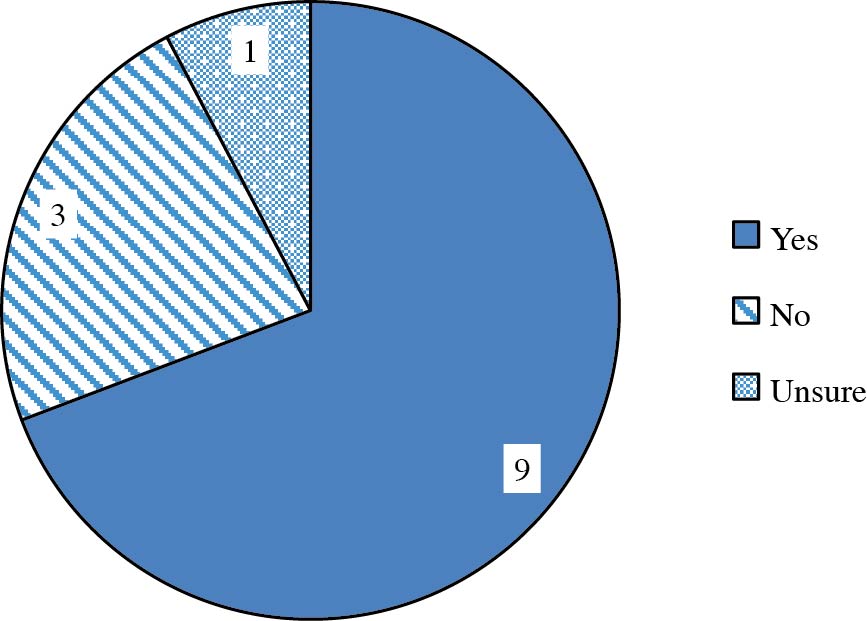
Long Description.
A pie chart shows the data as follows. Yes, 9. No, 3. Unsure, 1.
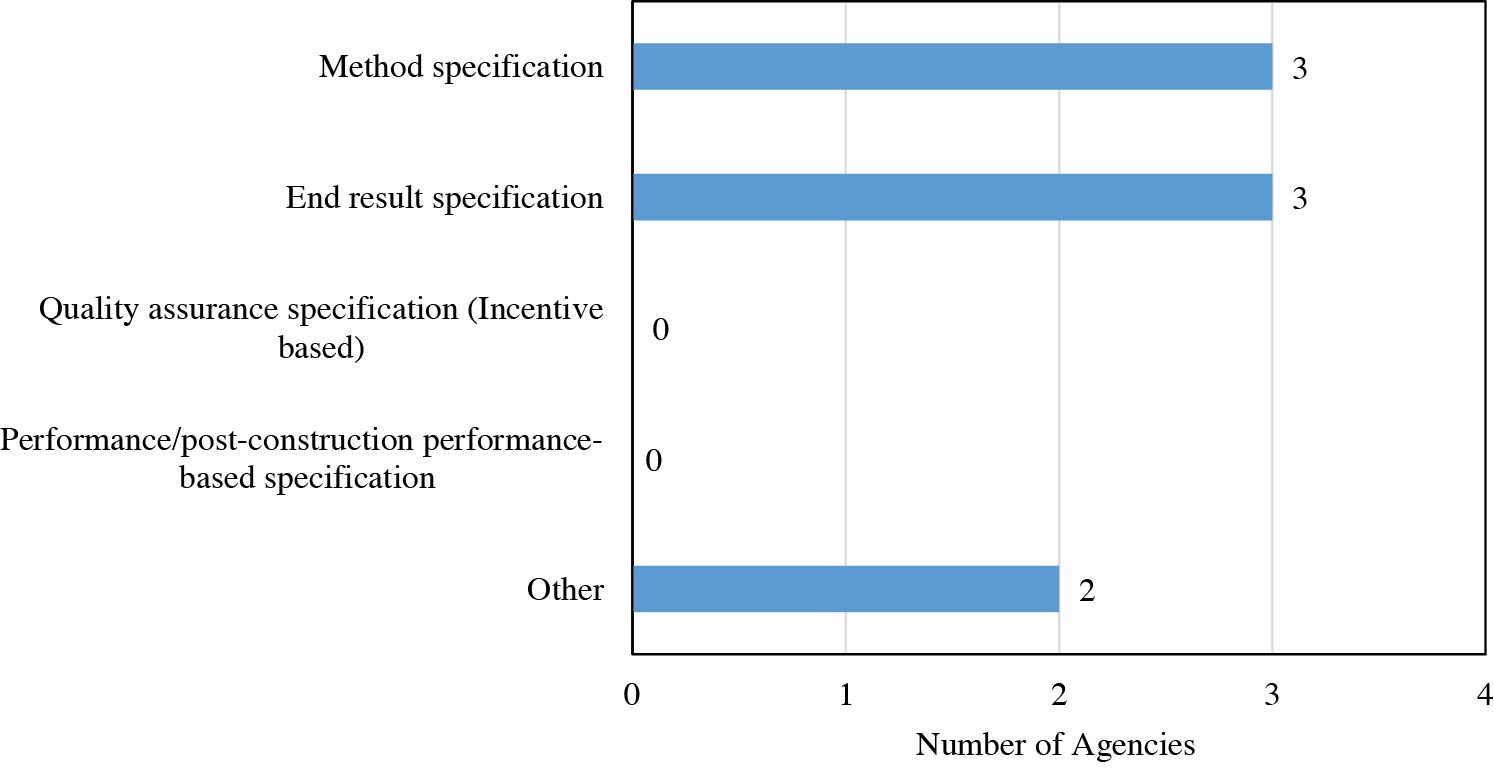
Long Description.
The data is as follows. Method specification, 3. End result specification, 3. Quality assurance specification (incentive-based), 0. Performance slash post-construction performance-based specification, 0. Other, 2.
Both method and end result specs. |
Go to section 370 – Pulverize Existing Asphalt |
The specifications for FDR-FA and FDR-C are both under revision. Please contact me and I can provide details |

Long Description.
The horizontal axis for the number of agencies ranges from 0 to 5 in increments of 1. The vertical axis lists different categories. The data is as follows. Contractor determined based on agency requirement, 4. Agency determined, 2. Contractor determined independently, 0. Unknown, 0. Other, 2.
Agency determined. This is to ensure that recycling agent choice is based on material properties not cost, primarily to avoid shrinkage cracking when FDR-C is used on primarily RAP and AB materials |
Donʼt typically use stabilizing agent but if used, agency determined. |

Long Description.
The horizontal axis for the number of agencies ranges from 0 to 4 in increments of 1. The vertical axis lists different categories. The data is as follows. Mix design results, 3. Historic use or past performance, 2. Traffic level, 0. Availability of material, 0. Life cycle cost analysis, 0. Other, 1.
Local experience and pavement design analysis (stabilizing agent used in no more than 17% of past FDR projects due to curing issues). |
Long Description.
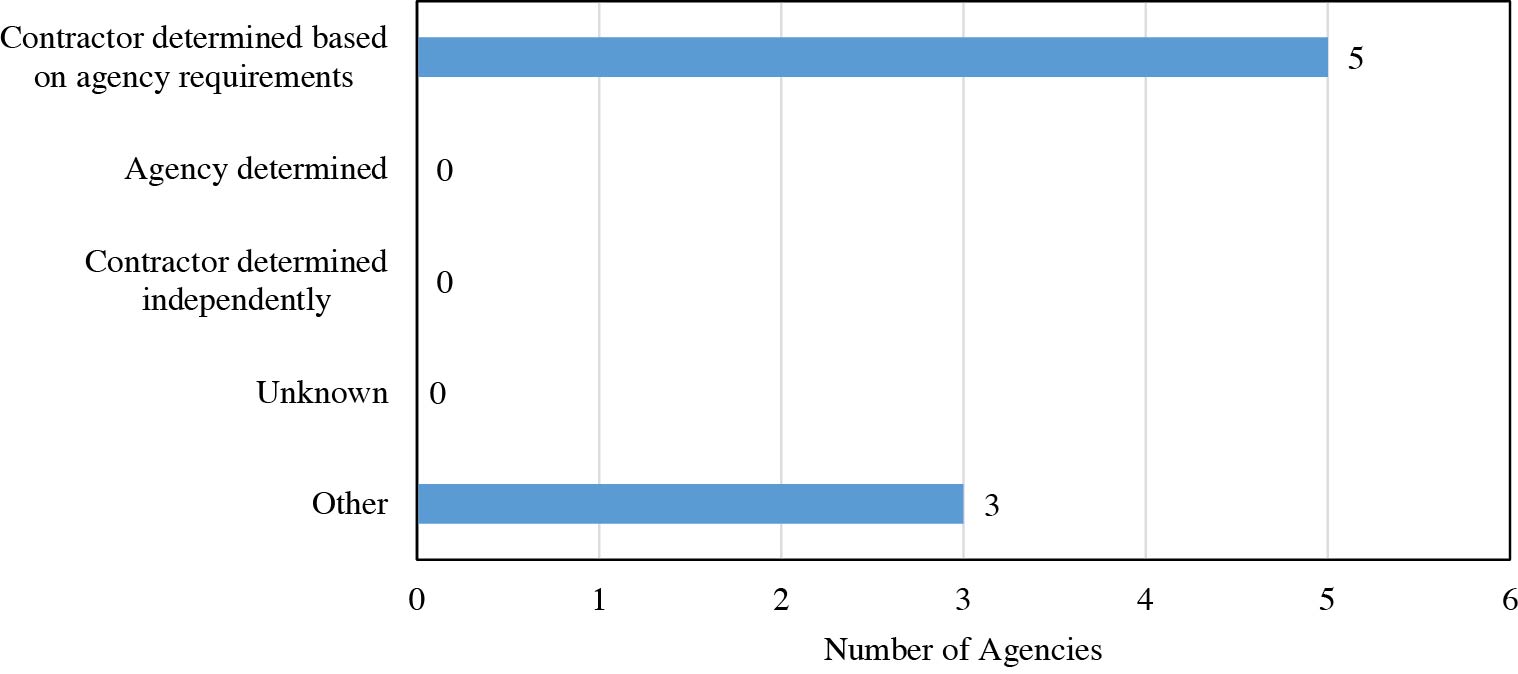
The horizontal axis for the number of agencies ranges from 0 to 6 in increments of 1. The vertical axis lists different categories. The data is as follows. Contractor determined based on agency requirement, 5. Agency determined, 0. Contractor determined independently, 0. Unknown, 0. Other, 3.
FDR only includes pulverization and grading – no additives are applied. |
Bitumen type and dosage depend on mix design testing and cement dosage is agency determined |
Donʼt typically used stabilizer but agency selected if used. |

Long Description.
The data is as follows. Dosage determined by performing a mix design, 5. Fixed dosage based on stabilizing agent type, 1. Other, 2.
3 stabilization types: emulsion (or foamed bitumen) with 0%, 0.8% or 1.5% cement |
No additive for FDR – only Mech. FDR |
Again, stabilizer not really used. |

Long Description.
The horizontal axis for the number of agencies ranges from 0 to 8 in increments of 2. The vertical axis lists different categories. The data is as follows. Contractor Q C and agency inspection or testing, 7. Agency inspection and testing only, 4. Contractor Q C only, 1. No Q A process, 0. Other, 1.
Method Spec. for Mech. FDR – Agency QC/QA and Contractor responsible for own QC |
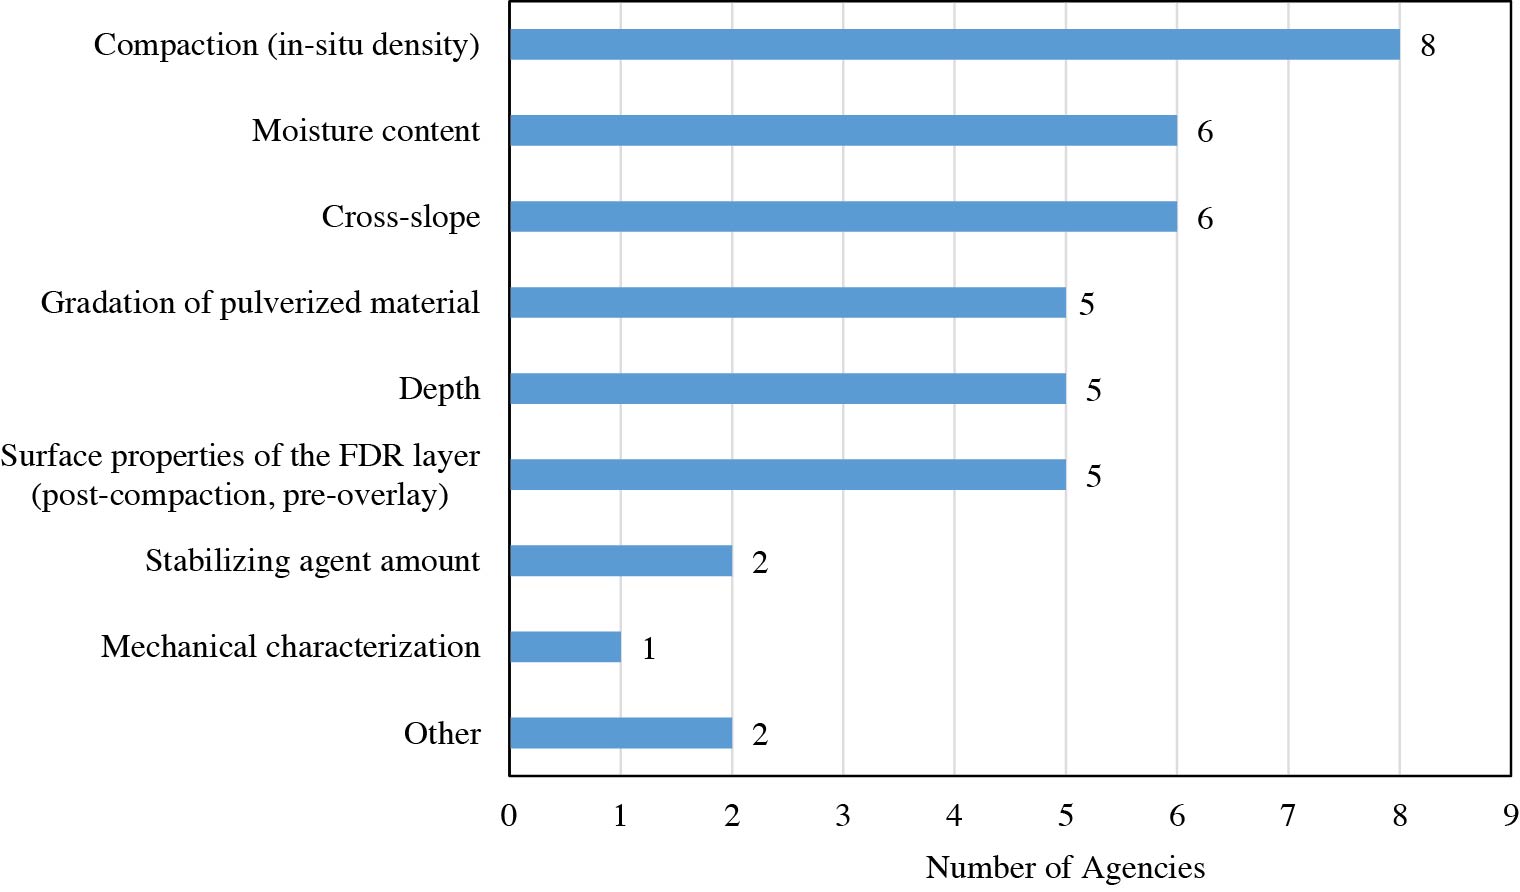
Long Description.
The horizontal axis for the number of agencies ranges from 0 to 9 in increments of 1. The vertical axis lists different categories. The data is as follows. Compaction (in-situ density), 8. Moisture content, 6. Cross-slope, 6. Gradation of pulverized material, 5. Depth, 5. Surface properties of FDR layer (post-compaction, pre-overlay), 5. Stabilizing agent amount, 2. Mechanical characterization, 1. Other, 2.
We preform MTO LS-621 and require the sample to have no more than 50% asphalt coated particles |
Varies between projects |

Long Description.
The horizontal axis for the number of agencies ranges from 0 to 9 in increments of 1. The vertical axis lists different categories. The data is as follows. Compaction, 8. Stabilizing agent amount, 6. Depth, 6. Cross-slope, 6. Moisture content, 5. Surface properties of FDR layer (post-compaction, pre-overlay), 5. Gradation of pulverized material, 4. Mechanical characterization, 2. Other, 0.
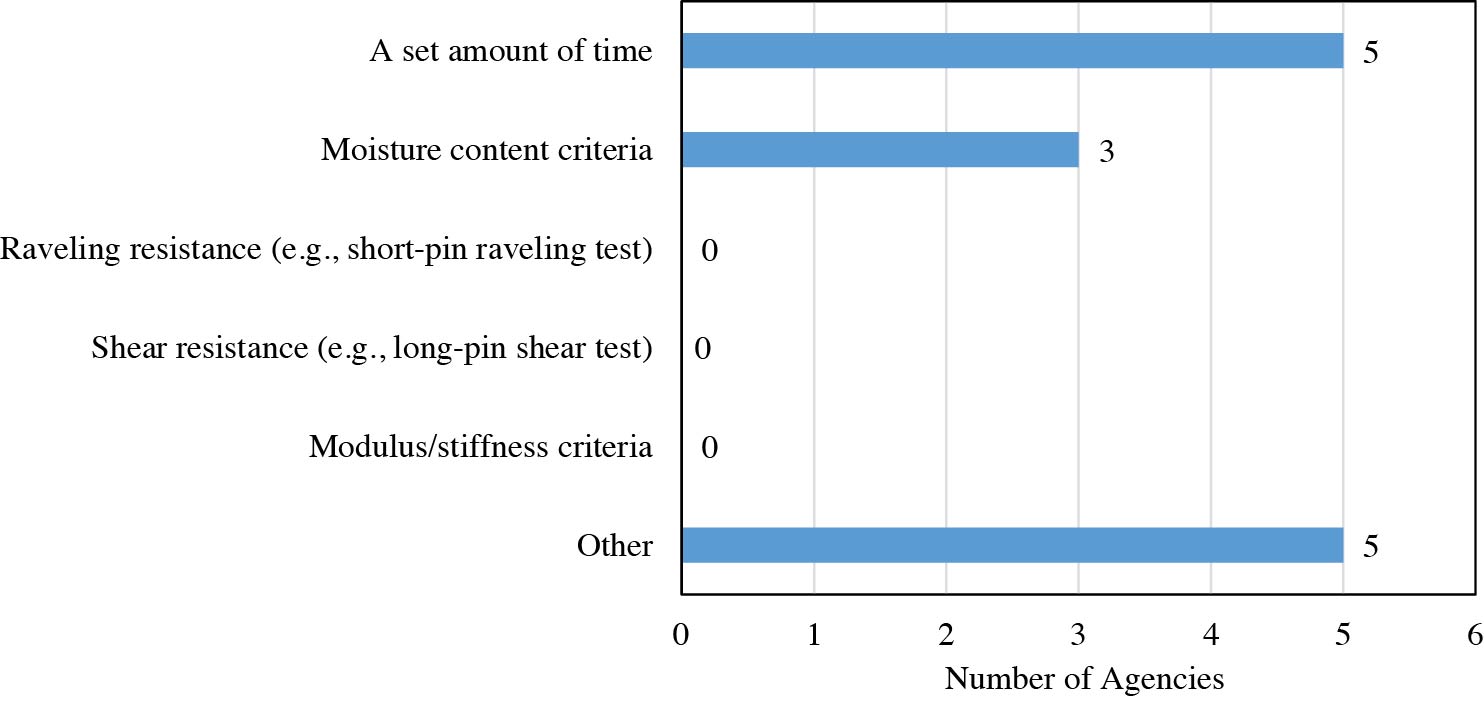
Long Description.
The distribution is with respect to how it is determined when traffic or surfacing placement is allowed on a newly constructed FDR layer. The horizontal axis for the number of agencies ranges from 0 to 6 in increments of 1. The vertical axis lists different categories. The data is as follows. A set amount of time, 5. Moisture content criteria, 3. Raveling resistance (for example, short-pin raveling test), 0. Shear resistance (for example, long-pin shear test), 0. Modulus slash stiffness criteria, 0. Other, 5.
Traffic is allowed after compaction and surfacing is completed as soon as possible or scheduled |
Mechanical FDR only, so traffic allowed immediately after construction of base layer |
Proof roll with loaded tandem in conjunction with evaluation of surface defects and laboratory results |
FDR layer typically must be opened to traffic at end of construction shift. SPRT and LPST currently being investigated for FDR-FA |
Not yet determined |

Long Description.
The horizontal axis for the number of agencies ranges from 0 to 8 in increments of 1. The vertical axis lists different categories. The data is as follows. Evaluation of ride quality, 7. Visual evaluation of distress over time, 6. Non-destructive field testing (such as FWD, et cetera), 4. Testing of field cores, 3. No performance evaluation conducted, 2. Other, 3.
Pavement condition data, including surface distress and roughness data collected on network level. |
FWD on selected projects |
All roads subject to annual automated pavement condition survey. Select FDR projects are part of UCPRC LTPP project which includes FWD, coring, and visual assessment |

Long Description.
A pie chart shows the data as follows. Yes, 4. No, 9.
Chip seal, micro-surfacing, route and seal |
Crack Sealing |
FDR-C specifications require microcracking (method spec) on all projects |
Limitation of portland cement amount (no more than half of the bitumen amount) |
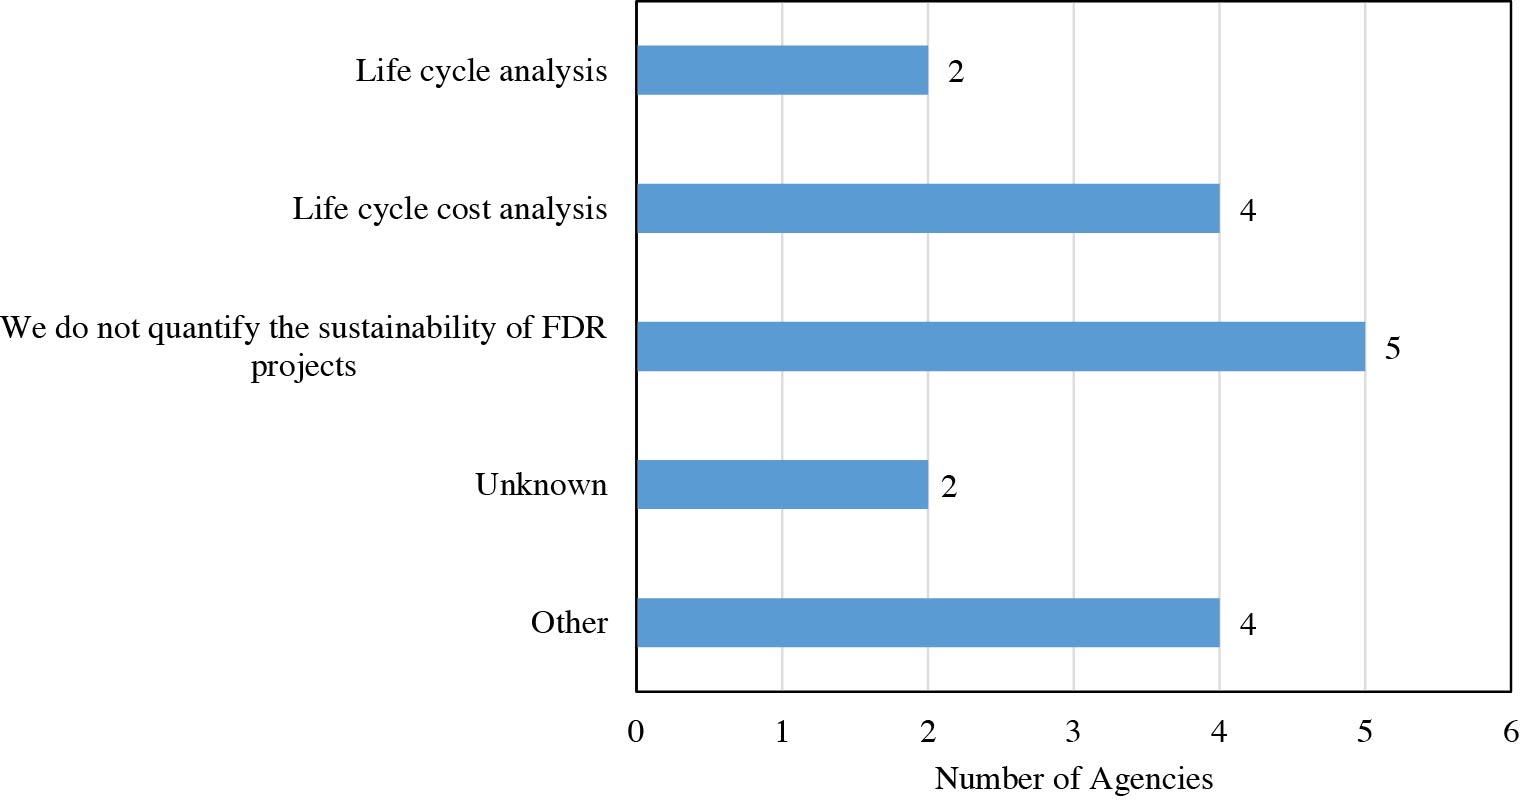
Long Description.
The distribution is with respect to efforts employed (or planned to be employed) to quantify the sustainability of using FDR. The horizontal axis for the number of agencies ranges from 0 to 6 in increments of 1. The vertical axis lists different categories. The data is as follows. Life cycle analysis, 2. Life cycle cost analysis, 4. We do not quantify the sustainability of FDR projects, 5. Unknown, 2. Other, 4.
No immediate plans, but will need to be done sooner than later. |
GreenPave rating assessment |
PaLATE has been used in the past to quantify environmental impacts of PDR and FDR as compared to conventional |
LCCA is in plan |

Long Description.
The horizontal axis for the number of agencies ranges from 0 to 7 in increments of 1. The vertical axis lists different categories. The data is as follows. Lack of agency experience, 6. Lack of contractor expertise, 6. Poor performance of previously constructed FDR, 2. Lack of mix design methods and design procedures, 1. Lack of criteria to determine stabilizing agent dose, 1. Lack of funding for planning or pre-construction, 1. No significant challenges, 3. Other, 6.
Grade raise restriction. |
Introduction of cement as stabilizing agent with asphalt based agents make it more complex in assessing design, construction and long term performance determination |
No challenge for mechanical FDR. Stabilized FDR could not be done because of inconsistency in thickness and base material quality issue. |
Agency decision making process and funding mechanisms are built around mill and overlay and remove and reconstruct strategies. Cold recycling does not always fit these strategies, and/or the full benefits of are not quantified in the analysis. |
Curing of stabilizing agent require favorable climatic conditions. Also, compaction method. |
Limitations due to geometry and utilities |


