Full-Depth Reclamation: Current Practices (2025)
Chapter: 3 Survey on Practices and Guidelines for Use of Full-Depth Reclamation

CHAPTER 3
Survey on Practices and Guidelines for Use of Full-Depth Reclamation
3.1 Introduction
The agency survey on current practices and guidelines for FDR was distributed to state DOTs, the District of Columbia (DC), and Puerto Rico (PR). The survey was completed in early 2024 by 94% (or 49 of 52) of the agencies. In addition to the survey sent to the U.S. DOTs, an identical survey was sent to other agencies that use FDR, and an abbreviated version of the survey was distributed to FDR contractors who work with DOTs. The survey questions are provided in Appendix A, while Appendix B presents the individual survey responses. Appendix C presents the survey results from agencies and contractors other than state DOTs. The survey responses from state DOTs are summarized and presented in the next sections.
3.2 State of the Practice
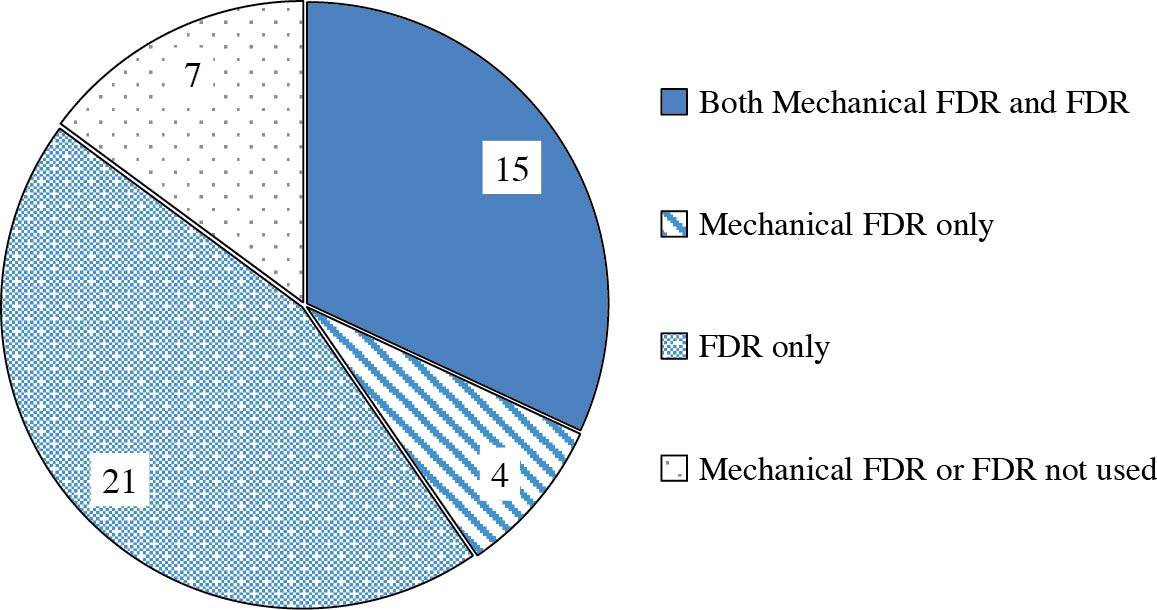
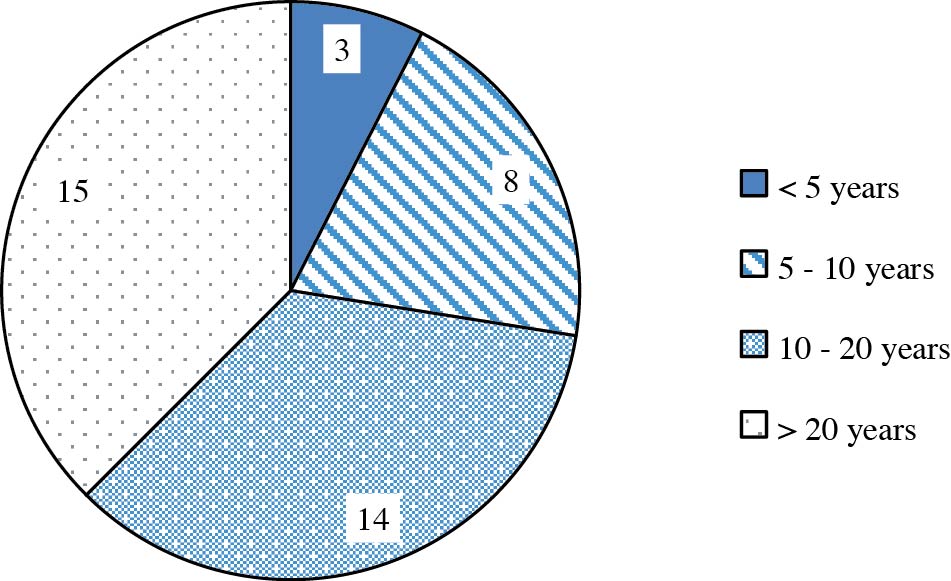
Of the 47 DOTs responding to this question, 85% (or 40 of 47) reported that their agency has employed FDR or mechanical FDR within the past 5 years, as shown in Figure 18. The term n refers to the sample size; the term n = x in the figure captions refers to the total number (x) of responses (i.e., the basis of the percentages shown in the figures in Chapter 3). The term Q refers to the survey question number; the term QX in the figure captions refers to the survey question number (x) that the reporting information was gathered from, as found in Appendix A of this report. Of those 40 DOTs, 8% (or 3 of 40) reported having less than 5 years of experience, 20% (or 8 of 40) reported having 5 to 10 years of experience, 35% (or 14 of 40) reported having 10 to 20 years of experience, and 38% (or 15 of 40) reported having greater than 20 years of experience with FDR, as shown in Figure 19.
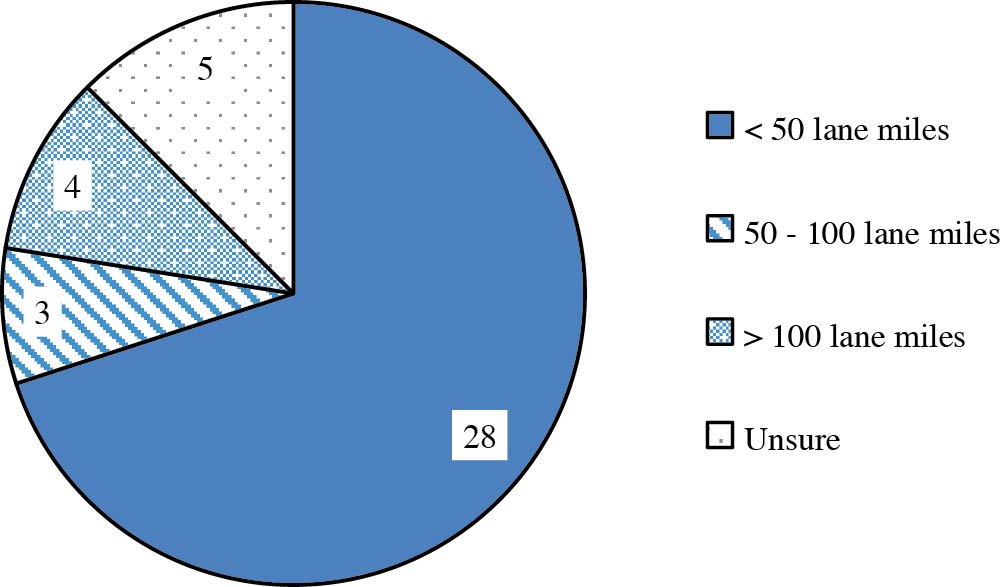
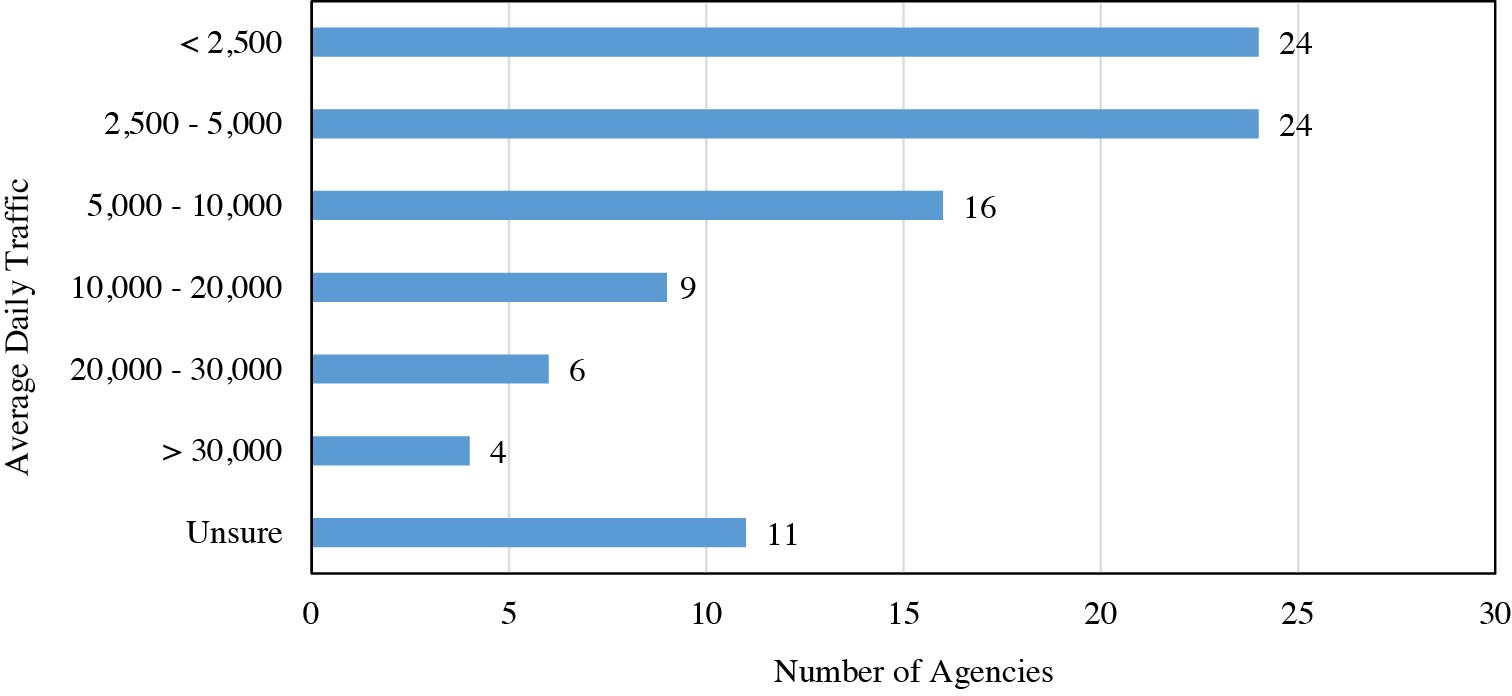
Figure 20 shows the distribution of the number of lane-miles of FDR that agencies reported are performed each year. Of the 40 agencies that do employ FDR, 70% (or 28 of 40) reported performing FDR on less than 50 lane-miles per year, 8% (or 3 of 40) reported performing FDR on 50 to 100 lane-miles per year, and 10% (or 4 of 40) reported performing FDR on greater than 100 lane-miles per year. Five of the responding agencies reported that they were unsure of the number of lane-miles rehabilitated using FDR per year. Figure 21 shows the distribution of average daily traffic (ADT) levels on the roadways where agencies conduct FDR. FDR is predominantly conducted on roadways with ADT of less than 10,000.
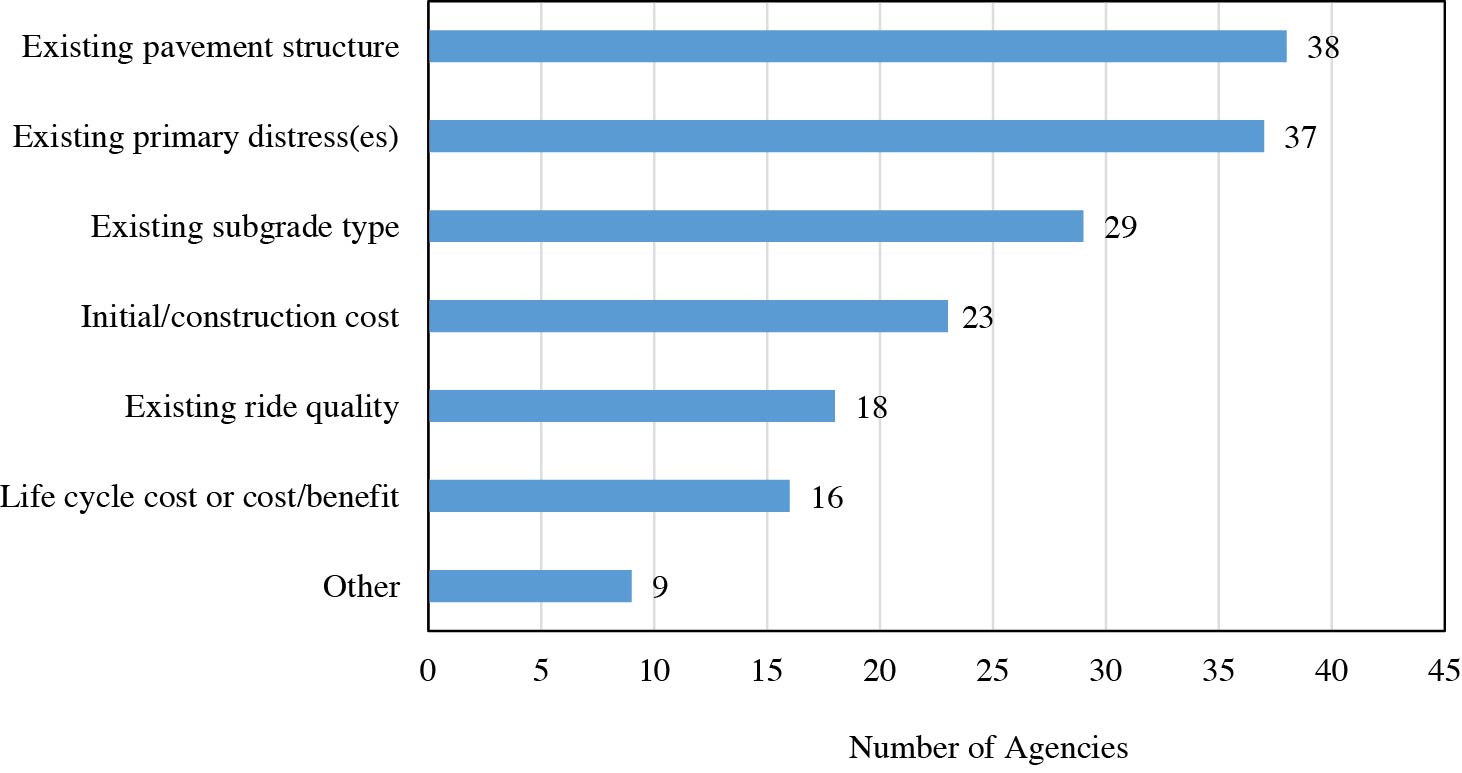
Agencies consider multiple factors when determining when to conduct FDR, as shown in Figure 22. (Note that the percentages do not add up to 100% as agencies were allowed to select multiple responses for this and subsequent questions.) For the agencies that conduct FDR, the most common factors considered are the structure of the existing pavement (95%, or 38 of 40) and the primary distress in the existing pavement (93%, or 37 of 40). Additional factors considered by many agencies include the existing subgrade type, the initial and construction costs of
Long Description.
The data is as follows. Both mechanical FDR and FDR, 15. Mechanical FDR only, 4. FDR only, 21. Mechanical FDR or FDR not used, 7.
Long Description.
The data is as follows. Less than 5 years, 3. 5 to 10 years, 8. 10 to 20 years, 14. More than 20 years, 15.
Long Description.
The data is as follows. Less than 50 lane miles, 28. 50 to 100 lane miles, 3. More than 100 lane miles, 4. Unsure, 5.
Long Description.
The horizontal axis for the number of agencies ranges from 0 to 30 in increments of 5. The vertical axis for average daily traffic lists different categories. The data is as follows. Less than 2,500, 24. 2,500 to 5,000, 24. 5,000 to 10,000, 16. 10,000 to 20,000, 9. 20,000 to 30,000, 6. More than 30,000, 4. Unsure, 11.
FDR, the ride quality of the existing pavement, and the life cycle costs of conducting FDR. Some of the responding agencies indicated other factors that they consider when deciding to conduct FDR, as displayed in Table 8.
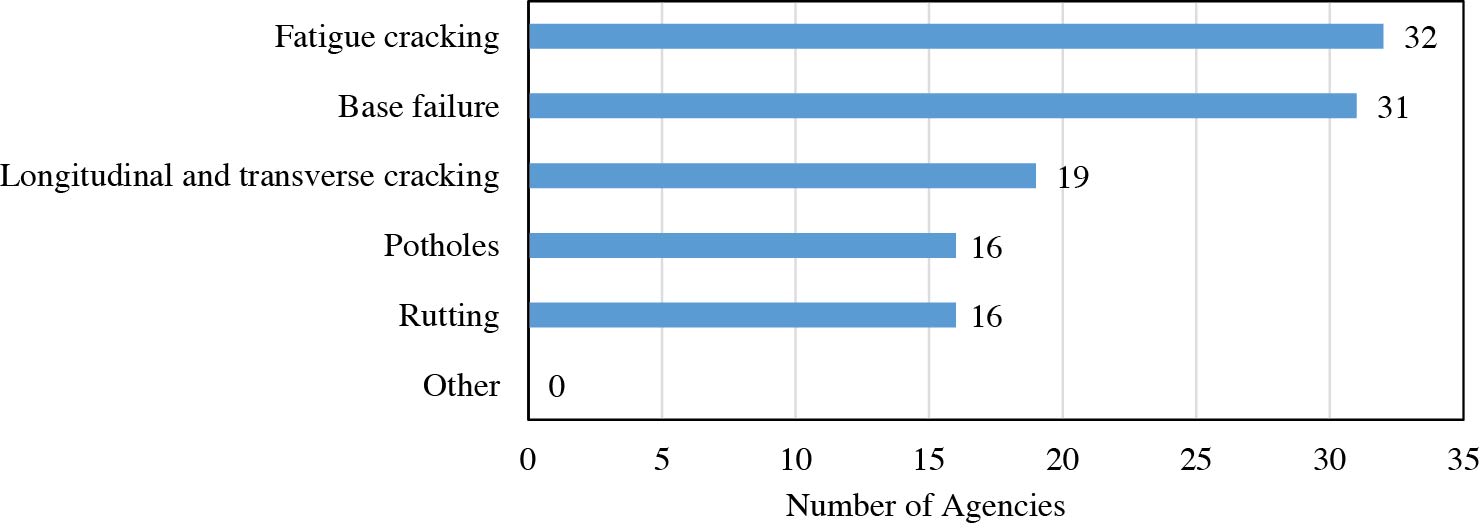
As noted previously, the existing pavement distress is one of the primary factors considered by agencies when determining whether to implement FDR. Figure 23 displays the distribution of agencies with respect to the most common distresses addressed by using FDR. The most common distresses addressed with FDR are fatigue cracking (86%, or 32 of 37) and base failure (84%, or 31 of 37), indicating that agencies primarily consider FDR for deep structural issues. FDR is also reported to be used to address other distresses, such as longitudinal and transverse cracking, potholes, and rutting.
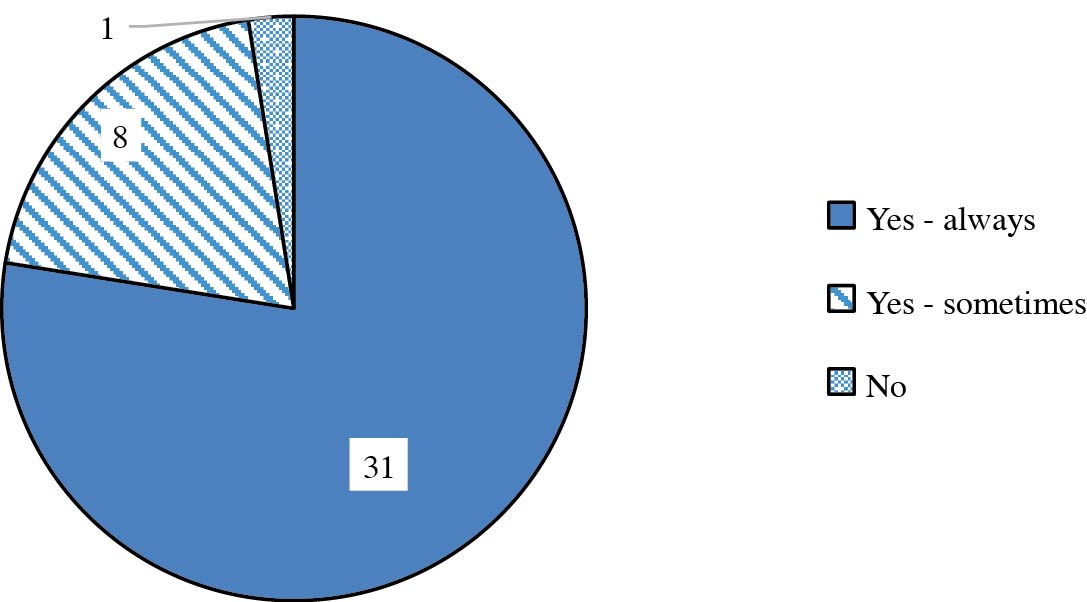
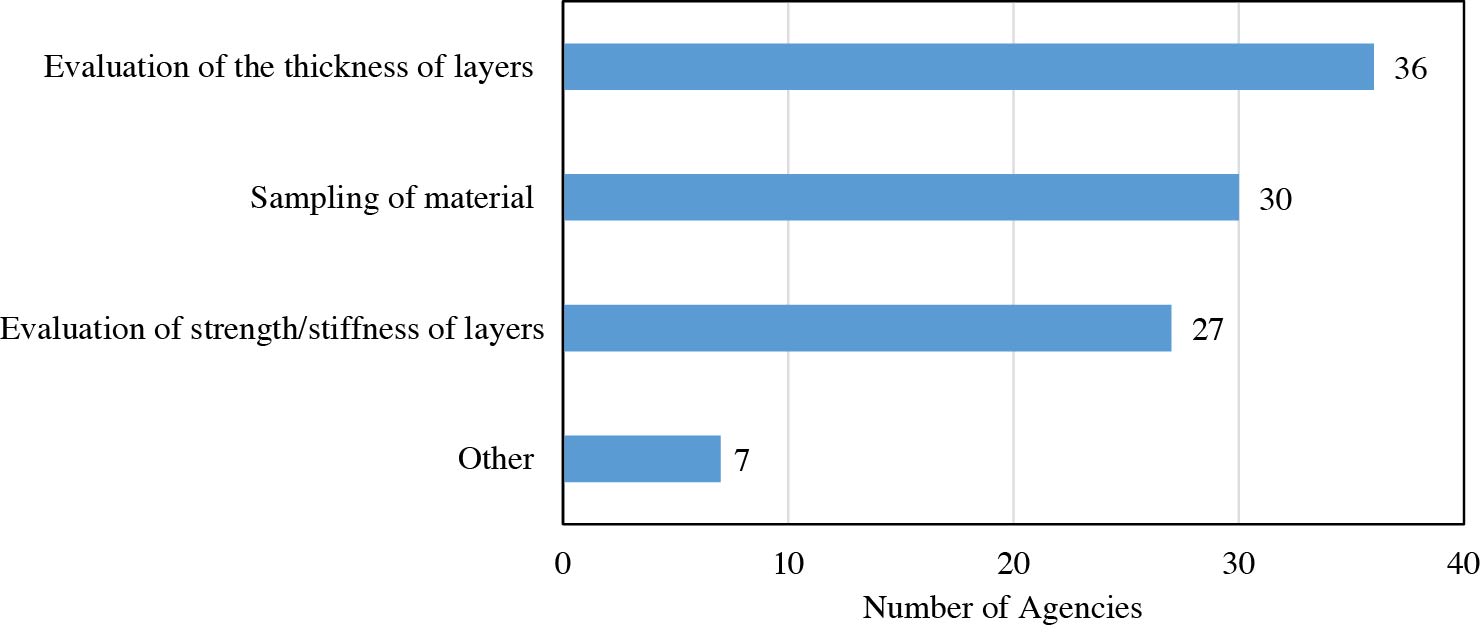
Of the 40 responding agencies that reported using FDR in the past 5 years, 78% (or 31 of 40) stated that their agency always conducts a pre-design investigation before performing FDR, as shown in Figure 24. Only 20% (or 8 of 40) of the agencies reported that they sometimes perform a pre-design investigation, and one agency reported that they do not conduct pre-design investigations for FDR. Of the 39 agencies that reported always or sometimes conducting pre-design investigations, Figure 25 and Table 9 show the types of activities these agencies perform during site investigations.
Long Description.
The horizontal axis for the number of agencies ranges from 0 to 45 in increments of 5. The vertical axis lists different categories. The data is as follows. Existing pavement structure, 38. Existing primary stresses, 37. Existing subgrade type, 29. Initial slash construction cost, 23. Existing ride quality, 18. Life cycle cost or cost slash benefit, 16. Other, 9.
Sustainability |
Ability to obtain structural adequacy within the allowable rise in road profile |
Uniformity and thickness of asphalt and base course (where present) |
Maintenance of traffic (MOT) |
Drainage |
Need for rapid construction; minimize lane closures |
When mill and overlays are no longer viable options to pavement life; also, to potentially fix existing base issues |
Shoulder width |
While we hope to use it more and would use it primarily based on a poor functional condition – cracking that indicated the pavement is worn out but there are not major structural issues |
Long Description.
The horizontal axis for the number of agencies ranges from 0 to 35 in increments of 5. The vertical axis lists different categories. The data is as follows. Fatigue cracking, 32. Base failure, 31. Longitudinal and transverse cracking, 19. Potholes, 16. Rutting, 16. Other, 0.
Long Description.
The data is as follows. Yes, always, 31. Yes, sometimes, 8. No, 1.
Long Description.
The horizontal axis for the number of agencies ranges from 0 to 40 in increments of 10. The vertical axis lists different categories. The data is as follows. Evaluation of the thickness of layers, 36. Sampling of materials, 30. Evaluation of strength or stiffness of layers, 27. Other, 7.
ADT |
Gradation |
Lab testing including gradation, PI, strength testing also performed on soils |
AASHTO T 283, modified |
Recently, we have used TSD (traffic speed deflectometer) data to evaluate stiffness |
As-built survey of previous projects, current traffic loading, sampling of materials for determination of cement treatment possibilities |
Sampling of materials and gradations of unbound materials |
3.3 Use of Stabilizing Agents in FDR
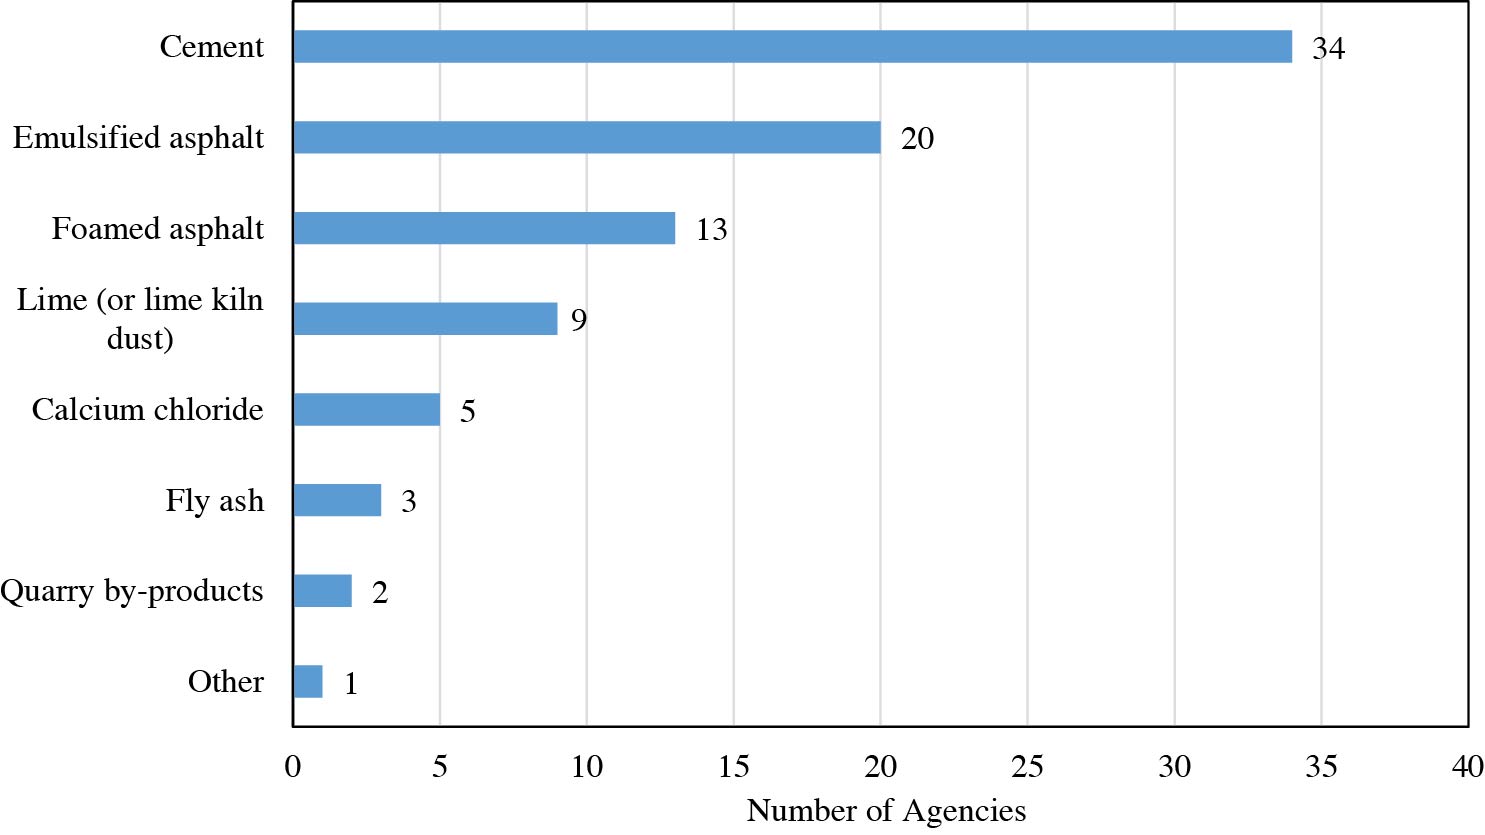
Thirty-six of 49 responding agencies reported the use of FDR with stabilization. A range of stabilizing agents is used by these agencies (Figure 26 and Table 10), with cement being the most commonly used, reported by 94% (or 34 of 36) of the reporting agencies for FDR applications. Of the responding agencies, 56% (or 20 of 36) reported using emulsified asphalt, with 36% (or 13 of 36) reported using foamed asphalt.
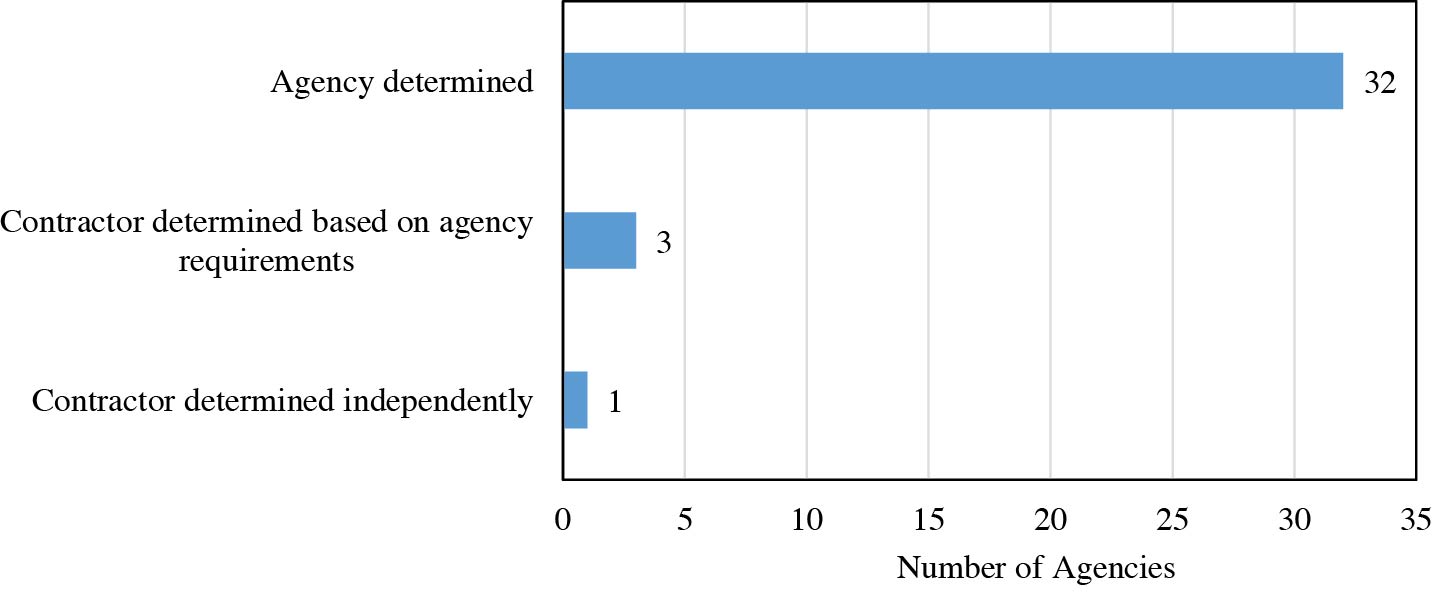
When conducting FDR, 89% (or 32 of 36) of the agencies reported that their agency determines the stabilizing agent type used in these applications, while 8% (or 3 of 36) reported that their contractor determines the stabilizing agent type independently based on the agencyʼs requirements, and 3% (or 1 of 36) reported that their contractor determines the stabilizing agent type independently (Figure 27).
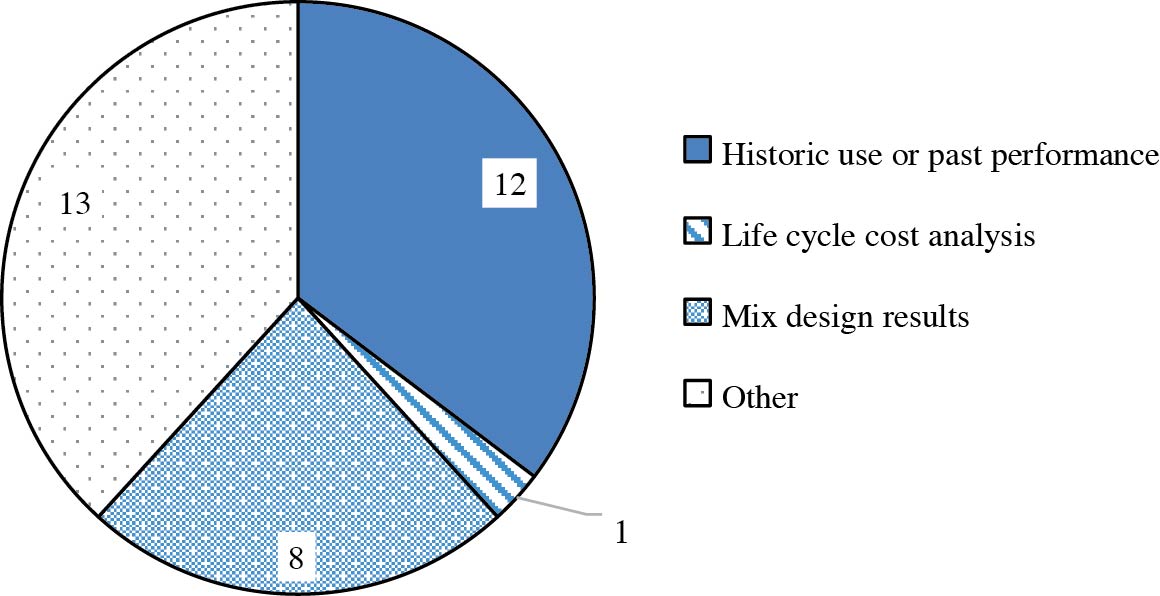
Of the agencies that reported that they determine their stabilizing agent type or that their contractors do based on their requirements, 35% (or 12 of 34) reported that the decision is based on historic use or past performance and 24% (or 8 of 34) reported that they primarily determine the type used based on their mix design results (Figure 28). One agency reported that the decision is based on life cycle cost analyses, and none reported using traffic levels or the availability of materials as the primary factor. Other factors used in determining the type of stabilizing agent are shown in Table 11.
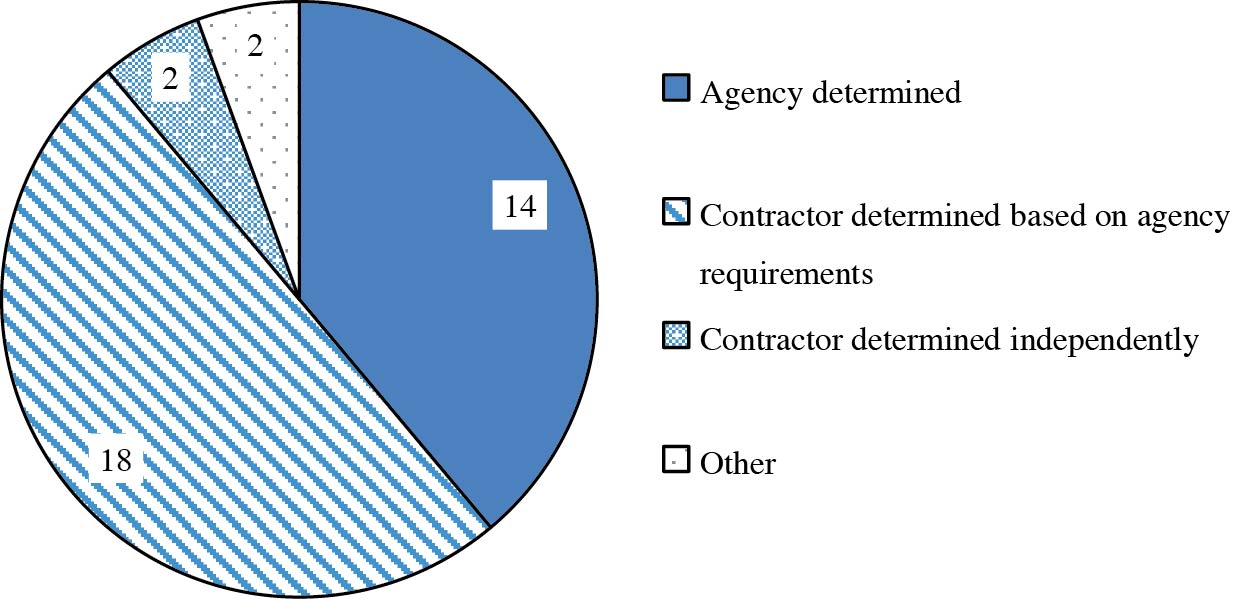
Stabilizing agent dosage is determined by contractors based on the agency requirements in 50% (or 18 of 36) of the responding agencies (Figure 29), 39% (or 14 of 36) reported that their agency determines the stabilizing agent dosage; 6% (or 2 of 36) reported that the contractors determine the dosage independently. The “other” responses are shown in Table 12.
Long Description.
The horizontal axis for the number of agencies ranges from 0 to 40 in increments of 5. The vertical axis lists different categories. The data is as follows. Cement, 34. Emulsified asphalt, 20. Foamed asphalt, 13. Lime or lime kiln dust, 9. Calcium chloride, 5. Fly ash, 3. Quarry by-products, 2. Other, 1.
Cement slurry |
Liquid stabilizing agent |
Long Description.
The horizontal axis for the number of agencies ranges from 0 to 35 in increments of 5. The vertical axis lists different categories. The data is as follows. Agency determined, 32. Contractor determined based on agency requirements, 3. Contractor determined independently, 1.
Long Description.
The data is as follows. Historic use or past performance, 12. Life cycle cost analysis, 1. Mix design results, 8. Other, 13.
ALDOT Section 302 only allows cement |
Always Calcium Chloride |
Existing site conditions including unbound base gradation and asphalt layer thickness. |
Field review, traffic, and existing material considerations. |
N/A, determined by Contractor |
Pre-design investigation is used to determine type of stabilizing agent |
Recently have only used cement as a stabilizing agent. |
Stabilizer is determined based on a detailed preliminary site investigation and sampling. |
Subbase soil types |
Traffic level, scope of project, and site conditions. |
Under Pavement Support Program, Rowan University is conducting Research. |
Utilized knowledge from other agencies and FDR contractors |
We initially used FDR with emulsion. Based on some research decided to start using all cement instead but turned out the emulsion ones performed well and we will be trying a foamed asphalt FDR in a couple years. Criteria for determining which to use has not been developed. |
Long Description.
The data is as follows. Agency determined, 14. Contractor determined based on agency requirement, 18. Contractor determined independently, 2. Other, 2.
Stabilizing agent dosage rate is determined by performing mix design by the consultant hired by the contractor based on agency requirement. |
Contractor uses Manufacturerʼs Recommendation. We are not allowed to pick a certain product of liquid stabilizer to use so our plans are based on an estimate, but the Contractor is asked to follow that particular manufacturerʼs recommended rate. |
Long Description.
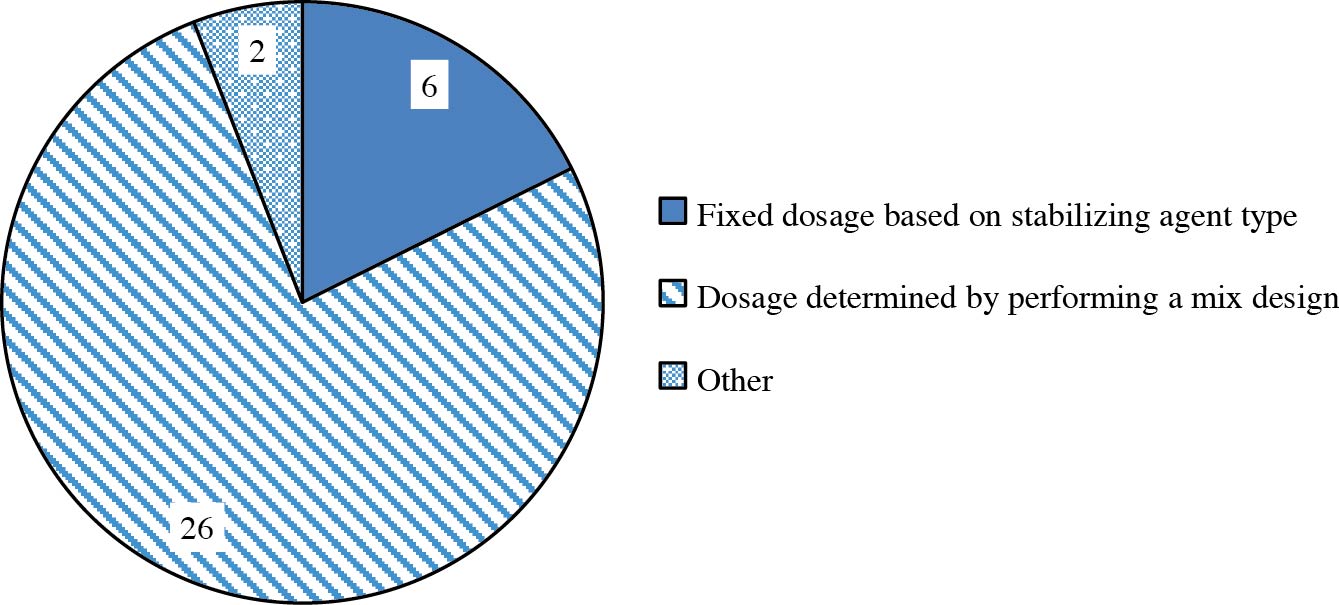
The data is as follows. Fixed dosage based on stabilizing agent type, 6. Dosage determined by performing a mix design, 26. Other, 2.
ITD [Idaho Transportation Department] Specifies Portland cement by percent of estimated reclaimed density. Typically, 1.0 to 2.5 percent. Decided by materials engineer of record |
Standard Specification lists the type and dosage of the stabilizing agent |
Manufacturerʼs recommendation |
For cement based on achieving specified 7-day unconfined compressive strength in test sections |
0.10 to 0.25 gallons per square yard |
Lab testing to meet design strength |
Some Districts use a fixed dosage, and some determine a dosage based on a mix design. |
The methods agencies use to determine the dosage are shown in Figure 30. Seventy-six percent (or 26 of 34) of the responding agencies reported that they determine the stabilizing agent dosage by performing a mix design. Another 18% (or 6 of 34) of respondents designate a fixed dosage based on the type of stabilizing agent used, as detailed in Table 13. Other methods reported by agencies are shown in Table 14.
3.4 Pavement Design with FDR Layers
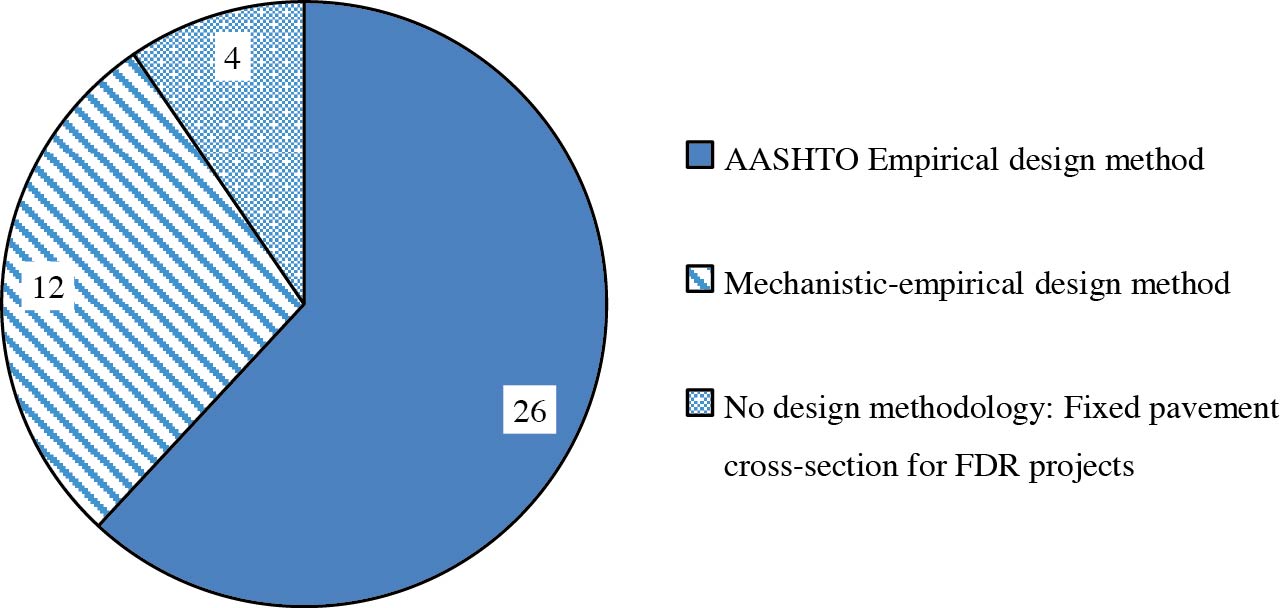
In terms of designing FDR-rehabilitated pavements, 62% (or 26 of 42) of the responding agencies reported using the AASHTO empirical design method when designing pavements with an FDR layer, while 29% (or 12 of 42) reported using a mechanistic-empirical design method. Ten percent
(or 4 of 42) of the responding agencies reported that they use a fixed pavement cross-section for FDR projects (Figure 31).
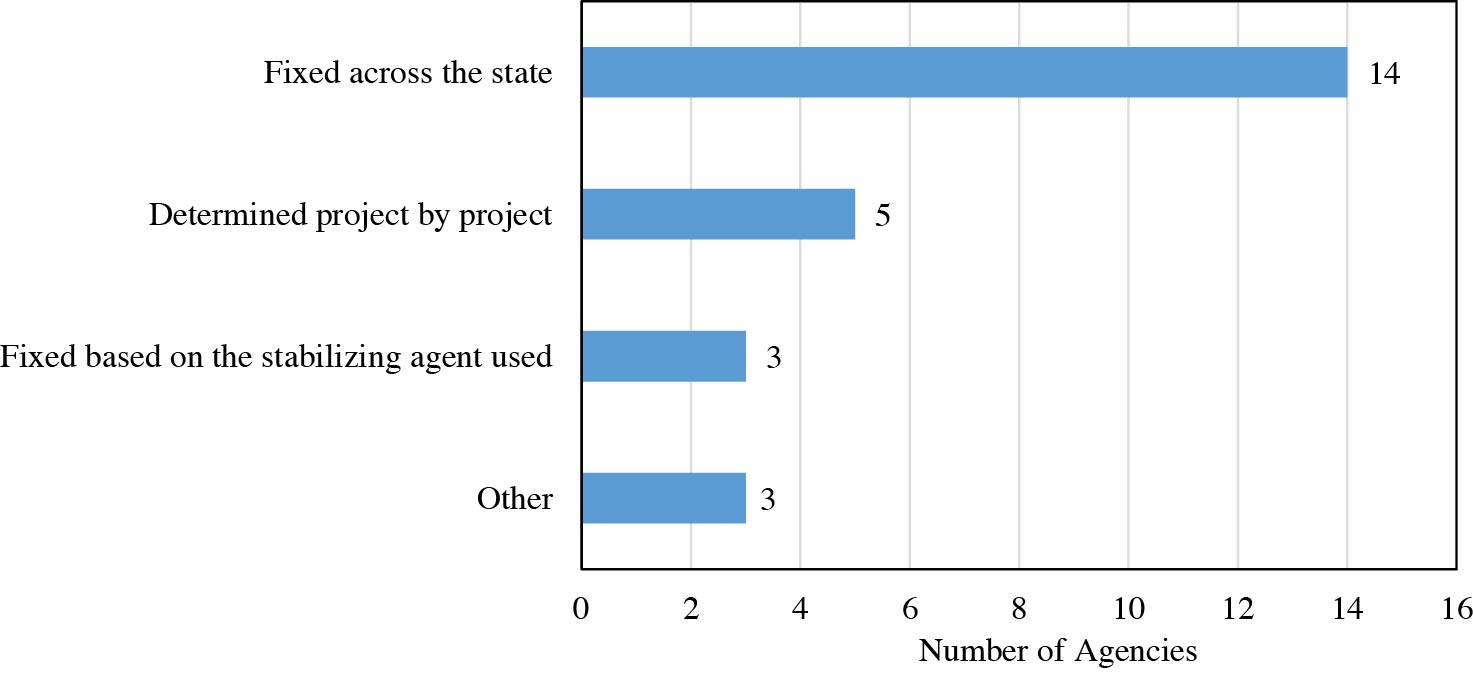
As shown in Figure 32, of the agencies using an empirical design methodology for FDR pavements, 56% (or 14 of 25) reported that FDR layer property values are fixed across their entire state, while 12% (or 3 of 25) reported that the fixed FDR layer property values used depend on the stabilizing agent used. In other words, they have a layer property value for cement-stabilized FDR, a different value for emulsified asphalt-stabilized FDR, and so on. Values are determined on a project-by-project basis by 20% (or 5 of 25) of the responding agencies. Three of the 25 respondents (12%) indicated that they use alternative methods, as shown in Table 15.
Long Description.
The data is as follows. AASHTO Empirical design method, 26. Mechanistic-empirical design method, 12. No design methodology, fixed pavement cross-section for FDR projects, 4.
Long Description.
The horizontal axis for the number of agencies ranges from 0 to 16 in increments of 2. The vertical axis lists different categories. The data is as follows. Fixed across the state, 14. Determined project by project, 5. Fixed based on the stabilizing agent used, 3. Other, 3.
Research project from early 1990s |
Fixed across the state for Mechanical FDR. |
Based on material type and catalog of typical values based on material type. |
| Layer Coefficient Values | Modulus Values (psi) |
Fixed Value (number of agencies reporting) | 0.10 (2) 0.11 (1) 0.12 (2) 0.14 (1) 0.15 (3) 0.20 (2) | 30,000 (2) 40,000 (1) 45,000 (1) |
Range (each range represents a single agency response) | 0.10–0.25 0.20–0.3 | 20,000–40,000 40,000–70,000 80,000–120,000 100,000–150,000 150,000–225,000 |
| Layer Coefficient Values | Modulus Values (psi) |
Fixed Value (number of agencies reporting) | 0.12 (1) 0.14 (1) 0.15 (1) 0.18 (2) 0.20 (3) 0.22 (1) 0.25 (4) 0.26 (1) 0.35 (1) | 40,000 (1) 50,000 (1) 80,000 (3) 137,143 (1) |
Range (each range represents single agency response) | 0.14–0.35 0.22 (emulsified asphalt) 0.26 (foamed asphalt) 0.26 (cement) | 50,000–75,000 60,000–80,000 70,000–110,000 100,000–400,000 150,000–225,000 85,000 (designed as unbound) 500,000 (designed as semi rigid) 300,000–500,000 (cement) 435,000 (foamed asphalt) 1,450,000 (cement) |
The layer coefficient or modulus values that agencies report using in design for mechanical FDR layers are shown in Table 16. The reported layer coefficient values range from 0.10 to 0.30, while the modulus values range from 20,000 psi to 225,000 psi. The reported layer coefficient or modulus values for stabilized FDR are presented in Table 17. The layer coefficient values range from 0.12 to 0.35, and the modulus values range from 40,000 psi to 1,450,000 psi.
3.5 Mix Design and Construction of FDR
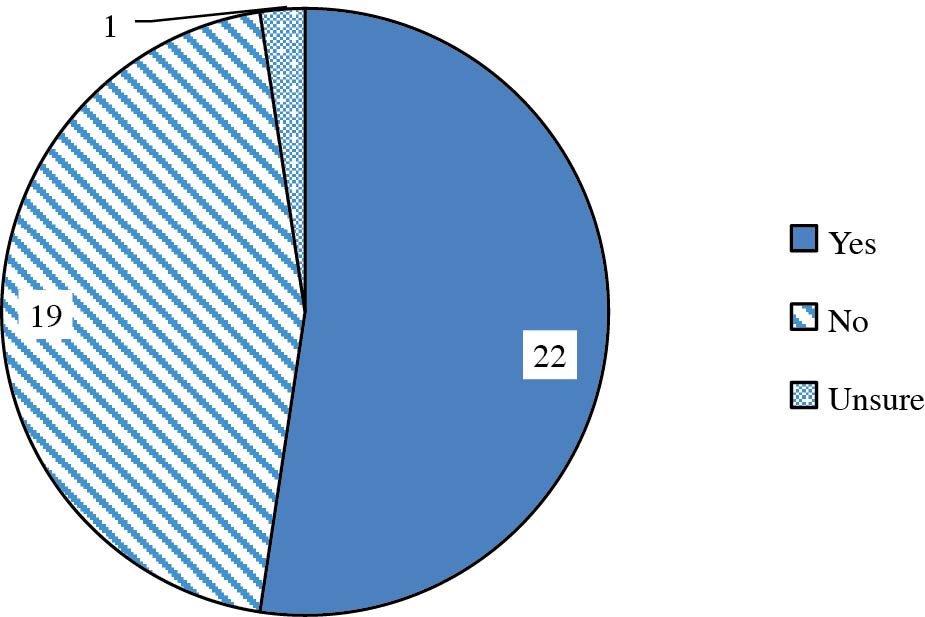
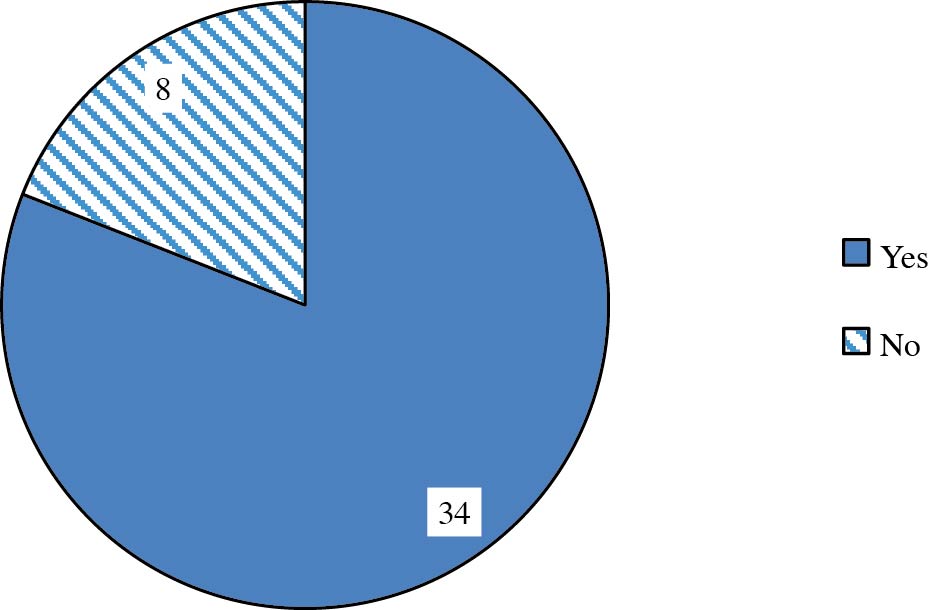
As displayed in Figure 33 and Figure 34 respectively, 52% (or 22 of 42) of responding agencies reported that their agency has a standard specification for the mix design of FDR, while 81% (or 34 of 42) reported that their agency has a standard specification for the materials and construction of FDR.
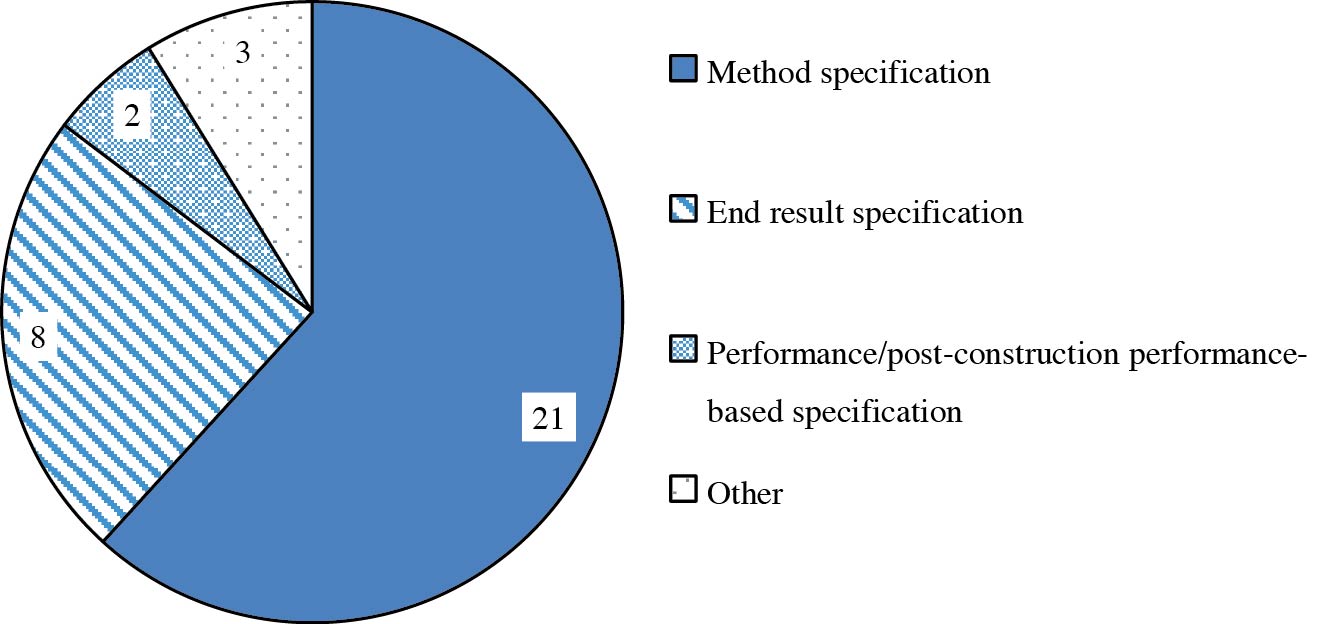
As shown in Figure 35 and Table 18, of the 34 agencies that reported having a materials and construction specification for FDR, 62% (or 21 of 34) stated that these are method specifications, 24% (or 8 of 34) reported that these are end-result specifications, and 6% (or 2 of 34) reported that they have performance-based or post-construction performance-based specifications (such as warranties or maintenance agreements). None of the agencies reported using quality assurance or incentive-based specifications for their materials and construction standards.
Long Description.
The data is as follows. Yes, 22. No, 19. Unsure, 1.
Long Description.
The data is as follows. Yes, 34. No, 8.
Long Description.
The data is as follows. Method specification, 21. End result specification, 8. Performance slash post-construction performance-based specification, 2. Other, 3.
Probably a hybrid method, end result, and QA due to reduction if density is not achieved. |
Combination of Method and End-Result. |
QA (no pay adjustments) |
Long Description.
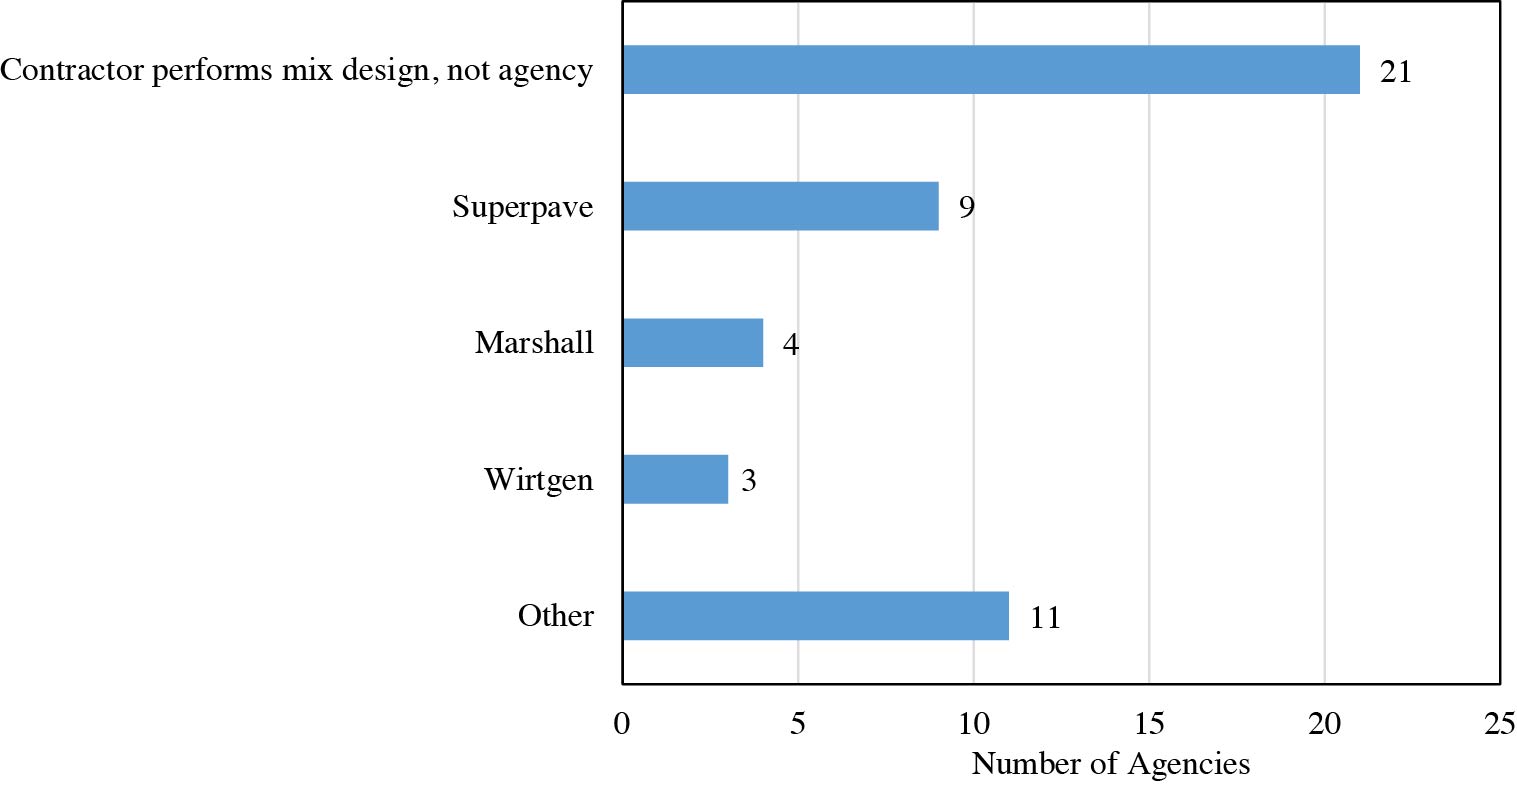
The horizontal axis for the number of agencies ranges from 0 to 25 in increments of 5. The vertical axis lists different categories. The data is as follows. Contractor performs mix design, not agency, 21. Superpave, 9. Marshall, 4. Wirtgen, 3. Other, 11.
As shown in Figure 36, 50% (or 21 of 42) of the responding agencies reported that the contractor performs the mix design for their FDR projects. Of the 21 agencies reporting that they conduct their own mix design, it was reported that 43% (or 9 of 21) of responding agencies most often follow the Superpave method (this is likely to indicate that they use Superpave gyratory compactor for the specimen fabrication, not the Superpave mix design method that is used for hot-mixed asphalt design); 19% (or 4 of 21) of respondents most often use the Marshall mix design method (once again, likely for specimen fabrication); and 14% (or 3 of 21) of the respondents most often use the Wirtgen mix design method. None of the responding agencies reported using a Hveem-type mix design for specimen fabrication. “Other” methods of performing mix design were reported by 52% (or 11 of 21) of the agencies and are summarized in Table 19.
For the mechanical FDR which was identified as the only method used there is no mix design. Gradation and compaction requirements control the operation. |
We do not perform mix designs on the reclaimed material. |
Under Pavement Support Program, Rowan University is conducting research for NJDOT. |
Depending on the ratio of RAP and soil, we may use a Superpave gyratory or Proctor molds to fabricate test specimens. |
Contractors perform the mix design and have the option of Marshall or Superpave gyratory compaction. |
AASHTO |
Fixed Cement Content |
TxDOT developed mix design procedures Tex-122-E and Tex-134-E. https://www.txdot.gov/business/resources/materials/materials-test-procedures.html?CFCtarget=https%3A%2F%2Fwww.dot.state.tx.us%2Fapps-cg%2Ftest_procedures%2Ftms_series.htm%3Fseries%3D100-E |
ASTM 1633 Method A |
Unconfined compression testing at varying levels of additive and moisture. |
We do not require a mix design on stabilized base. |
3.6 Post-Construction for FDR
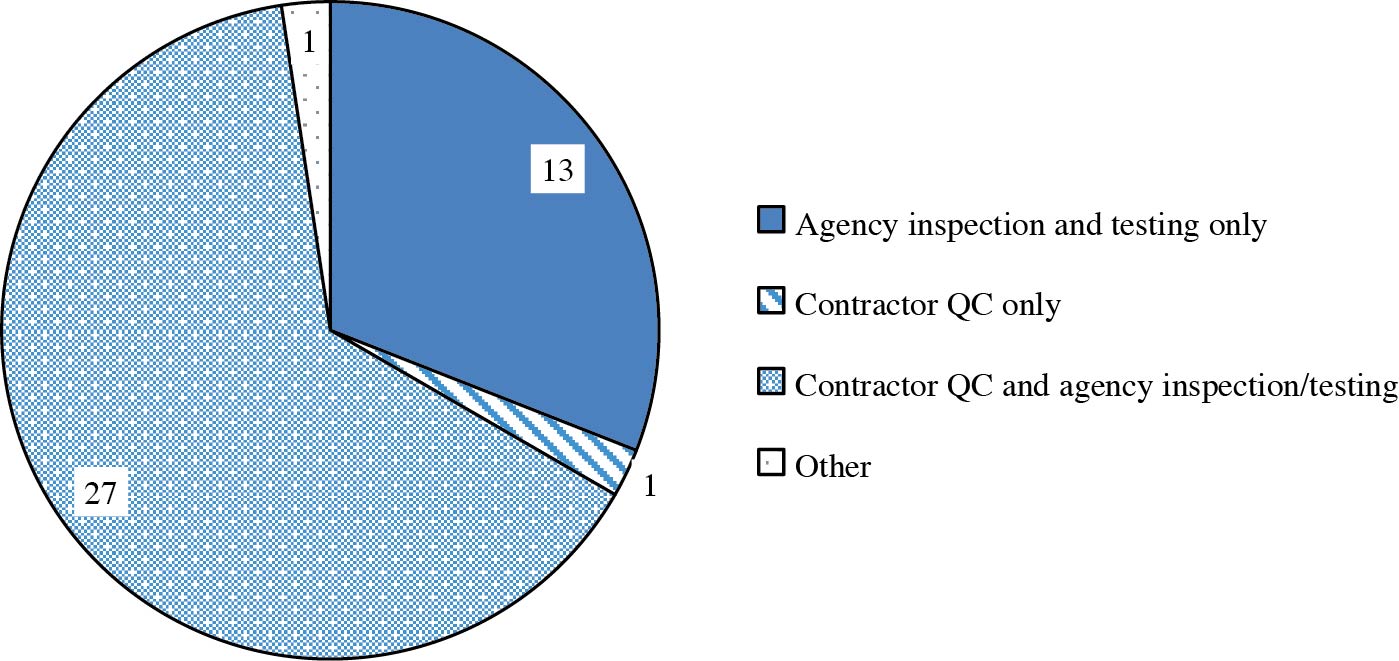
All responding agencies reported having QA practices in place (Figure 37), and 64% (or 27 of 42) stated that both agency inspection and contractor quality control (QC) are performed. Only agency inspection and testing were reported by 31% (or 13 of 42) of respondents; one agency reported that only contractor QC is conducted. One agency reported that QA processes are dependent on the type of stabilizing agent used, as shown in Table 20.
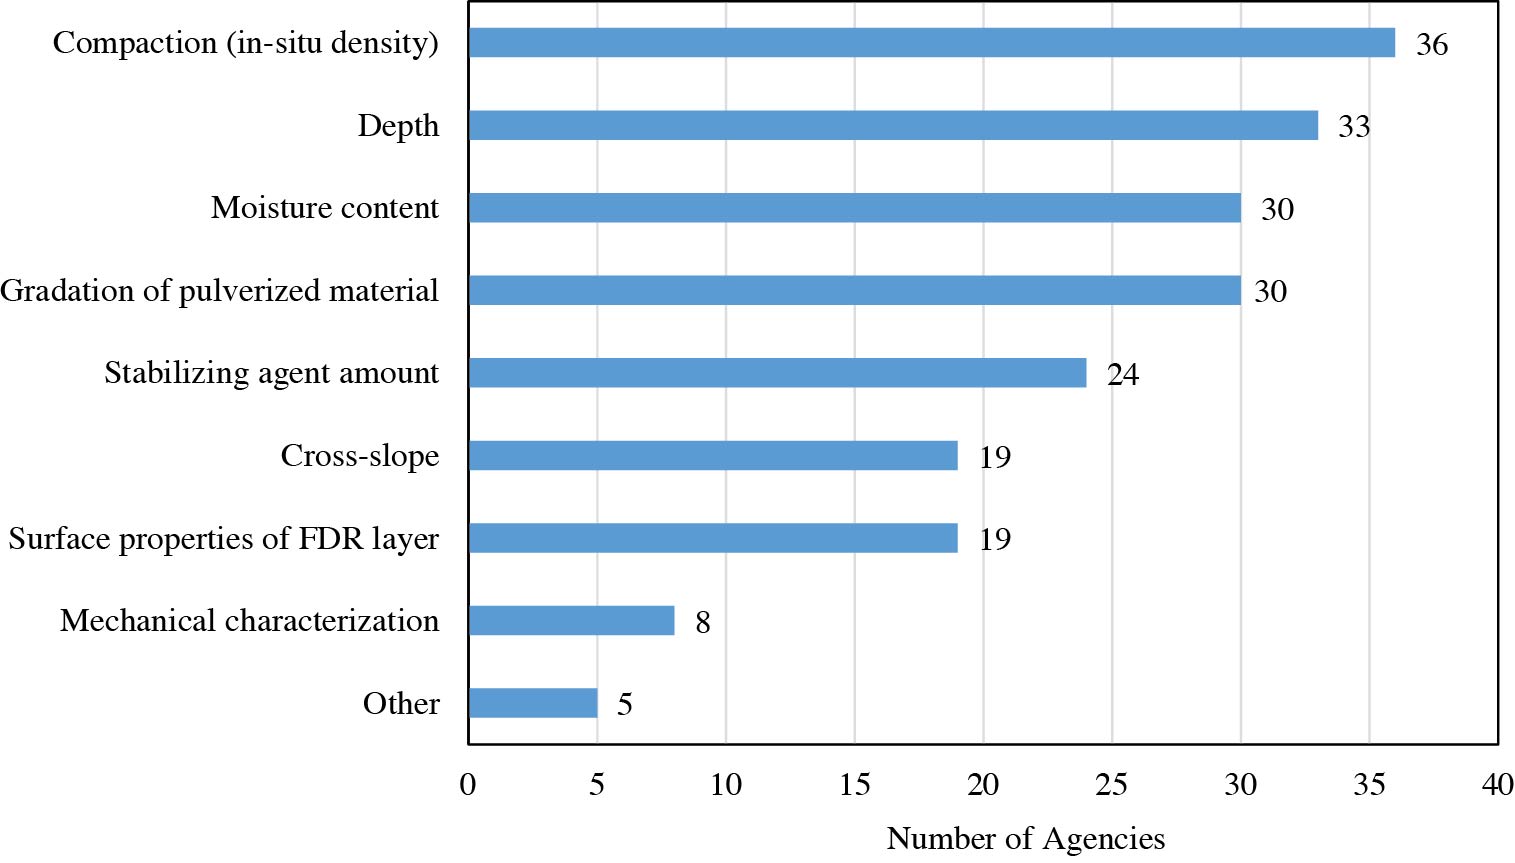
Forty agencies reported that they employ agency inspection and testing for FDR projects; the distribution of parameters these forty agencies evaluate during this inspection and testing is presented in Figure 38. The most commonly evaluated parameters are the in situ density of
Long Description.
The data is as follows. Agency inspection and testing only, 13. Contractor QC only, 1. Contractor QC and agency inspection or testing, 27. Other, 1.
Agency inspection and testing for all, however emulsion and foamed asphalt include contractor process control testing. |
Long Description.
The horizontal axis for the number of agencies ranges from 0 to 40 in increments of 5. The vertical axis lists different categories. The data is as follows. Compaction (in-situ density), 36. Depth, 33. Moisture content, 30. Gradation of pulverized material, 30. Stabilizing agent amount, 24. Cross-slope, 19. Surface properties of FDR layer, 19. Mechanical characterization, 8. Other, 5.
the constructed FDR layer, followed by the depth of the FDR, the moisture content of the constructed reclaimed layer, and the gradation of the material being pulverized. Other commonly evaluated parameters include the amount of stabilizing agent being used, the cross-slope of the constructed layer, and the surface properties of the FDR layer. Some states report that they conduct mechanical characterization of the FDR layer, and other parameters evaluated are shown in Table 21.
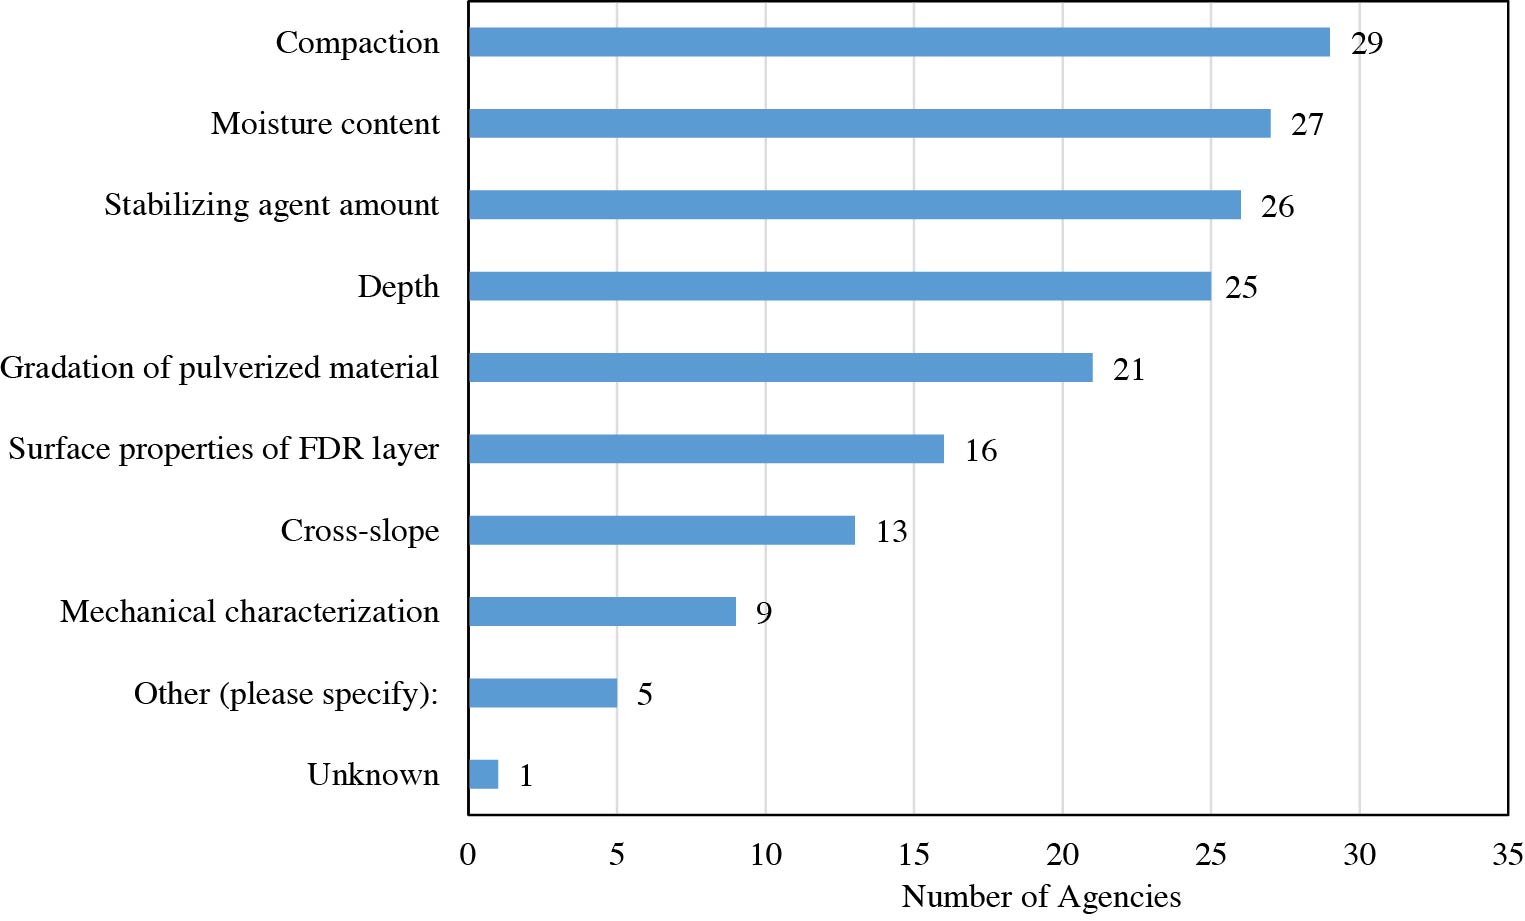
Of the 28 agencies that reported employing contractor QC for FDR projects, the distribution of parameters that they require their contractors to evaluate is presented in Figure 39 and is similar to those in agency inspection and testing. The most commonly evaluated parameters are the in situ density of the constructed FDR layer, followed by the moisture content of the constructed reclaimed layer, the amount of stabilizing agent used, the depth of the FDR, and the gradation of the material being pulverized. Other commonly evaluated parameters include the surface properties of the FDR layer, the cross-slope of the constructed layer, as well as mechanical characterization of the FDR layer and other parameters, as shown in Table 22.
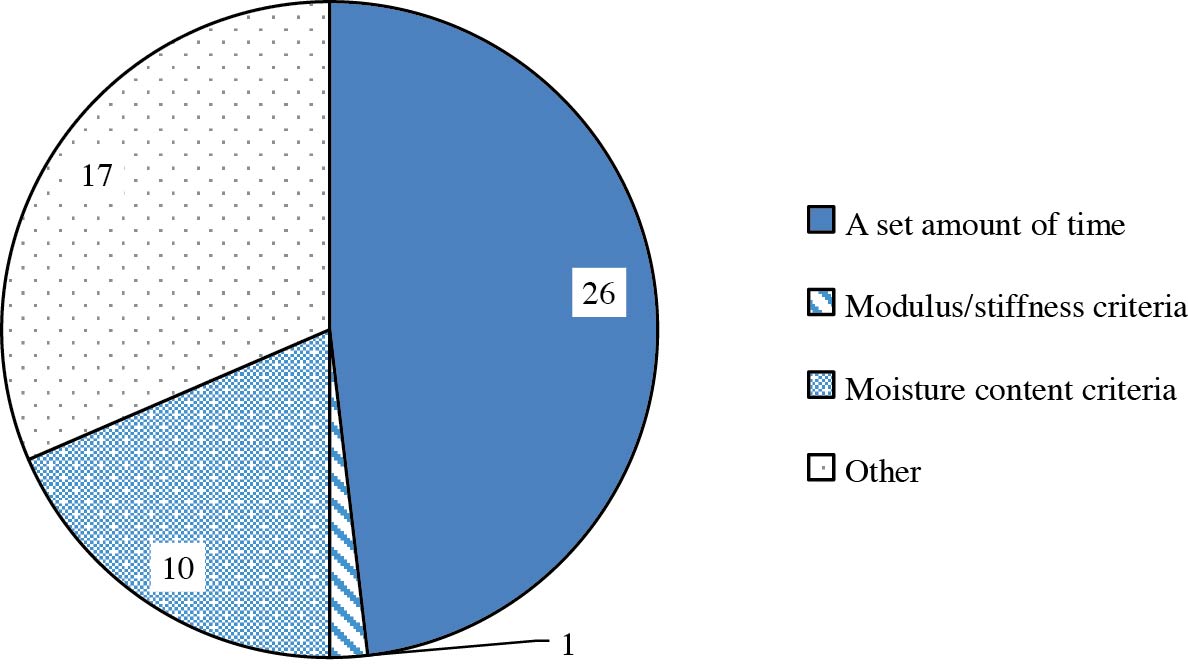
As shown in Figure 40, the majority of responding agencies (62%, or 26 of 42) reported that they require a fixed amount of time prior to allowing traffic on or constructing an overlay on the FDR pavement. Others reported that they have specific criteria that must be met for a newly constructed FDR pavement. Two percent (or 1 of 42) of the responding agencies reported that they have modulus or stiffness criteria that must be met, while 24% (or 10 of 42) of the responding
Unconfined Compression Test (psi) |
Marshall stability and retained stability |
Verification of desired properties if emulsion or cement stabilization is used. |
Strength |
I am not exactly sure of all parameters required. The gradation is not a full gradation, but it does need to pass the 1.5 inch sieve and at least 95% passing the 1 inch sieve. The answers provided are for Mechanical FDR. |
Long Description.
The horizontal axis for the number of agencies ranges from 0 to 35 in increments of 5. The vertical axis lists different categories. The data is as follows. Compaction, 29. Moisture content, 27. Stabilizing agent amount, 26. Depth, 25. Gradation of pulverized material, 21. Surface properties of FDR layer, 16. Cross-slope, 13. Mechanical characterization, 9. Other (please specify), 5. Unknown, 1.
Marshall stability and retained stability |
Strength |
Proofrolling |
Answers above are for Mechanical FDR. |
Long Description.
The data is as follows. A set amount of time, 26. Modulus slash stiffness criteria, 1. Moisture content criteria, 10. Other, 17.
agencies reported having moisture content criteria of the FDR layer as a requirement. None of the responding agencies reported using the amount of raveling resistance (for example, by the short-pin raveling test) or the amount of shear resistance (for example, by the long-pin shear test) as criteria. Additional methods reported by the agencies are presented in Table 23.
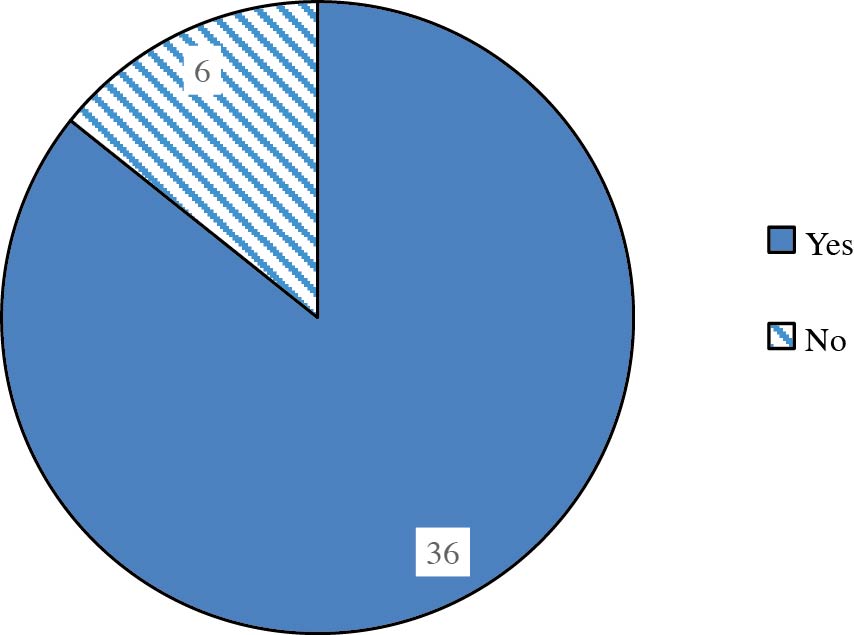
As shown in Figure 41, 86% (or 36 of 42) of responding agencies reported that they do conduct performance evaluation(s) to evaluate the performance of FDR-rehabilitated pavements over time. The remaining 14% (or 6 of 42) of responding agencies reported that they do not conduct performance evaluations of their FDR pavements.
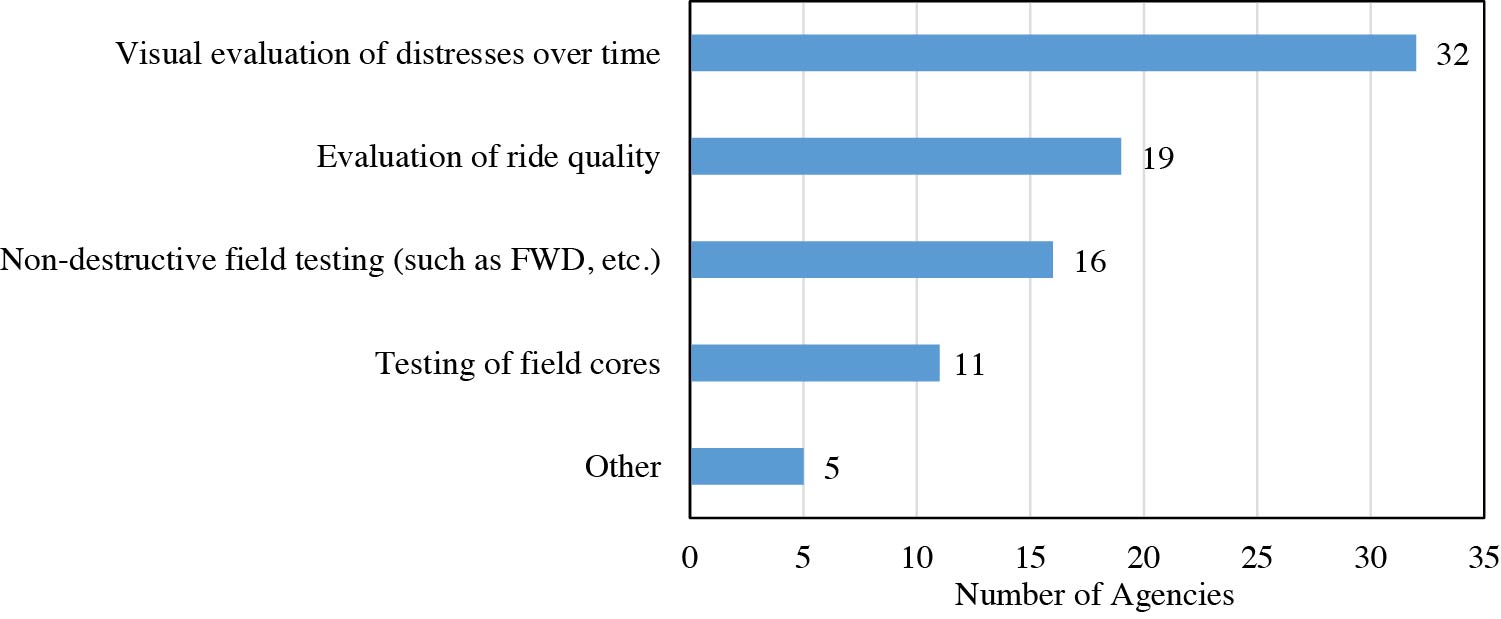
Of the 36 agencies that reported employing testing of FDR projects to evaluate their performance over time, the distribution of the types of evaluations they perform is presented in Figure 42. The most common type of evaluation performed is a visual evaluation of distress over time, followed by an evaluation of ride quality, non-destructive field testing (such as FWD), and testing of field cores. Other testing that was reported as being conducted to evaluate FDR projects over time is shown in Table 24.
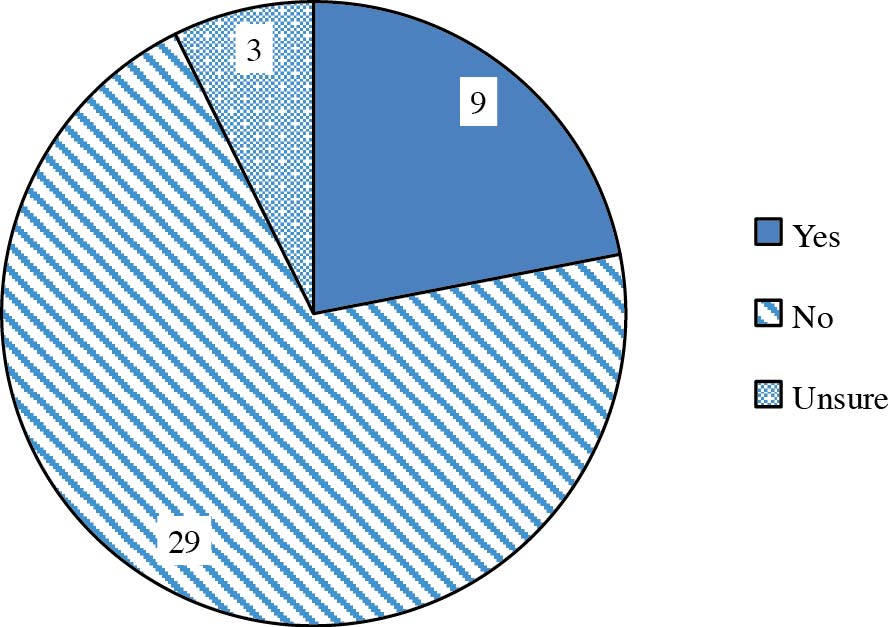
Only 22% (or 9 of 41) of responding agencies reported that they employ some treatments to minimize the potential for cracking in the asphalt overlay (Figure 43). The reported treatment types are detailed in Table 25.
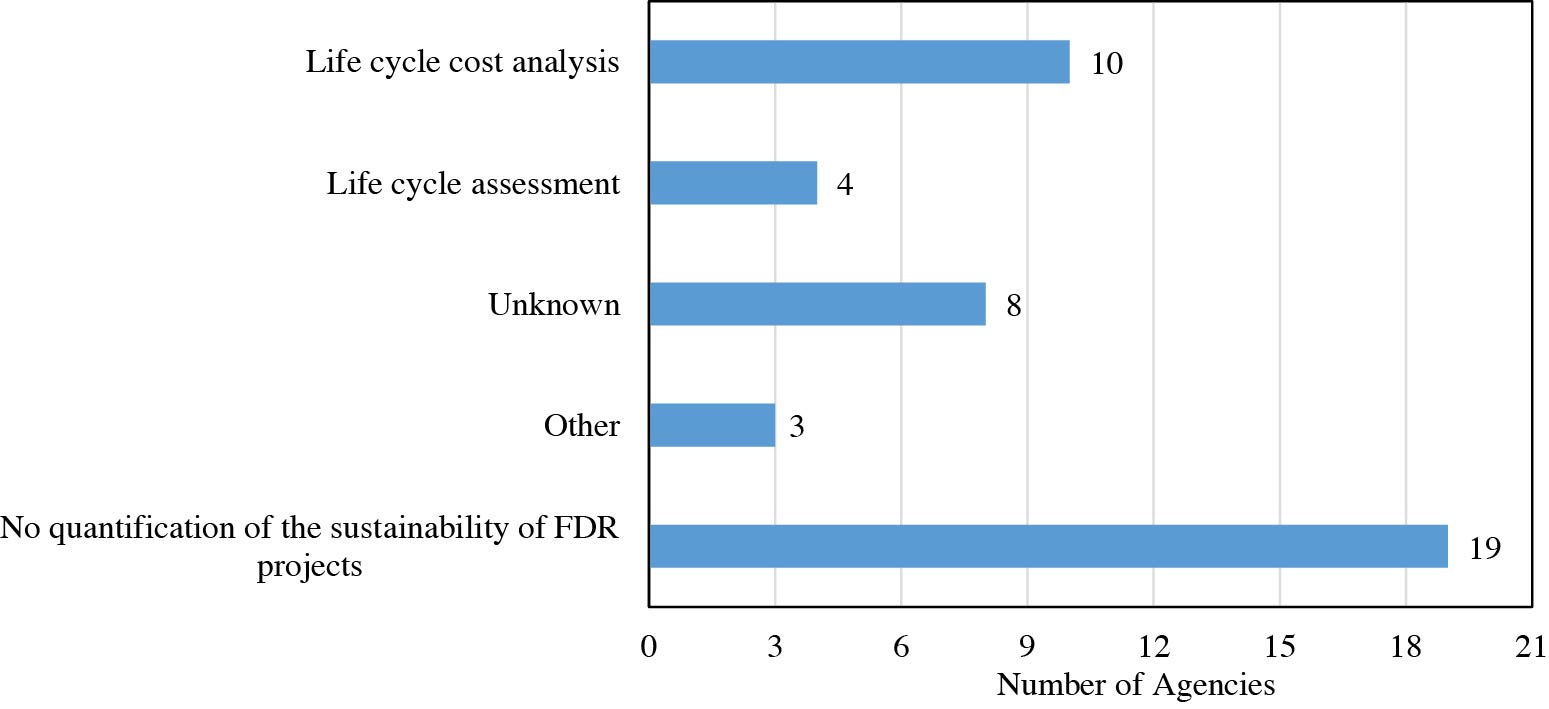
Most agencies (66%, or 27 of 41) responded that they do not quantify the sustainability (such as by a life cycle assessment) of FDR projects, do not conduct life cycle cost analyses of FDR projects, or are unsure if these analysis methods are performed (Figure 44). Among the remaining agencies, more reported performing LCCAs than LCAs. Agencies reporting “other” indicated that they recognize the value of these analysis methods, and several are in the developmental or planning stages (Table 26).
Contractors must maintain surface acceptable for traffic. |
Nothing in spec |
Typically require the FDR layer receive at least one lift of asphalt mix before opening to traffic. |
We use moisture content for placement of the surface layer. Once the fog seal is sufficiently cured, the FDR layer can be opened to traffic. |
FDR stabilized base has cured for minimum of 10 days. |
VDOT FDR Special Provision does not (have a) requirement for FDR layer. See section VII.4 of VDOT FDR Special Provision for surfacing requirement. |
After Compaction, for max 14 days |
Do not allow traffic on the reclaimed base until it is assured the reclaimed base surface will not distort, shove, or ravel under the anticipated vehicular loading. |
Sometimes take a core to verify sufficient curing. |
Compacted layer density |
Once the material meets the grade and compaction requirements. |
Proof Roll |
No additives, traffic is released at the end of day. Cement or emulsion will require factors/properties to be met (i.e., set time, compressive strength, cure, etc.) |
Completed sections of the full depth reclaimed roadbed may be opened when necessary to lightweight local traffic, provided the surface has hardened sufficiently to prevent marring or distorting of the surface, and provided the curing is not impaired. Construction equipment shall not operate on the full depth reclamation sections except as necessary to discharge into the spreader during paving operations. If the full depth reclaimed roadbed is impaired by premature opening to traffic, the entire affected section shall be reconstructed at the Contractorʼs expense. |
On the Mechanical FDR it would be after the prime cures which is a minimum of 72 hours. |
As soon as cement-stabilized base course has been compacted to 98 percent of the maximum dry density and the finished surface has been checked with a surveyorʼ level to ensure the ordinates measured do not exceed 1/2 inch. |
When the surface is smooth and compacted enough to hold traffic. |
Long Description.
A pie chart depicts the data for the distribution of agencies as follows. Yes, 36. No, 6.
Long Description.
The horizontal axis for the number of agencies ranges from 0 to 35 in increments of 5. The vertical axis lists different categories. The data is as follows. Visual evaluation of distress over time, 32. Evaluation of ride quality, 19. Non-destructive field testing (such as FWD, et cetera), 16. Testing of field cores, 11. Other, 5.
Dynamic Cone Penetrometer (DCP) |
Regular pavement management evaluation |
Rutting and cracking by the laser crack measuring system |
Evaluation as part of the pavement network condition collection for pavement management systems |
This has been done on a couple of projects over the years but is not routinely done on every FDR project completed in the state. |
Long Description.
A pie chart depicts the data for the distribution of agencies as follows. Yes, 9. No, 29. Unsure, 3.
Tack surface of FDR to control moisture. |
Cold in place recycling |
Occasionally, we will micro-crack the Portland cement FDR material. |
Chip seal interlayer |
In some projects VDOT uses a two-lift asphalt system. Currently VDOT is performing a research project to reduce potential for reflective cracking in Cement stabilized FDR. |
Crack sealing |
Chip seals, Micro surfacing |
Routing and sealing cracks. Chip seals. Nothing different on an FDR as compared to a mill and AC overlay. |
Apply cure coat depending on project ADT: • < 400 ADT: Prime and sand • ≥ 400 ADT: Apply single stone of size 89 as surface treatment layer |
Long Description.
The horizontal axis for the number of agencies ranges from 0 to 21 in increments of 3. The vertical axis lists different categories. The data is as follows. Life cycle cost analysis, 10. Life cycle assessment, 4. Unknown, 8. Other, 3. No quantification of the sustainability of FDR projects, 19.
These considerations are in planning stages of development |
We are currently participating in FHWAʼs Climate Challenge to perform LCA for FDR mixtures. |
As we do not quantify the sustainability currently, we recognize this is a great benefit of using recycling of materials technique. |
For projects meeting VDOT Pavement Type Selection, Life Cycle Cost analysis will be conducted |
3.7 Identification of Challenges and Future Plans
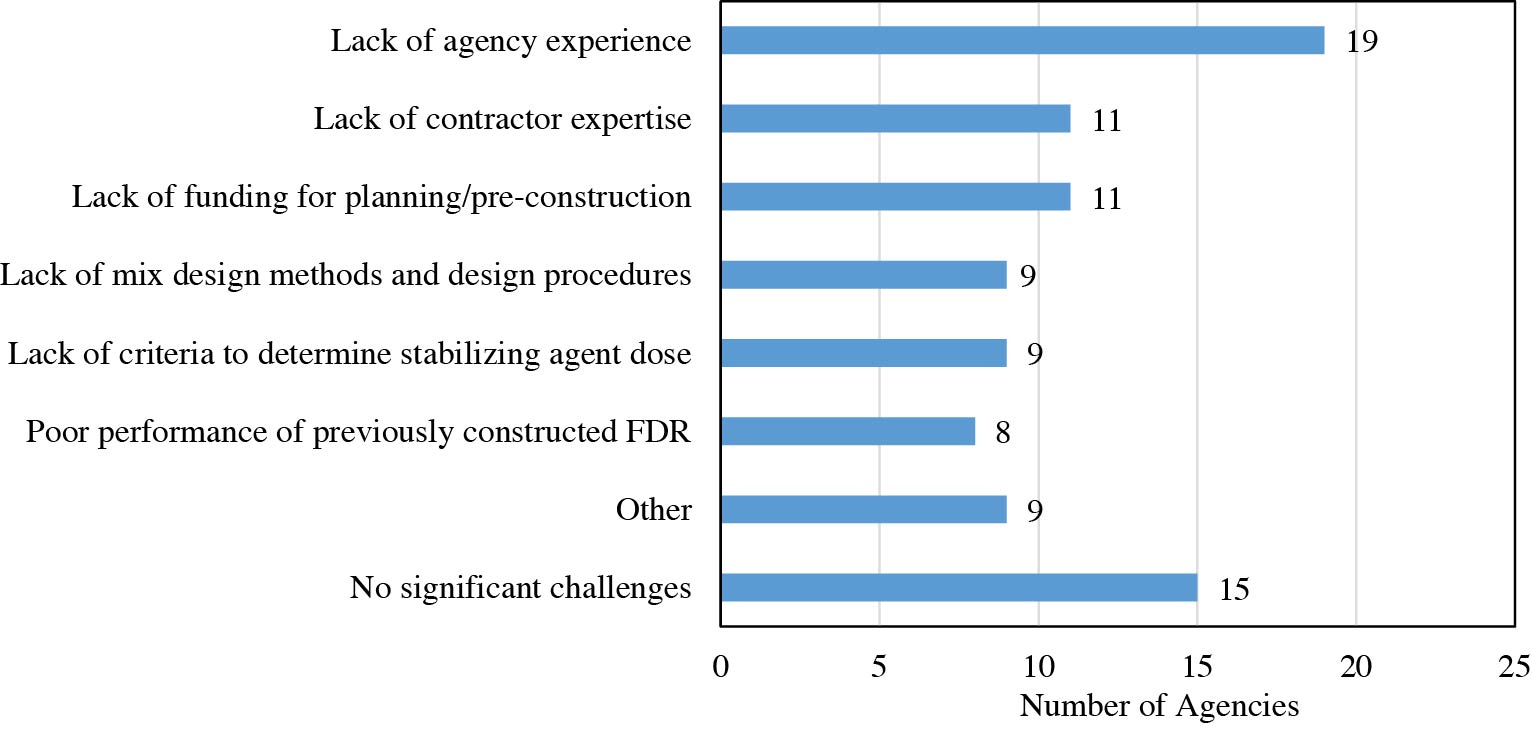
Figure 45 shows that 31% (or 15 of 49) of respondents reported that their agency has not faced any significant challenges when implementing FDR. The most common (39%, or 19 of 49) challenge reported is an overall lack of agency experience. Other commonly reported challenges include a lack of contractor expertise, a lack of funding present for planning or pre-construction phases of FDR projects, a lack of mix design methods or design procedures available, a lack or criteria available to determine the dose of stabilizing agents to be used, and experience with poor performance of previously constructed FDR projects. Other reported challenges are shown in Table 27.
Long Description.
The horizontal axis for the number of agencies ranges from 0 to 25 in increments of 5. The vertical axis lists different categories. The data is as follows. Lack of agency experience, 19. Lack of contractor expertise, 11. Lack of funding for planning or pre-construction, 11. Lack of mix design methods and design procedures, 9. Lack of criteria to determine stabilizing agent dose, 9. Poor performance of previously constructed FDR, 8. Other, 9. No significant challenges, 15.
Lack of funding in general to conduct a substantial project, FDR typically requires multiple lifts of pavement to be placed on it at substantial cost. |
City street are short blocks, in many cases may not accommodate the train of equipment needed for the operation. |
Insufficient contractor QC and agency inspection specific to depth of mixing, moisture content and uniformity across the mat width. |
We have done it once, but it was just more than 5 years ago. We have only done it once because that was the only time criteria was met. |
We find this as more of an issue during design to try to achieve a 50/50 blend of existing bituminous pavement and aggregate base. During construction we try to make sure we get the teeth of the reclaimer into the base layer to cool them off. |
This was initial hurdle that has been overcome. |
NMDOT has good experience with FDR projects, we are trying to improve project selection, materials, and specifications |
Limited number of reconstruction candidates |
Lack of subgrade strength. Roadway/shoulder width requirements. |
Long Description.
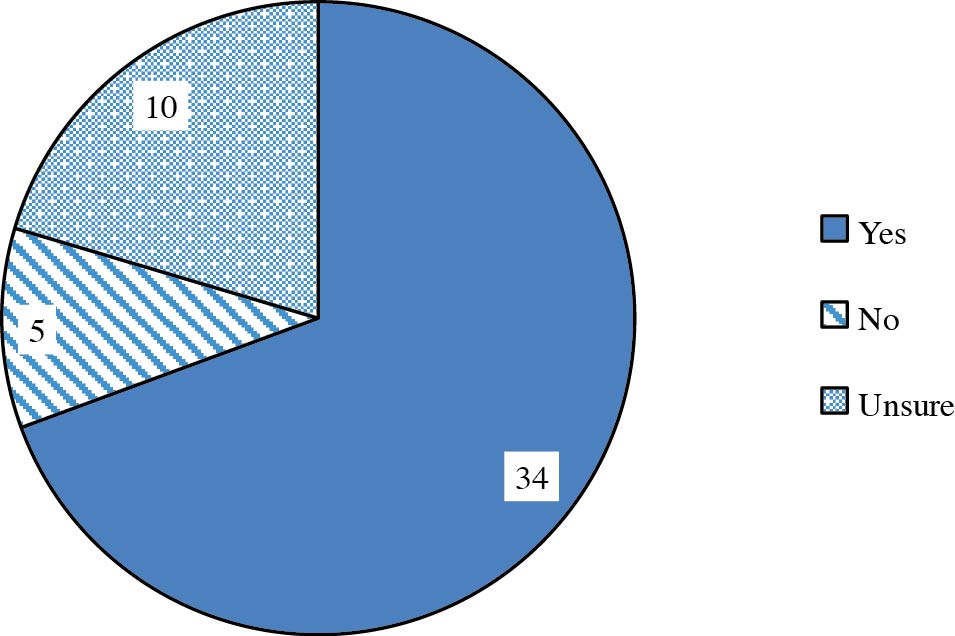
A pie chart shows the data as follows. Yes, 34. No, 5. Unsure, 10.
Despite the previously mentioned challenges, as shown in Figure 46, 69% (or 34 of 49) of the responding agencies reported that they have plans to carry out FDR in future projects. Only 10% (or 5 of 49) reported that they do not have plans to employ FDR.
3.8 Summary
The survey results indicated that 85% (or 40 of 47) of responding agencies perform mechanical FDR and/or FDR in their states. The responding agencies reported a range of years of experience with this rehabilitation method; however, the majority (70%, or 28 of 40) reported performing it on less than 50 lane-miles per year. These agencies also tended to employ FDR on lower-volume roadways and primarily when concerns of fatigue cracking failure or base failure were evident. Further, when conducting FDR, 98% (or 39 of 40) of responding agencies reported that they conduct pre-design investigations.
The results in this survey indicated that cement is the most common stabilizing agent used in FDR projects, with 94% (or 34 of 36) of responding agencies reporting its use. Eighty-nine percent (or 32 of 36) of responding agencies reported that they determine the type of stabilizing agent to be used. Mix design was identified as the methodology to determine stabilizing agent dosage by 76% (or 26 of 34) of reporting agencies. Fifty percent (or 21 of 42) of responding agencies reported that contractors perform the mix design for FDR. The remaining 50% (or 21 of 42) of responding agencies reported a range of mix design methods that they use when designing FDR. A large majority (81%, or 34 of 42) of the responding agencies reported they have a standard specification for the materials and construction of FDR.
The majority (62%, or 26 of 42) of responding agencies reported that they use an empirical design method for pavement design with FDR. Fifty-six percent (or 14 of 25) of agencies reported that they use fixed FDR layer property values across their state when designing for FDR. The reported layer coefficient values used by agencies for mechanical FDR layers ranged from 0.10 to 0.30, while the reported modulus values for mechanical FDR ranged from 20,000 psi to 225,000 psi. For FDR, the reported layer coefficient values ranged from 0.12 to 0.35, while the reported modulus values ranged from 40,000 psi to 1,450,000 psi, depending on the type of stabilization. Fifty-two percent (or 22 of 42) of responding agencies reported that they have a standard specification for the design of pavements with FDR.
For post-construction practices of FDR roadways, the majority of responding agencies (64%, or 27 of 42) reported that they require both agency inspection and testing along with contractor
QC. The parameters most often required in QA are compaction (in situ density), depth, moisture content, gradation of the pulverized material, and the amount of stabilizing agent. After construction of an FDR pavement, 62% (or 26 of 42) of responding agencies reported that they allow traffic to resume on the roadway after a set amount of time. Only 22% (or 9 of 41) of responding agencies reported that they routinely utilize treatments to reduce the cracking potential in asphalt overlays on FDR layers. Furthermore, 66% (or 27 of 41) of respondents reported that their agency does not or does not plan to quantify, or is unsure if their agency quantifies, the cost-effectiveness or sustainability of their FDR projects using LCCA or LCA methods.
When conducting FDR, the primary challenge in implementing FDR is a lack of agency experience, but the responding agencies reported a range of lesser challenges. Only 31% (or 15 of 49) of responding agencies reported that they have not faced any significant challenges when it comes to implementing FDR. Despite that, 69% (or 34 of 49) of responding agencies reported that they have plans to use FDR in future projects.


