Selecting Communication Channels to Deliver Traffic Safety Messaging: A Guide (2026)
Chapter: 2 Current State of the Practice

CHAPTER 2
Current State of the Practice
The current state of the practice of behavioral traffic safety messaging, including best practices and cost-effective approaches for delivering such messages, was documented. The research team examined peer-reviewed and technical literature reviews and environmental scans. Research reporting traffic safety campaign outcomes was assessed with particular attention to modality of communication and demographics targeted. The peer-review efforts were supplemented with a series of internet searches to assess the current safety campaign landscape, including campaigns aimed at behaviors commonly targeted for safety messaging, such as speeding, impairment, distraction, and jaywalking, with particular focus on demographic diversity, including scanning all 10 National Highway Traffic Safety Administration (NHTSA) regions. This included a review of the Governors Highway Safety Association (GHSA) State Highway Safety Showcases (https://www.ghsa.org/resource-type/state-showcases) and NHTSAʼs Traffic Safety Marketing (https://www.trafficsafetymarketing.gov/) to identify current and recently implemented campaigns.
Using the results of the literature review and synthesis, the team created a matrix to track national- and state-level SHSO-led safety campaigns, attempting to identify campaigns in all 50 states and the 10 NHTSA regions. This matrix includes information on effective traffic safety campaigns and behavioral traffic safety messaging across diverse geographic and demographic representations and contains the publicly available information in the following discrete columns:
- Campaign name
- Campaign sponsor
- Behavior(s) addressed: speeding, drunk driving, drowsy driving, pedestrian safety, etc.
- Location(s): the state or locality where the campaign was disseminated
- NHTSA region
- Transportation modality: light vehicle drivers, pedestrians, motorcyclists, bicyclists, truck drivers, etc.
- Target audience: age, race, gender, other demographics, etc.
- Campaign points of contact: name/email/phone
- Communication channel type: broadcast, print, in-home, billboard, internet, etc.
- Location of impression: TV, internet, radio, flyers, transit, in-vehicle ads, road signs, etc.
- Campaign stage: formative research, conceptualization, development, dissemination, evaluation, currently active, ended, etc.
- Campaign evaluation: description of whether the campaign has been or will be evaluated, the type(s) of evaluation, and the type(s) of data collected
- Outcomes/results of the campaign
- Availability of assessment data: degree to which data is available for campaign evaluation
- Campaign resources
In addition, the campaign matrix includes tabs focusing on each behavior targeted (e.g., seat belt use, child passenger safety).
The campaign matrix is supplemented by approaches and recommendations from practitioners, which were obtained through guided interviews. These approaches and recommendations are discussed in the Notable Practices from SHSO Discussions section. Individuals with firsthand experience developing, leading, and evaluating outreach campaigns—including campaign leaders, communication officials, and other state-level representatives—were targeted. The interviews centered on what campaigns the state had recently conducted or was in the process of conducting. The SHSOs engaged during this task were initially identified through conversations with the project panel and were expanded to ensure engagement with two states/territories in each NHTSA region. Additionally, campaigns were chosen to represent a range of safety behaviors and demographic groups being targeted and approaches used.
Table 1 shows the states engaged and campaigns discussed. For each state, the team held an approximately 1-hour discussion using an online telecommunications platform (except Pennsylvania, where the discussion was conducted via email). In addition to SHSOs, the team also met with the Bicycle Coalition of Maine. This organization received funding from the Maine Department of Transportation (DOT) to assist with outreach to vulnerable road users (bicyclists and pedestrians). The team also met with the North Central Texas Council of Governments to
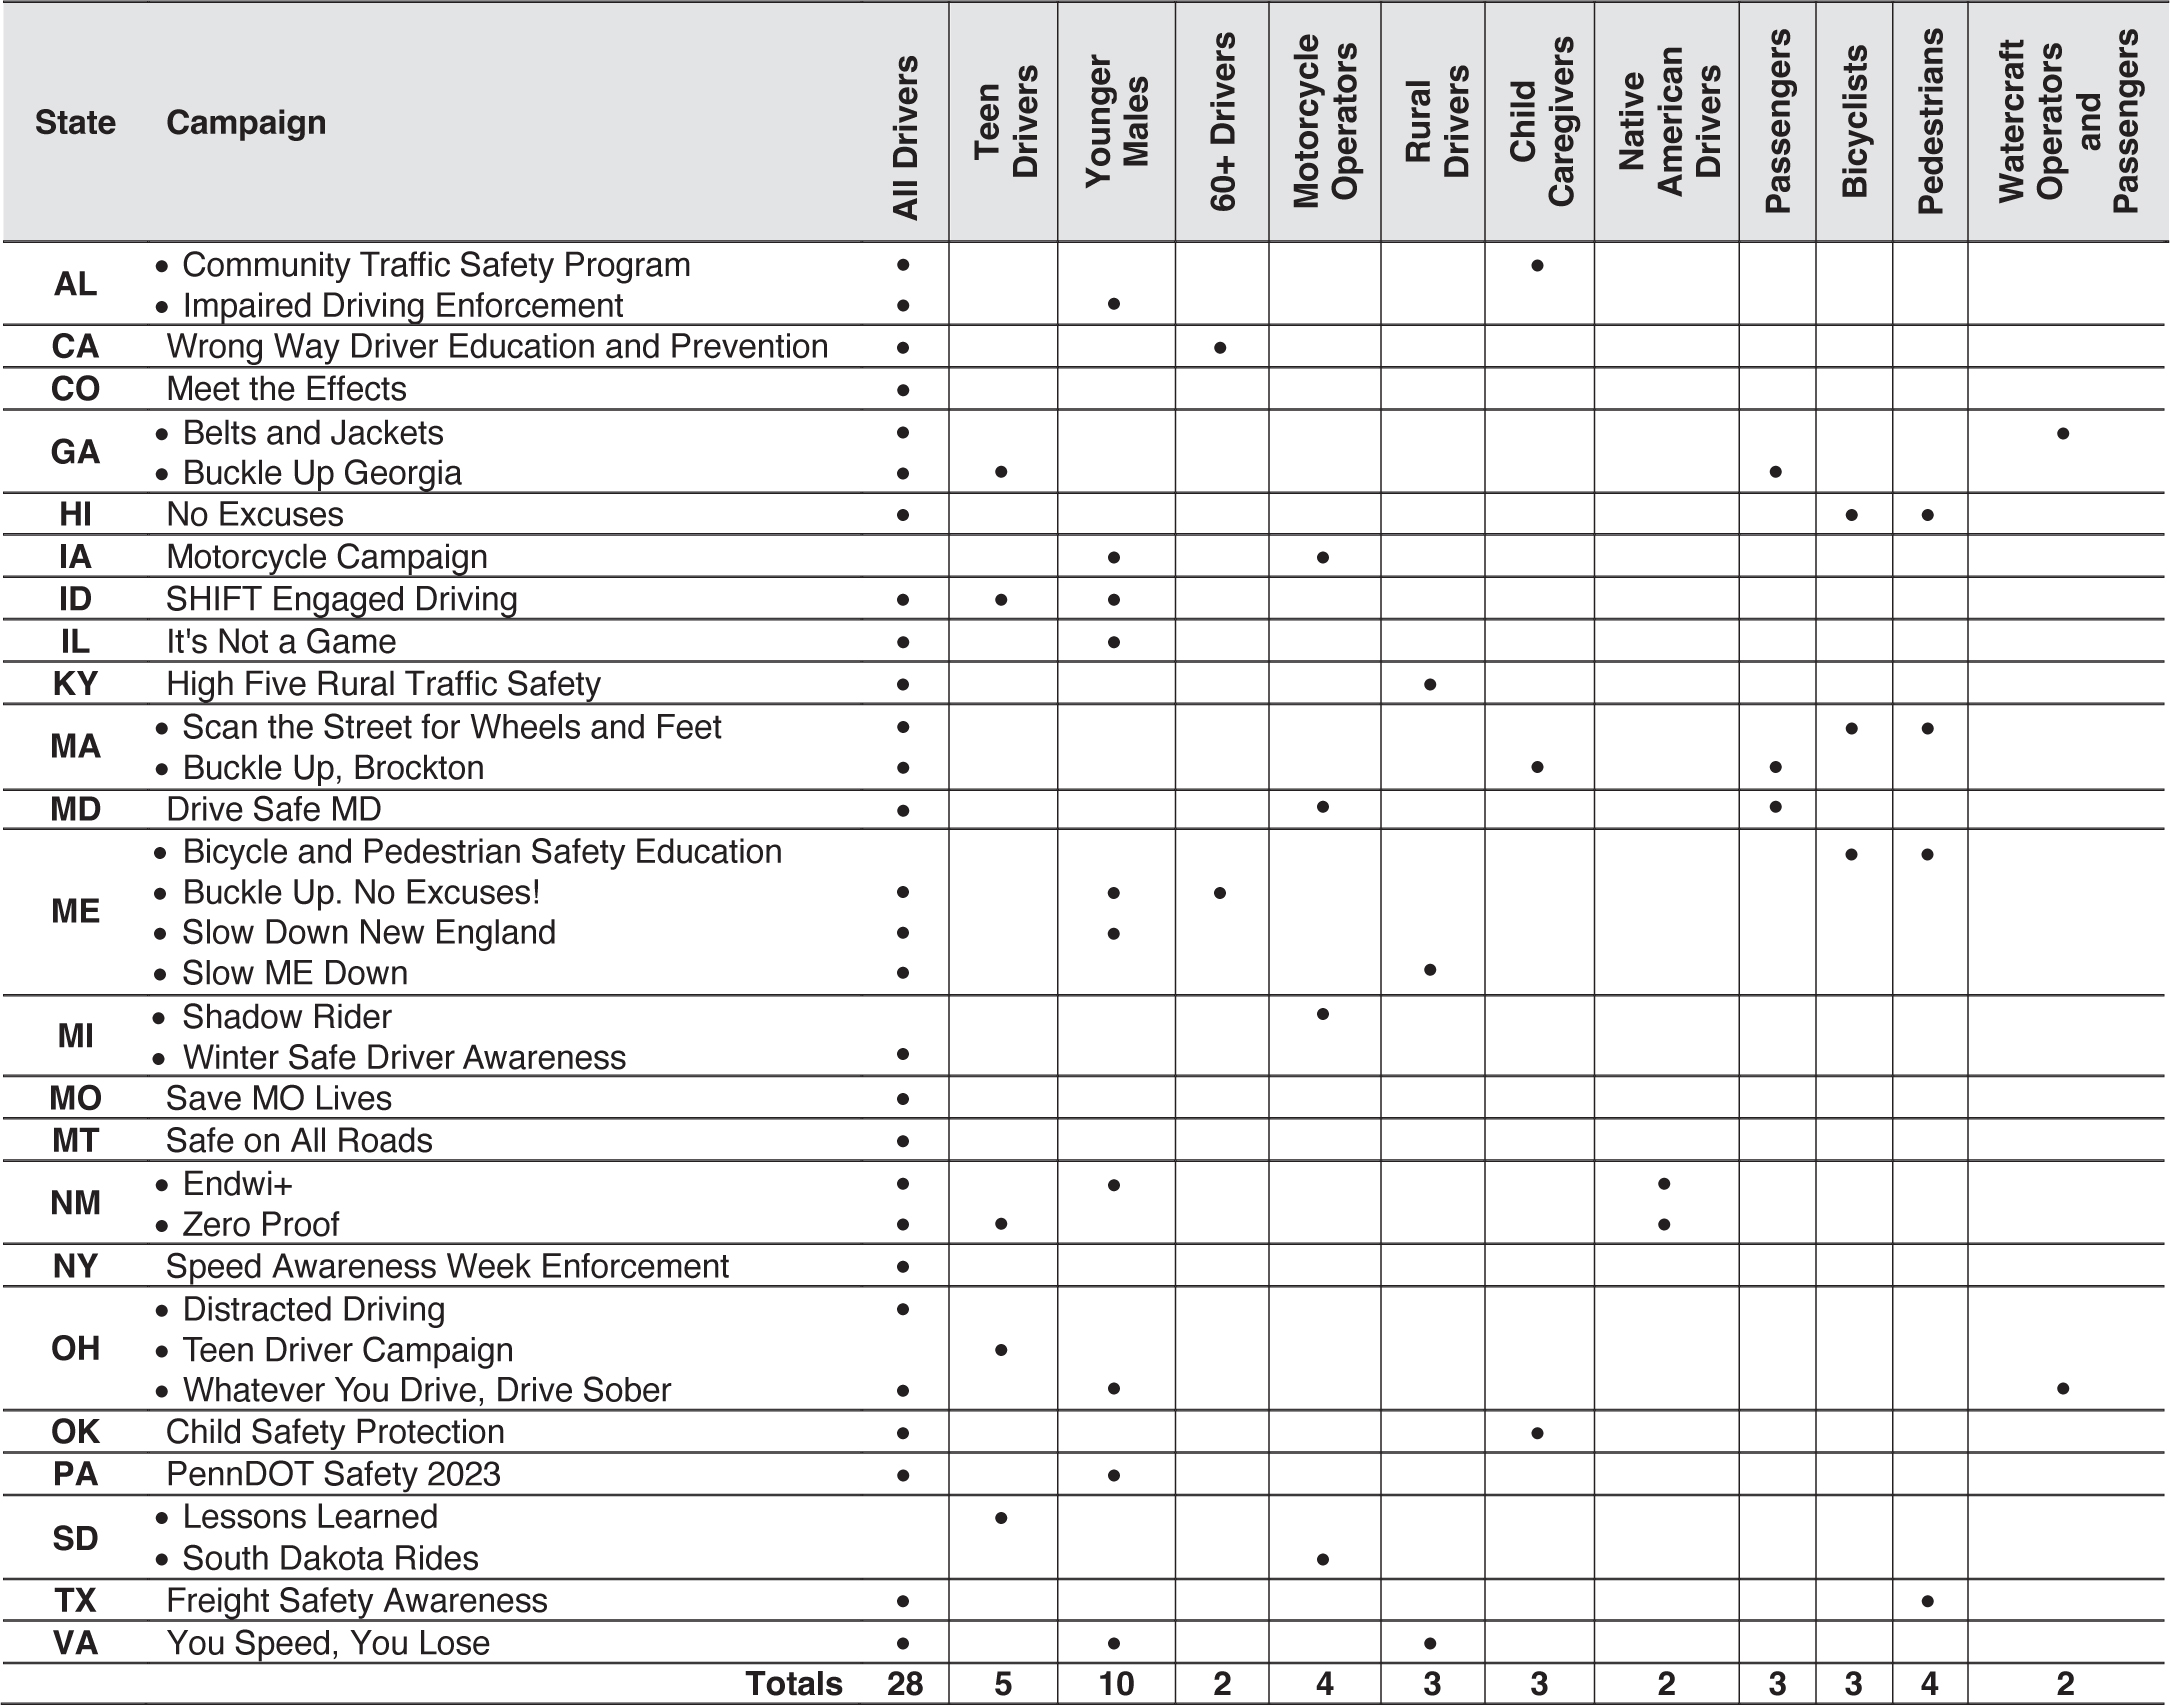
Long Description.
The table has 14 columns and 35 rows. The column headers are: State, Campaign, All Drivers, Teen Drivers, Younger Males, 60 plus Drivers, Motorcycle Operators, Rural Drivers, Child Caregivers, Native American Drivers, Passengers, Bicyclists, Pedestrians, and Watercraft Operators and Passengers. The bullet symbols are used in specific categories to indicate the targeted groups for each campaign. The row details based on the above targeted groups are as follows. Row 1: AL Community Traffic Safety Program: All Drivers, Child Caregivers. Row 2: AL Impaired Driving Enforcement: All Drivers, Younger males. Row 3: CA Wrong Way Driver Education and Prevention: All Drivers, 60 plus drivers. Row 4: CO Meet the Effects: All Drivers. Row 5: GA Belts and Jackets: All Drivers, Watercraft Operators and passengers. Row 6: GA Buckle Up Georgia: All Drivers, Teen Drivers, Passengers. Row 7: HI No Excuses: All Drivers, Bicyclists, Pedestrians. Row 8: IA Motorcycle Campaign: Younger males, Motorcycle Operators. Row 9: ID SHIFT engaged driving: All Drivers, Teen Drivers, Younger Males. Row 10: IL It's Not a Game: All Drivers, Younger Males. Row 11: KY High Five Rural Traffic Safety: All Drivers, Rural Drivers. Row 12: MA Scan the Street for Wheels and Feet: All Drivers, Bicyclists, Pedestrians. Row 13: MA Buckle Up, Brockton: All Drivers, Child caregivers, Passengers. Row 14: MD Drive Safe MD: all drivers, motorcycle operators, passengers. Row 15: ME Bicycle and Pedestrian Safety Education: Bicyclists, Pedestrians. Row 16: ME Buckle Up. No Excuses!: All Drivers, Younger Males, 60 plus drivers. Row 17: ME Slow Down New England: All Drivers, Younger Males. Row 18: ME Slow ME Down: All Drivers, Rural Drivers. Row 19: MI Shadow Rider: Motorcycle Operators. Row 20: MI Winter Safe Driver Awareness: All Drivers. Row 21: MO Save MO Lives: All Drivers. Row 22: MT Safe on All Roads: All Drivers. Row 23: NM Endwi plus: All Drivers, Younger males, Native American Drivers. Row 24: NM Zero Proof: All Drivers, Teen Drivers, Native American Drivers. Row 25: NY Speed Awareness Week Enforcement: All Drivers. Row 26: OH Distracted Driving: All Drivers. Row 27: OH Teen Driver Campaign: Teen Drivers. Row 28: OH Whatever You Drive, Drive Sober: All Drivers, Younger Males, Watercraft Operators and passengers. Row 29: OK Child Safety Protection: All Drivers, Child Caregivers. Row 30: P A. Penn DOT Safety 2023: All Drivers, Younger Males. Row 31: SD Lessons Learned: Teen Drivers. Row 32: SD South Dakota Rides: motorcycle operators. Row 33: TX Freight Safety Awareness: All Drivers, Pedestrians. Row 34: VA You Speed, You Lose: All Drivers, Younger Males, Rural Drivers. Row 35: Totals, All Drivers 28, Teen Drivers 5, Younger Males 10, sixty plus drivers 2, motorcycle operators 4, rural drivers 3, child caregivers 3, Native American drivers 2, passengers 3, bicyclists 3, pedestrians 4, watercraft operators and passengers 2.
discuss their efforts regarding commercial motor carriers and sharing the road (https://www.nctcog.org/trans/plan/freight/freight-safety). In total, the research team engaged stakeholders in 22 states and discussed a total of 32 traffic safety campaigns across the United States.
Following the initial outreach efforts, four campaigns were identified for further investigation:
- “Meet the Effects” in Colorado (https://www.codot.gov/safety/impaired-driving/druggeddriving)
- “Buckle Up, Phone Down,” part of Missouriʼs “Save MO Lives” (https://www.modot.org/buckleupphonedown)
- “Shadow Rider” in Michigan
- “ENDWI+” in New Mexico (https://www.endwi.com/)
These campaigns were selected based on:
- media types in the campaign (e.g., print, television)
- location of impressions (e.g., home, in-vehicle)
- transportation modality targeted (e.g., light/heavy vehicle drivers)
- behavior type (e.g., operator behavior, impairment)
- variety of demographics (e.g., age, gender)
- existing evaluation metrics (e.g., quantitative/qualitative analyses)
For each campaign identified, three focus groups were held. The team approached recruitment of focus group participants slightly differently for each campaign, as described in the methods section at the beginning of each case example (appendices A–D in the conduct of research report, available on nap.nationalacademies.org by searching for BTSCRP Research Report 17: Selecting Communication Channels to Deliver Traffic Safety Messaging). The 1-hour focus groups were conducted over videoconference and sought to gather qualitative insights into participantsʼ perspectives on the following topic areas related to the campaign:
- location/channels (awareness/exposure)
- knowledge/attitudes/behavior
- perceptions of campaign materials/comprehension
- message/creative feedback
- information-seeking behaviors—call to action
The team identified common themes across focus groups for each campaign and gathered publicly available information on campaign performance or requested this information from the SHSO representatives who had been interviewed. Typically, this information came from reports on campaign execution, media buy data, social media engagement, impressions, reach, and frequency. However, because this analysis relied primarily on available metrics (impressions, costs, basic outcome data), it may not fully capture all contextual factors influencing campaign performance. The types of data in the materials provided varied greatly, both across years and channels in each campaign as well as across campaigns, impacting comparability. Future evaluation would benefit from more consistent collection of media metrics data across campaigns.


