Selecting Communication Channels to Deliver Traffic Safety Messaging: A Guide (2026)
Chapter: 5 Methods for Measuring and Assessing Exposure and Behavior Change

CHAPTER 5
Methods for Measuring and Assessing Exposure and Behavior Change
Established Methods
To review campaign performance and optimize resources, it is necessary to identify the appropriate methods for measuring and assessing exposure and behavior change. This section describes measures that have been used to assess both (1) exposure to traffic safety messages and (2) the behavioral change(s) that would indicate the success of such messages, which can potentially be used to assess exposure to traffic safety messages shared by SHSOs in traffic safety campaigns. Tables 2–9 list the identified measures and definitions, as well as potential sources, a list of traffic safety messaging studies that used each measure, the context of each study, and the data collection tools or methods reported.
Crash Data
Definition: Crash data is the prime metric to evaluate campaign effectiveness. Regardless of stated intentions or behaviors, the end goal is to reduce crashes, so studies relying on crash data can be thought of as the authority on effectiveness.
Sources:
- Crash or fatality data is typically obtained through databases, hospital admissions, or medical records.
- Crash data is often expressed as either raw counts or rates (e.g., 10.2 fatal crashes per 10,000 miles driven).
Observed Behavior
Definition: Observed behavioral change in response to an intervention is a high-quality metric to evaluate a program. While intentions and self-report can be beneficial, they lack objectivity.
Sources:
- Behavior change may be measured through direct observation (either in-person or video-based).
- Actual behaviors can be measured using various metrics depending on the goals of the campaign. These metrics include seat belt use, correct use of a child seat, distracted driving, and red light running.
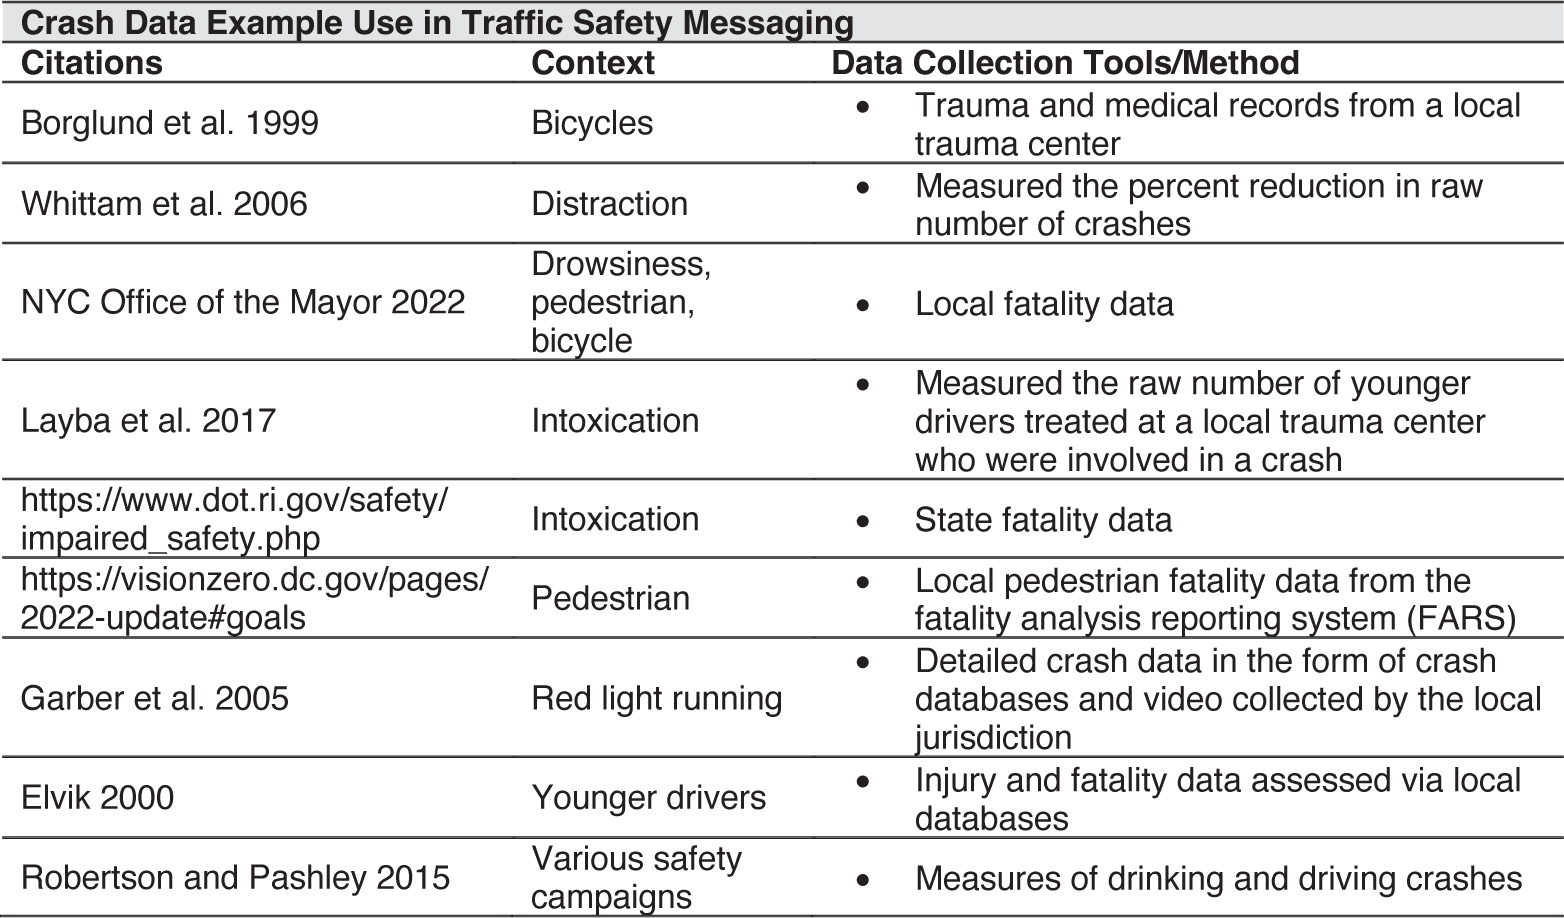
Long Description.
The table is titled Crash Data Example Use in Traffic Safety Messaging. It has 3 columns and 9 rows. The column headers are citations, context, and data collection tools or method. The row details are as follows. Row 1. Borglund et al. (1999), Bicycles, Trauma and medical records from a local trauma center. Row 2. Whittam et al. (2006), Distraction, Measured the percent reduction in raw number of crashes. Row 3: NYC office of the mayor (2022), Drowsiness, Pedestrian, Bicycle, Local fatality data. Row 4. Layba et al. (2017), Intoxication, Measured the raw number of younger drivers treated at a local trauma center who were involved in a crash. Row 5. https://www.dot.ri.gov/safety/impaired_safety.php, Intoxication, State fatality data. Row 6. https://visionzero.dc.gov/pages/2022-update#goals, Pedestrian, Local pedestrian fatality data from the Fatality Analysis Reporting System (FARS). Row 7. Garber et al. (2005), Red light running, Detailed crash data in the form of crash databases and video collected by the local jurisdiction. Row 8. Elvik (2000), Younger drivers, Injury and fatality data assessed via local databases. Row 9. Robertson and Pashley (2015), Various safety campaigns, Measures of drinking and driving crashes.
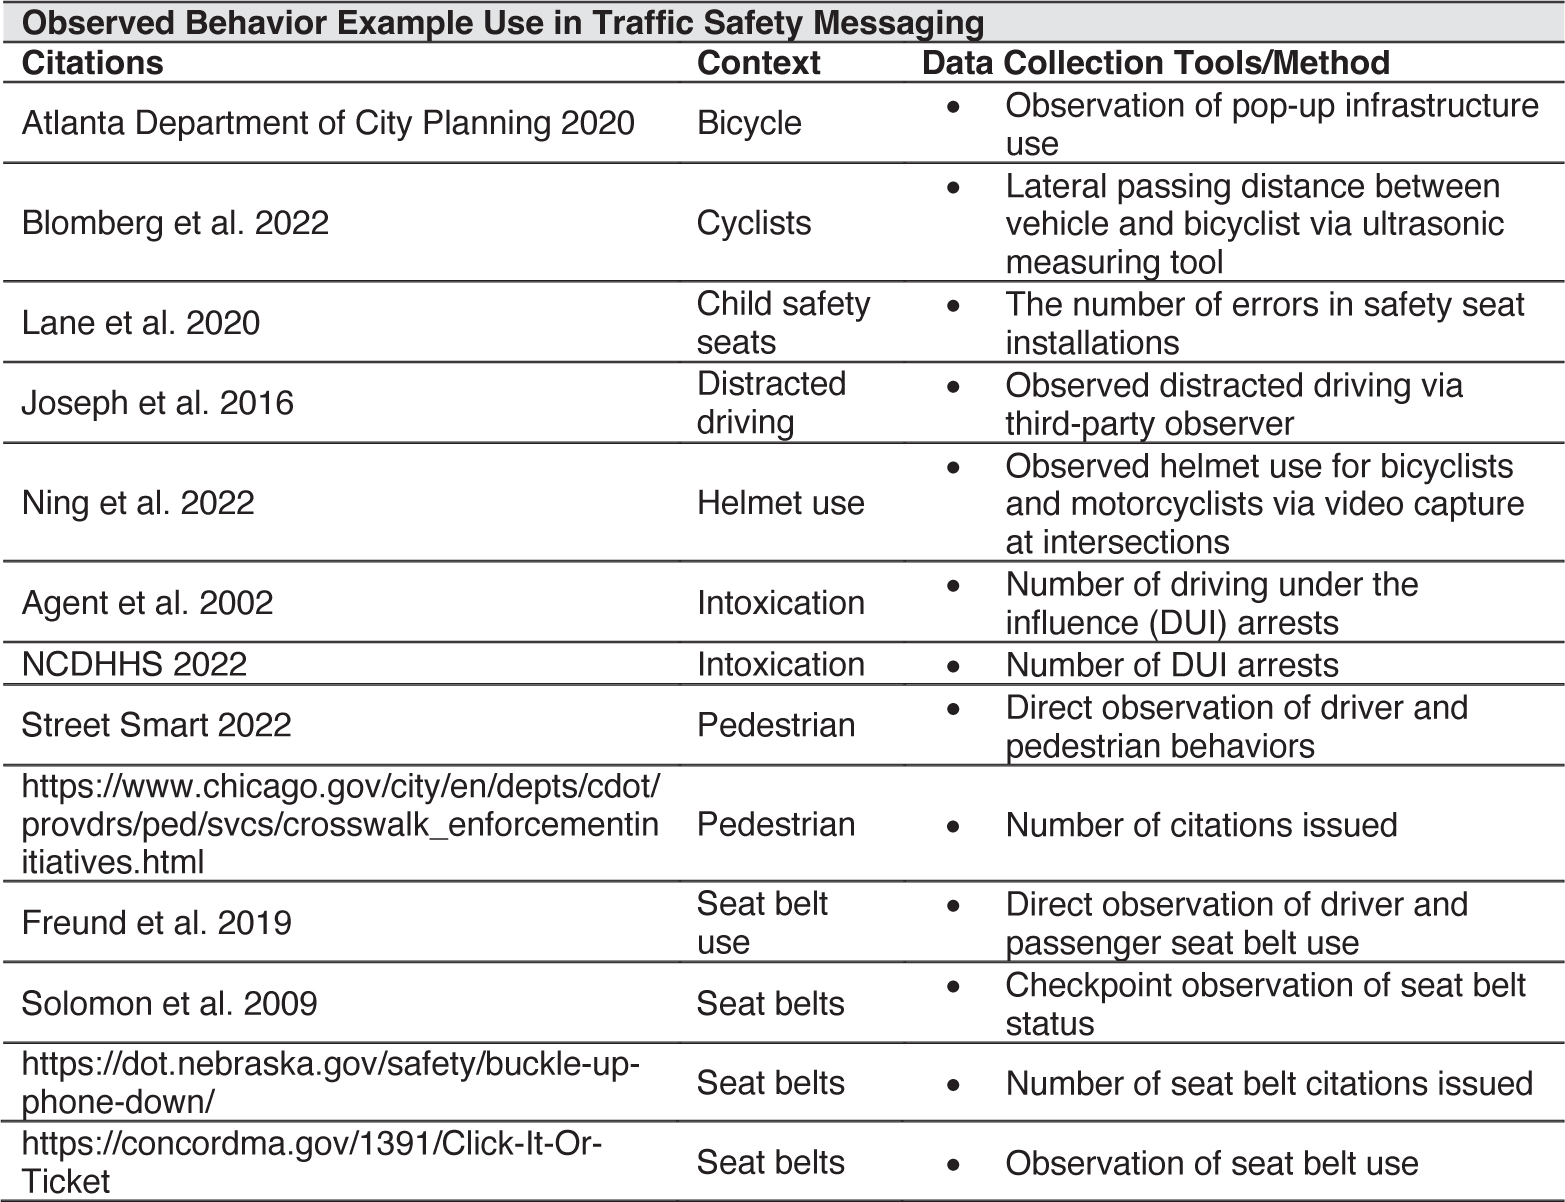
Long Description.
The table is titled Observed Behavior Example Use in Traffic Safety Messaging. It has 3 columns and 13 rows. The column headers are Citations, Context, and Data Collection Tools or Method. The row details are as follows: Row 1. Atlanta Department of City Planning (2020); Bicycle; Observation of pop-up infrastructure use. Row 2. Blomberg et al. (2022); Cyclists; Lateral passing distance between vehicle and bicyclist via ultrasonic measuring tool. Row 3. Lane et al. (2020); Child safety seats; The number of errors in safety seat installations. Row 4. Joseph et al. (2016); Distracted driving; Observed distracted driving via third-party observer. Row 5. Ning et al. (2022); Helmet use; Observed helmet use for bicyclists and motorcyclists via video capture at intersections. Row 6. Agent et al. (2002); Intoxication; Number of driving under the influence (DUI) arrests. Row 7. NCDHHS (2022); Intoxication; Number of DUI arrests. Row 8. Street Smart (2022); Pedestrian; Direct observation of driver and pedestrian behaviors. Row 9. Crosswalk Enforcement Initiative https://www.chicago.gov/city/en/depts/cdot/provdrs/ped/svcs/crosswalk_enforcementinitiatives.html; Pedestrian; Number of citations issued. Row 10. Freund et al. (2019); Seat belt use; Direct observation of driver and passenger seat belt use. Row 11. Solomon et al. (2009); Seat belts; Checkpoint observation of seat belt status. Row 12. https://dot.nebraska.gov/safety/buckle-up-phone-down/; Seat belts; Number of seat belt citations issued. Row 13. https://concordma.gov/1391/Click-It-Or-Ticket; Seat belts; Observation of seat belt use.
Self-Reported Behaviors
Definition: While direct observation of behavior change is preferable, sometimes it may not be feasible. In place, self-reported behaviors can be of value.
Sources:
- Self-reported behaviors are typically captured via survey instrument but could also result from structured interviews or focus groups.
- May be captured via Likert scale, simple yes/no responses, or through open-ended discourse.
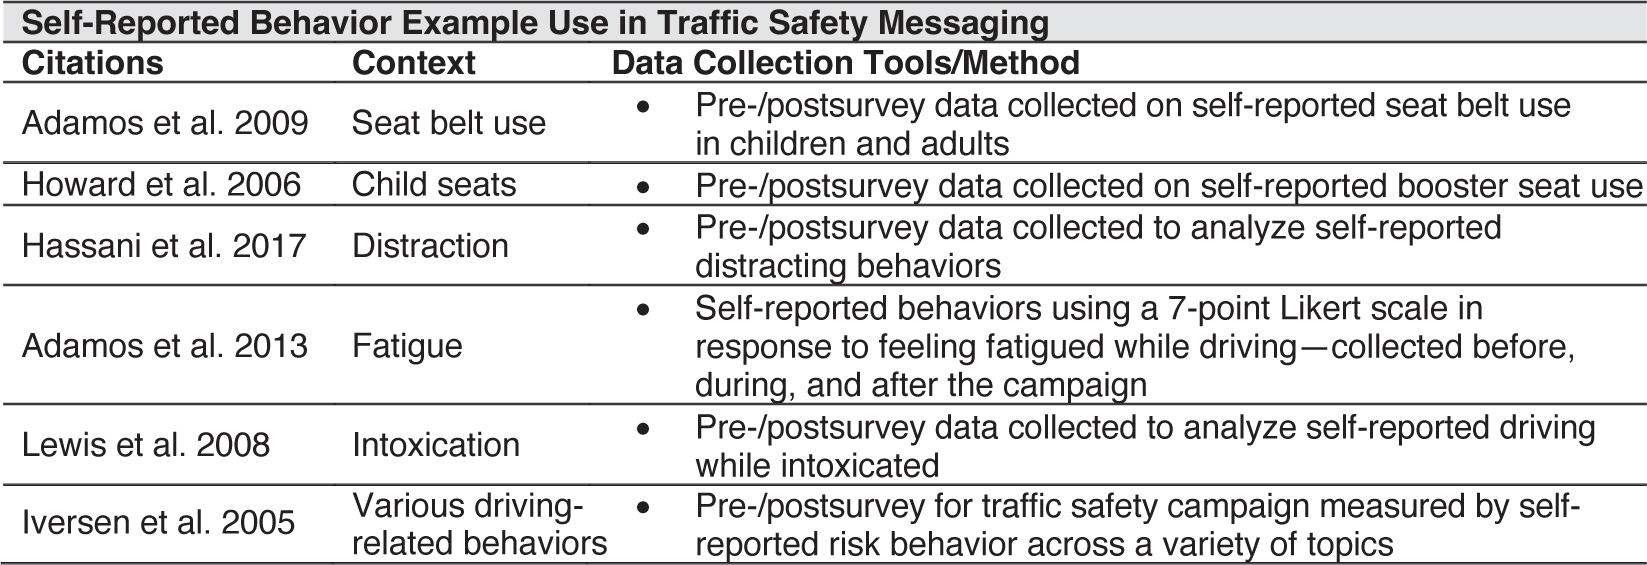
Long Description.
The table is titled Self-Reported Behavior Example Use in Traffic Safety Messaging. It has 3 columns and 6 rows. The column headers are Citations, Context, and Data Collection Tools or Method. The row details are as follows: Row 1. Adamos et al. (2009); Seat belt use; Pre and post survey data collected on self-reported seat belt use in children and adults. Row 2. Howard et al. (2006); Child seats; Pre and post survey data collected on self-reported booster seat use. Row 3. Hassani et al. (2017); Distraction; Pre and post survey data collected to analyze self-reported distracting behaviors. Row 4. Adamos et al. (2013); Fatigue; Self-reported behaviors using a 7-point Likert scale in response to feeling fatigued while driving, collected before, during, and after the campaign. Row 5. Lewis et al. (2008); Intoxication; Pre and post survey data collected to analyze self-reported driving while intoxicated. Row 6: Iversen et al. (2005); Various driving-related behaviors; Pre and post survey for traffic safety campaign measured by self-reported risk behavior across a variety of topics.
Behavior Intention
Definition: Intention to change some behavior in response to an intervention is a highly efficient metric to evaluate a program with. It allows collection from simple and cost-efficient tools without the cost and time commitment of direct observation.
Sources:
- Behavior intentional change can be measured through Q&A means such as surveys, in-person interviews, and focus groups.
- Intentions are typically measured through some form of Likert scale (e.g., marking “strongly agree” to a survey item posed about reduction in some negative behavior).
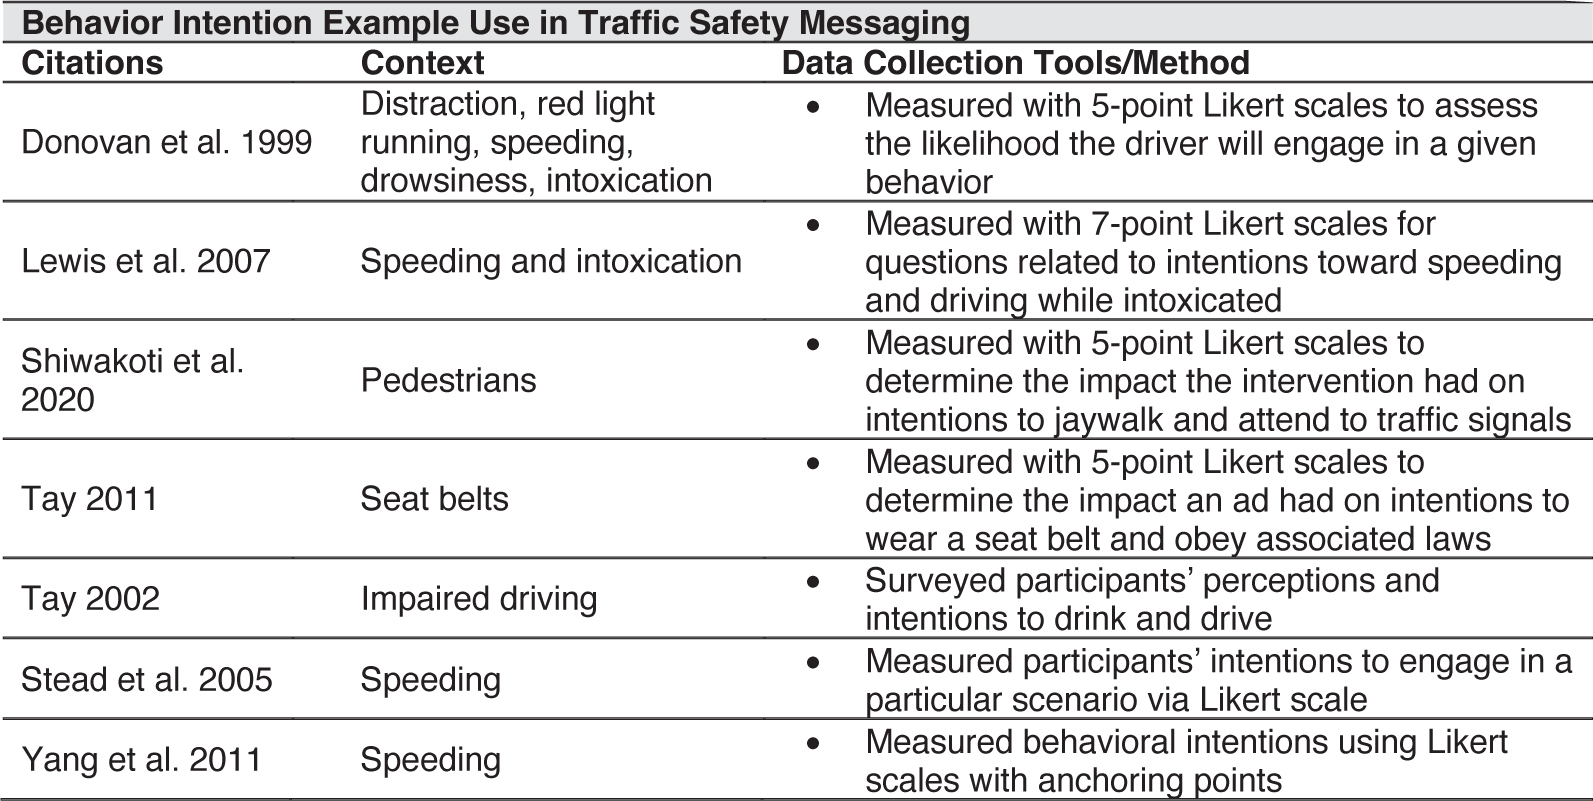
Long Description.
The table is titled Behavior Intention Example Use in Traffic Safety Messaging. It has 3 columns and 7 rows. The column headers are Citations, Context, and Data Collection Tools or Method. The row details are as follows: Row 1. Donovan et al. (1999); Distraction, red light running, speeding, drowsiness, intoxication; Measured with 5-point Likert scales to assess the likelihood the driver will engage in a given behavior; Row 2. Lewis et al. (2007); Speeding and Intoxication; Measured with 7-point Likert scales for questions related to intentions toward speeding and driving while intoxicated; Row 3. Shiwakoti et al. (2020); Pedestrians; Measured with 5-point Likert scales to determine the impact the intervention had on intentions to jaywalk and attend to traffic signals; Row 4. Tay (2011); Seat belts; Measured with 5-point Likert scales to determine the impact an ad had on intentions to wear a seat belt and obey associated laws; Row 5. Tay (2002); Impaired driving; Surveyed participants’ perceptions and intentions to drink and drive; Row 6. Stead et al. (2005); Speeding; Measured participants’ intentions to engage in a particular scenario via Likert scale. Row 7. Yang et al. (2011); Speeding; Measured behavioral intentions using Likert scales with anchoring points.
Knowledge/Awareness
Definition: Assesses the participantʼs level of knowledge of a particular safety campaign or issue.
Sources: Assessing the level of knowledge and/or awareness of a safety campaign or materials is typically done via survey assessment or interview.
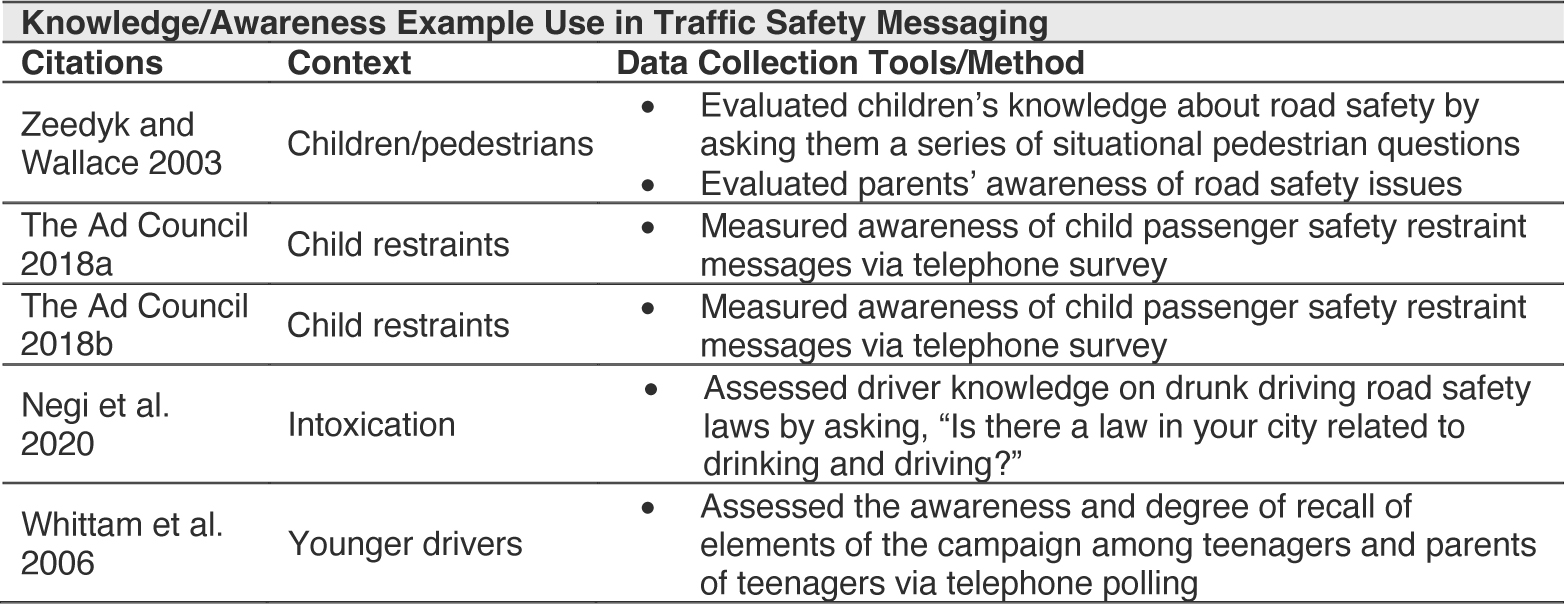
Long Description.
The table is titled Knowledge/Awareness Example Use in Traffic Safety Messaging. It has 3 columns and 5 rows. The column headers are Citations, Context, and Data Collection Tools or Method. The row details are as follows: Row 1. Zeedyk and Wallace (2003); Children and Pedestrians; Evaluated children’s knowledge about road safety by asking them a series of situational pedestrian questions. Evaluated parents’ awareness of road safety issues. Row 2. The Ad Council (2018a); Child restraints; Measured awareness of child passenger safety restraint messages via telephone survey. Row 3. The Ad Council (2018b); Child restraints; Measured awareness of child passenger safety restraint messages via telephone survey. Row 4. Negi et al. (2020); Intoxication; Assessed driver knowledge on drunk driving road safety laws by asking, “Is there a law in your city related to drinking and driving?” Row 5. Whittam et al. (2006); Younger drivers; Assessed the awareness and degree of recall of elements of the campaign among teenagers and parents of teenagers via telephone polling.
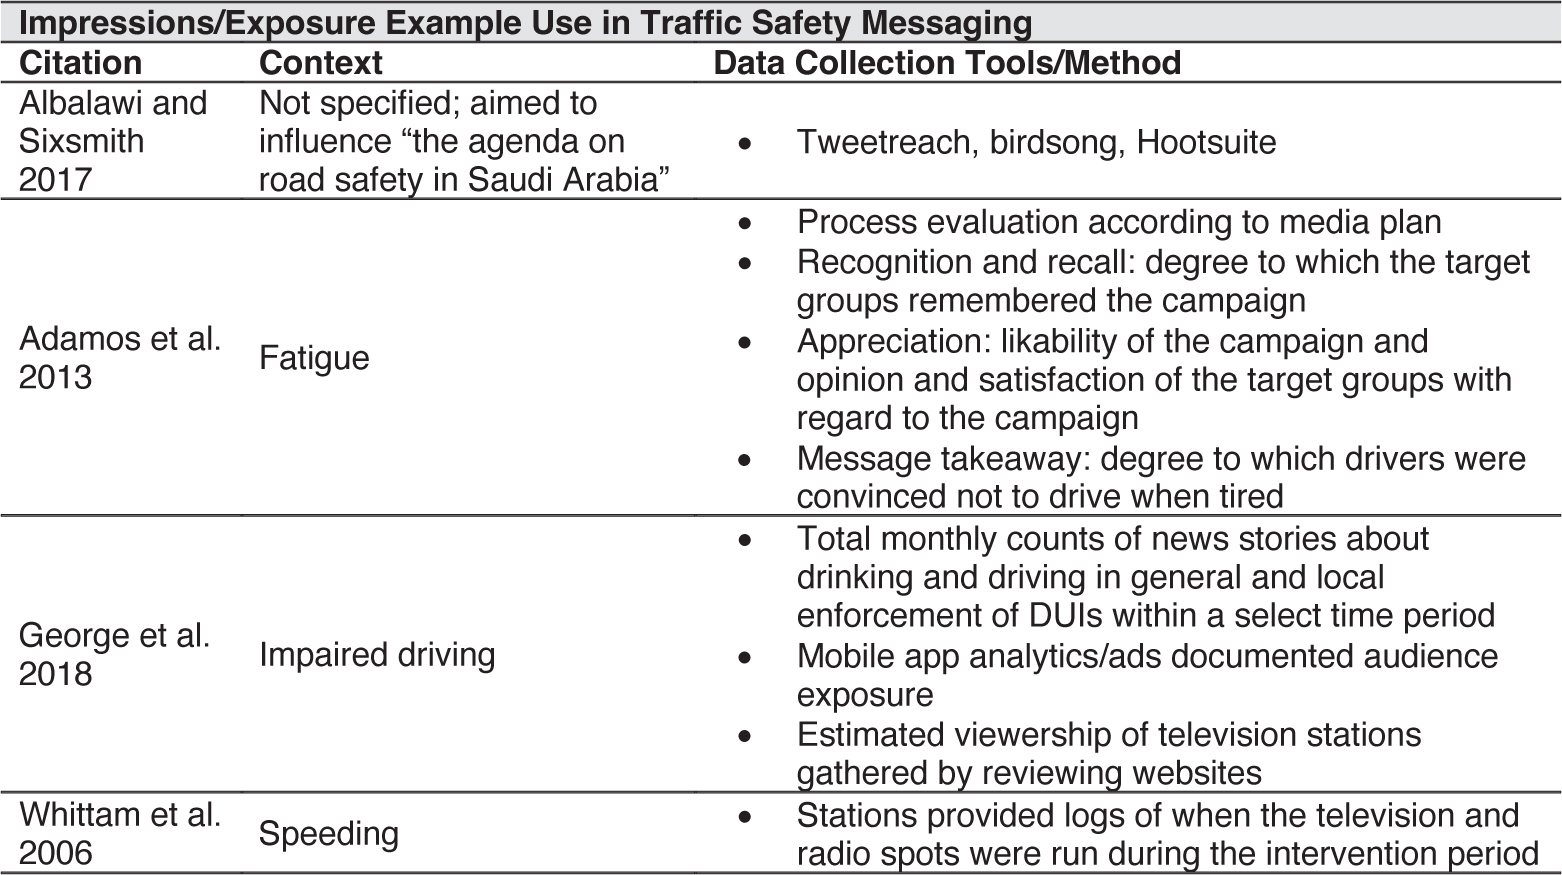
Impressions/Exposure
Definition: How many times campaign content was shared with audience members, broken down by channel, and whether these impressions were paid, earned, or organic. The extent to which audience members encountered specific messages or classes of messages/media content. Exposure refers to a person merely encountering the messages, regardless of whether the content was noticed enough to be remembered.
Sources: Sources include social media consumption (e.g., number of tweets distributed to a specific audience, Facebook) and ad exposure.
(continued on next page)
Long Description.
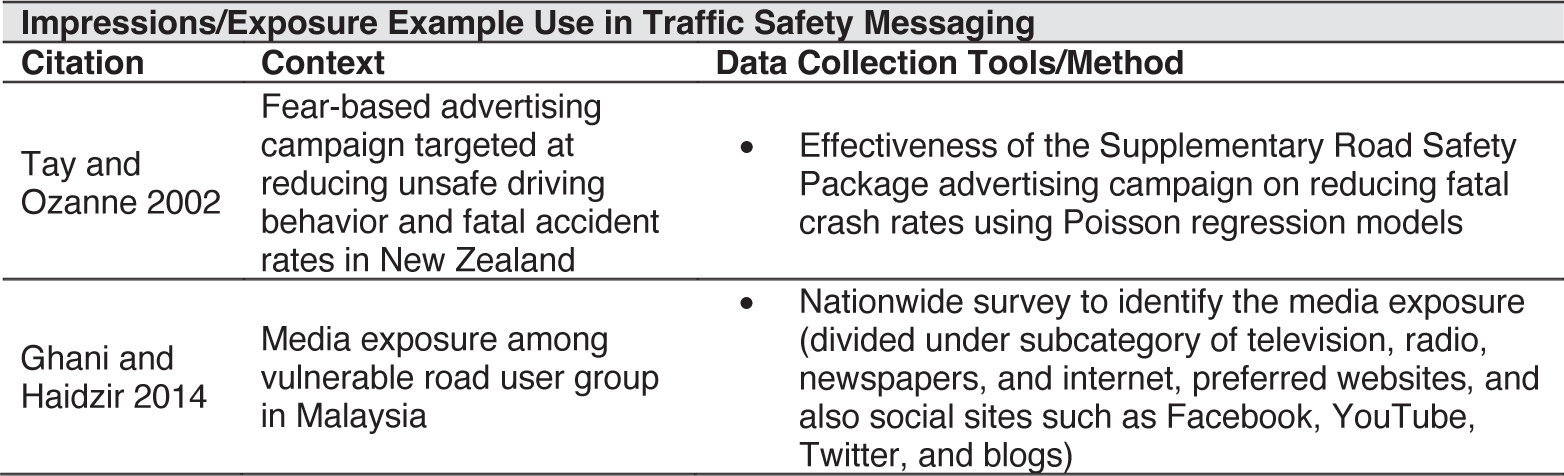
The table is titled Impressions or Exposure Example Use in Traffic Safety Messaging. It has 3 columns and 6 rows. The column headers are Citations, Context, and Data Collection Tools or Method. The row details are as follows: Row 1. Albalawi and Sixsmith (2017); Not specified, aimed to influence “the agenda on road safety in Saudi Arabia"; Tweetreach, birdsong, Hootsuite. Row 2. Adamos et al. (2013) ; Fatigue; Process evaluation according to media plan. Recognition and recall: degree to which the target groups remembered the campaign. Appreciation: likability of the campaign and opinion and satisfaction of the target groups with regard to the campaign. Message takeaway: degree to which drivers were convinced not to drive when tired. Row 3. George et al. (2018); Impaired driving; Total monthly counts of news stories about drinking and driving in general and local enforcement of DUIs within a select time period. Mobile app analytics or ads documented audience exposure. Estimated viewership of television stations gathered by reviewing websites. Row 4. Whittam et al. (2006); Speeding; Stations provided logs of when the television and radio spots were run during the intervention period. Row 5. Tay and Ozanne (2002); Fear-based advertising campaign targeted at reducing unsafe driving behavior and fatal accident rates in New Zealand; Effectiveness of the Supplementary Road Safety Package advertising campaign on reducing fatal crash rates using Poisson regression models. Row 6. Ghani and Haidzir (2014); Media exposure among vulnerable road user group in Malaysia; Nationwide survey to identify the media exposure, divided under subcategory of television, radio, newspapers, and internet, preferred websites, and also social sites such as Facebook, YouTube, Twitter, and blogs.
Reach
Definition: Projected or actual number of unique members of a designated audience who viewed the campaign content at least once within a given time period via a given channel.
- For print, broadcast, outdoor, and transit media, reach is calculated as a percentage of audience members who are expected to have been exposed based on ongoing research.
- For online/digital/mobile media, reach represents actual data per engagement (e.g., clicks, page views, time on page, posts, tweets, likes, shares).
Sources: Sources include circulation data for print media, viewership/listenership figures for broadcast, daily effective circulation (a measure of nearby traffic in viewing distance) for outdoor media, ridership for transit, and engagement (clicks, opens, retweets, likes, and other reactions) and followership for online/digital/mobile/social media.
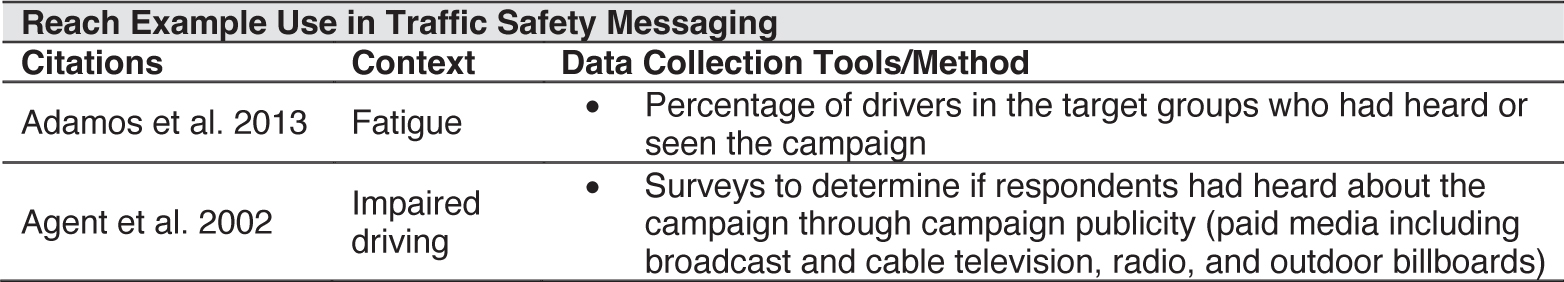
Long Description.
The table is titled Reach Example Use in Traffic Safety Messaging. It has 3 columns and 2 rows. The column headers are Citations, Context, and Data Collection Tools or Method. The row details are as follows: Row 1. Adamos et al. (2013); Fatigue; Percentage of drivers in the target groups who had heard or seen the campaign. Row 2. Agent et al. (2002); Impaired driving; Surveys to determine if respondents had heard about the campaign through campaign publicity (paid media, including broadcast and cable television, radio, and outdoor billboards).
Frequency
Definition:
- Average number of times any one audience member is exposed to campaign content over a given period
- Associated with reach
Sources: Sources include counts of news stories distributed, number of TV ads seen, frequency and timing of campaign messaging seen by audiences, number of radio ads, websites visited, blogs visited, etc.
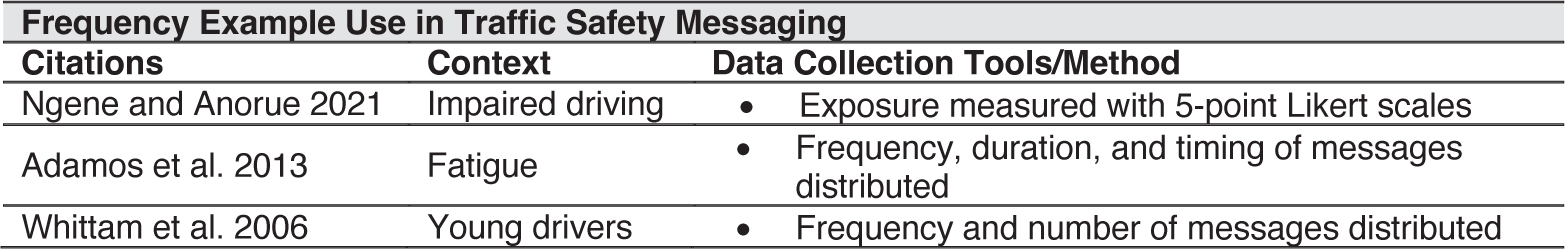
Long Description.
The table is titled Frequency Example Use in Traffic Safety Messaging. It has 3 columns and 3 rows. The column headers are Citations, Context, and Data Collection Tools or Method. The row details are as follows: Row 1. Ngene and Anorue (2021); Impaired driving; Exposure measured with 5-point Likert scales. Row 2. Adamos et al. (2013); Fatigue; Frequency, duration, and timing of messages distributed. Row 3. Whittam et al. (2006); Young drivers; Frequency and number of messages distributed.
Emerging Measures
The findings below list new measures and definitions identified through the literature review, potential sources, traffic safety messaging studies that used each measure, the context of each study, and data collection tools or methods.
Conversion
Definition:
- The percentage or measure of how many people clicked an ad to visit a website or webpage
- Number of likes on social media post
Sources: Sources include the rates of impressions for a specific component of the campaign (e.g., website, blog, social media page).
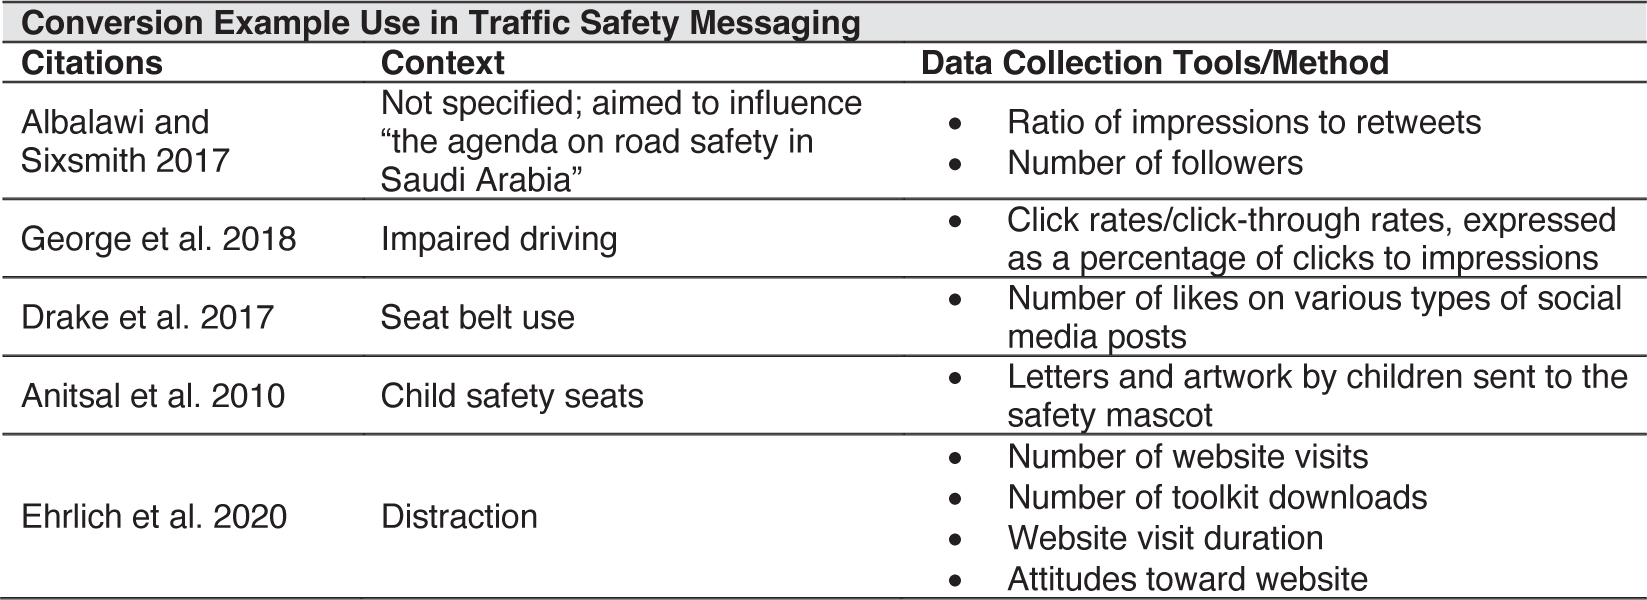
Long Description.
The table is titled Conversion Example Use in Traffic Safety Messaging. It has 3 columns and 5 rows. The column headers are Citations, Context, and Data Collection Tools or Method. The row details are as follows: Row 1. Albalawi and Sixsmith (2017); Not specified, aimed to influence “the agenda on road safety in Saudi Arabia"; Ratio of impressions to retweets. Number of followers. Row 2. George et al. (2018); Impaired driving; Click rates or click-through rates, expressed as a percentage of clicks to impressions. Row 3. Drake et al. (2017) ; Seat belt use; Number of likes on various types of social media posts. Row 4. Anitsal et al. (2010); Child safety seats; Letters and artwork by children sent to the safety mascot. Row 5. Ehrlich et al. (2020); Distraction; Number of website visits. Number of toolkit downloads. Website visit duration. Attitudes towards website.


