Developing a Guide for Incorporating Uncertainty into Long-Range Transportation Planning (2026)
Chapter: Appendix C: Case Studies
Contents
Screening and Prioritization Approach
Planning and Analysis Activities
Outcomes, Recommendations, and Implementation
Lessons Learned: Gaps and Opportunities
Hampton Roads TPO Long-Range Planning and Prioritization
Planning and Analysis Activities
Outcomes, Recommendations, and Implementation
Lessons Learned: Gaps and Opportunities
Hawaii Highways Climate Insights for Infrastructure
Planning and Analysis Activities
Outcomes, Recommendations, and Implementation
Lesson Learned: Gaps and Opportunities
Planning and Analysis Activities
Introduction
Case Study Objectives
The goal of the Task 3 case studies was to focus on “deep discovery” within examples of state DOT and MPO approaches to managing uncertainty. Through each case, we sought to understand the impacts of these approaches on decision-making and operations and to identify lessons learned, including gaps in practice. This supplements the broad picture of practice and knowledge developed through the questionnaire and focus groups in Task 2.
Screening and Prioritization Approach
We worked through case screening and prioritization in a phased approach. First, all case examples provided by questionnaire respondents were extracted and passed through an initial filter to screen out examples that either:
- Lacked sufficient information, or
- Represented efforts that were in progress and thus unlikely to yield lessons learned.
Next, we reviewed the case descriptions provided by respondents and examined at a high level the reference documents provided. Based on this, cases were organized with the following key information:
- Agency type (State DOT, MPO)
- State location
- Urban/rural mix of agency service area
- Reported mix of qualitative and quantitative approaches to uncertainty
- Type of planning effort involved (e.g., LRTP, STIP, modal plan, other)
- Degree of multimodal coverage
- Notable partnerships mentioned (e.g., multiple agencies, across different divisions within an agency)
- Identifiable connection between assessments of uncertainty and investment priorities
The team reviewed the above to prioritize cases demonstrating variety across these dimensions. Additionally, the team worked collaboratively to also prioritize cases that:
- Demonstrated experience with more than one approach or attempt towards planning for or managing uncertainty (e.g., in multiple cycles of planning)
- Showed evidence of reflection on discoveries or adaptation
Summary of Selected Cases
Table 1 summarizes the case studies. They include examples of state DOTs and MPOs working in a variety or urban and rural contexts, with varying levels of technical complexity.
Table 1. Summary of Case Studies
| Organization | State | Area Type | Project Title | Agency Type | Plan Type(s) | Description |
|---|---|---|---|---|---|---|
| Hawaii Department of Transportation, Highways Division | HI | Urban/Rural mix | Hawaii Highways Climate Insights for Infrastructure | State DOT | HDOT’s Highways Division Climate Adaptation Action Plan |
|
| Alaska Department of Transportation & Public Facilities | AK | Urban/Rural mix (much is quite rural) | Alaska Moves 2050 | State DOT | Long-Range Transportation Plan (LRTP) and Freight Plan |
|
| Ohio Department of Transportation | OH | Urban/Rural mix | Access Ohio 2045 | State DOT | Long-Range Transportation Plan (LRTP) |
|
| Hampton Roads TPO (HRTPO) | VA | Urban/Rural (Urbanized area) | Hampton Roads 2045 | MPO | Long-Range Transportation Plan (LRTP) |
|
Case Study Process
The case study research process proceeded as follows:
- Reach out to agency point of contact to confirm interest in participating and schedule initial coordination call.
- Identify and review documentation/resources provided by agency in questionnaire, develop initial notes inside case summary template.
- Develop workshop materials/discussion guides.
- Hold initial coordination call with agency point of contact to:
- Confirm general understanding of what happened in the case.
- Identify who should participate in the workshop. Seek to include individuals with knowledge of the specific planning effort, including (a) overall structure and goals (b) methods, data, and tools employed (c) stakeholder or partner engagement; and (d) implementation.
- Schedule and convene remote workshop with these identified staff.
- Develop a case summary, including lessons learned.
Workshop Learning Objectives
The following workshop learning objectives were developed by the team and shared with the workshop participants to help prime the dialogue. In addition, customized slides were developed for each workshop.
Organizational Learning
Can we identify lessons learned such as:
- Observations on what has worked and what hasn’t, and why.
- Agency iteration and refinement of approach based on experience (for example, how well suited were the selected approaches and level of analysis to the question at hand?)
- Discoveries or “ah-ha” moments including finding root causes, unintended consequences, or solving problems as a result of their efforts/methods.
- Degree of confidence in approach and resulting insights
- Impacts of agency efforts on the ability to adapt or improve their plans and/or planning approach.
Staff Capacity
- How prepared were staff for this planning exercise process?
- What would have helped them do better?
- How has this work changed the culture or skills within the organization?
Implementation
- How has the learning from this process been put into action? (Note: learning might include specific findings within a plan or broader findings related to making planning more effective, in general)
- Did you modify or adjust your investment strategy or project selection?
- Were results communicated internally, externally? To whom? With what goal?
- Are there things you are now tracking or monitoring now to help you manage uncertainty going forward?
Exchange Points
We are seeking to understand “exchange points” in the planning process and their relationship to an organization’s flexibility to account for uncertainty. There are different exchange points – analogous to passing the baton in relay races – in state DOT and MPO LRTP development and implementation that may cause a perfectly crafted plan to fail in execution, because of failure to pass the baton. Well-crafted and well-timed points of coordination can drive success. These exchange points include interactions between staff, parts of an organization, and with stakeholders or partner organizations, as well as information flows between systems. Each must be strategically examined, nurtured, and strengthened to allow for successful adoption of processes, systems, and knowledge to address uncertainty.
Considering the following bulleted topics, what were they critical “exchange points” or interactions in this effort? What worked well? What didn’t? What could you change to make things work better in the future?
- Organizational readiness and alignment (e.g., between departments or processes)
- Alignment of technical processes or systems
- Stakeholder or partner engagement
- Management or decision-maker engagement
- Workforce development / training
Case Study Summarization
The following chapters summarize key findings across the four case studies and provide details for each individual example. Each individual case writeup is structured to:
- Provide background on the example, including the motivation for considering uncertainty and key questions addressed by the effort.
- Outline planning and analysis activities undertaken to address uncertainty, including discussion of data, methods, and tools used in the process.
- Describe outcomes of the effort including recommendations identified and status with respect to a range of implementation activities.
- Summarize lessons learned, including distillation of gaps in practice and opportunity areas for future improvement.
Summary of Key Findings
The case examples discussed reveal several insights about how agencies plan for and manage uncertainty, including impacts on decision-making and operations, and lessons learned that could benefit other transportation organizations conducting similar efforts in the future. Overall, the individual agency experiences demonstrate that engaging with uncertainty can be a catalyst for unearthing necessary process improvements that were already important even without uncertainty at issue, and further amplifying them. Specific insights derived from the cases include:
Planning for uncertainty accentuates existing needs to connect long-range planning to programming.
Long-range plans provide a key opportunity to consider sources of uncertainty in future transportation needs and performance. As such, they can produce insights on important departmental priorities. However, there is more work to be done to connect planning recommendations to project-level decision-making and prioritization.
Alaska DOT, for example, created policy level recommendations from its scenario process. Connecting these insights to investment decisions is a work-in-progress and part of the department’s overall effort to be more performance- and data-driven in planning.
Ohio DOT did create an Implementation Plan following its scenario based LRTP that grouped actions into four categories: Monitor, Accelerate, Launch, and Defer. For the first three, the agency has designated points of responsibility within the organizations to track and report annually. The agency would like to move towards project-based long-range planning in the future and has found that stakeholders increasingly ask for this. This will require new levels of coordination with Districts and other Divisions within the organization, as well as MPO planning partners. There is no uniform mechanism for allocation of funding and prioritization of resources across the department.
The Hawaii DOT Highways Division effort occurred outside long-range planning, but the resilience tool and associated data are intended to inform upcoming planning as well as specific project-level design decisions. Implementation will require the planning office to communicate and train about the developed tool and how it can and should support specific decisions by district engineers or others in the agency.
Finally, HRTPO, as an MPO, is required to develop a long-range plan that includes a fiscally constrained prioritized project list. Performance of individual projects under multiple scenarios is
formally incorporated into the scoring and ranking of projects. Inclusion in the LRTP is then a precondition for funding regionally significant projects within the TIP. Going forward, the organization is hoping to build upon prior work, leverage automation, and otherwise streamline the process to help manage and mitigate the significant resources required to analyze and score many projects under multiple future scenarios.
Data management and technical capacity is a challenge for agencies and key to facilitating and perpetuating institutional learning.
All four case study agencies described challenges related to data management and technical capacity and emphasized the importance of building these capabilities both to support analysis of uncertainty, and to disseminate and share information across an organization and with planning partners. Spatial analytics and data, in particular, is very important to investigating differential impacts of potential future changes across various geographic areas.
In Alaska, consideration of uncertainty affirmed a need to develop additional capacity for data management. The agency identified the need to manage data consistency, including how data can be shared across departments and updated based on clearly defined data ownership, rather than generating multiple versions of conflicting information. Consideration of uncertainty also reemphasized the need to advance performance monitoring activities.
In considering implementation of its scenario insights, Ohio DOT is very interested in ways to produce, package, and deliver data sets or information to its districts, agency divisions, and planning partners. The goal is to achieve economies of scale in sharing learned insights. Rather than creating more burden with additional things to consider, ODOT planning seeks to save others time and effort and alleviate the staffing burden of needing to have experts on-hand covering various drivers of change and sources of uncertainty. The department has a strong record of working to keep modeling tools, data, and procedures consistent across the state and can build on this foundation. ODOT is also beginning to consider the idea of a single database of projects across MPOs/RTPOs. At present, understanding planned investments requires manual review of individual planning documents. Finally, data itself is a source of uncertainty, with so many new and emerging data sets, many of them producing large volumes of data that must be managed and leveraged.
Hawaii DOT’s resilience efforts foregrounded limitations in GIS capacity within the agency, as well as the need to enhance the feedback loop between data collected by staff in the field and information maintained centrally. A key focus of the department is creating shared platforms that can be used at multiple levels within the organization. The department also identified the importance of connecting with outside expertise and other government agencies with specialized knowledge, such as the US Geological Survey, the Hawaii Office of Planning GIS program, and the International Pacific Research Center, a climate research center.
HRTPO staff reflected on the significant additional effort required to incorporate scenario planning into the long-range plan and project prioritization. While the agency staff see significant
value in being able to stand behind and justify investment decisions, they are looking for ways to reduce effort going forward. They emphasized the importance of exploring uncertainty within the tools and processes already in place within the agency such as the project scoring process and the travel demand model. One avenue towards managing level of effort and avoiding too much iteration or “redo” is to work to secure buy-in early from its decision-makers on the scenario planning framework and project evaluation criteria. HRTPO is actively investing in automation for data processing to limit burden on staff time and working to better align data across departments or within other planning partners. Like Alaska DOT, they describe issues of inconsistency between similar metrics produced by different processes. Like Hawaii DOT, their engagement with uncertainty planning led to more proactive conversations around GIS data management and sharing.
In all cases, data management is closely tied to staff related challenges. Agencies often have a small number of planning staff with varying degrees of experience with data and capacity to rapidly analyze and combine multiple data sources. Staff retention also presents issues for knowledge retention and can cause an organization to need to “begin again” if there is insufficient knowledge transfer, training, and documentation of procedures. As such, the case study agencies report a focus both on training and retention efforts and on better systematizing and documenting methodological procedures.
There are multiple outcomes and avenues towards implementation of knowledge gained from considering uncertainty.
Engaging with issues of uncertainty can point to a variety of actions and strategies that can be implemented within agency operations. These include supporting prioritization of projects; generating information to support adaptive design; identifying trends that require tracking; recognizing issues that entail communication and coordination with decision-makers, stakeholder, and planning partners; as well as revealing the need for enhancement of technical and workforce capacity. Because sources of uncertainty are diverse, there is no single outcome that can be expected of a planning effort that engages with uncertainty. For this reason, it is important for agencies to think through how their analysis or planning efforts might impact different parts of the decision-making process or operations, and to target outcomes to their desired areas of impact.
In Alaska, the DOT realized that their regions are key partners for implementation of identified strategies, but that they have varied levels of organization and capacity. As a result, the DOT is engaging with both the development of new regional organizations (including through DOT funding support), and in capacity building to support on-the-ground implementation.
In Hawaii, the HDOT Highways Division is working to incorporate findings on potential impacts of climate change into the design process. This includes consideration of adaptive design solutions, development of a design checklist, and in some cases the implementation of temporary bridges
as interim solutions while ongoing planning efforts grapple with how and where organized retreat from sea level rise may occur.
In Hampton Roads, as described above, uncertainty is directly incorporated into project scoring. In this case, the agency found that presenting multiple metrics across multiple scenarios was too much detail and risked confusion by the public and elected officials. Instead, they opted to present average scores and rankings across scenarios. Other less measurable but equally important outcomes of the effort include the ability to communicate to stakeholders that varying issues and trajectories that might affect the region were addressed in the planning process. Rather than being held to one forecast, HRTPO saw the value in being able to acknowledge and incorporate various issues that are of concern to their public and elected officials. Additional avenues towards implementation include supporting localities within the region in incorporating scenarios into their comprehensive plans, through provision of data and expertise. Efforts to engage with sea level rise also resulted in ongoing efforts to improve available infrastructure elevation data which is critical to identifying flooding risk.
Ohio DOT leveraged its scenario planning process both to support policy-level dialogue around funding and to identify specific strategies and actions. In addition to the Implementation Plan described above, the DOT modeled funding needs under different scenarios. By bounding the range of needs under a wide variety of future conditions rather than providing a single number that is subject to criticism, the agency was able to more effectively engage in conversations with decision-makers around available funding mechanisms, including issues related to the diminishing value of the gas tax. Based on analysis of emerging technology trends, DOT staff describe the need for ongoing engagement with technology companies such as through the Drive Ohio initiative.1 They also commented that in some cases, analysis highlighted ways in which the DOT should avoid being “locked in” to a particular technology solution before the market has matured.
Considering uncertainty can broaden the lens of planning and cause an agency to explore new issues, grow their knowledge, and engage with new stakeholders and partners.
As agencies engage with sources of uncertainty, many of them outside the purview of traditional engineering and planning, they often must seek information from new sources. This process can strengthen linkages within an agency and between an agency and their partners, which has the potential to enhance responsiveness of a department to change.
During development of their LRTP, Alaska DOT identified the need for more focused engagement efforts. Because of the geographic focus of their scenario efforts to identify impacts on different parts of the state, the planning effort highlighted gaps in input, particularly from more rural and remote communities.
___________________
HRTPO experienced an unanticipated benefit of the scenario planning process: their call for projects received far more public interest and input than in prior planning cycles. Staff also reflected on how scenario planning forced increased coordination and dialogue between different parts of regional government focused on transportation, land use, economics, resilience, and water resources. On the resiliency front, the scenario planning process instigated new levels of coordination with the Hampton Roads Planning District Commission and Virginia DOT around impacts of sea level rise and related data requirements to support analysis.
Beyond identification of discrete actions, Ohio DOT staff identified considerable value in the conversations that occurred as part of the scenario planning process. ODOT placed a heavy emphasis on stakeholder engagement, including internal engagement within the DOT, with the steering committee, and with districts and regions. By initiating conversations around uncertainty, the plan provides an opportunity to educate stakeholders, and support ODOT partners in being able to articulate shared concerns and leverage shared knowledge. Because decision-making is distributed across many divisions, programs, and regional partners, this knowledge creation and transfer role is not necessarily about controlling decisions. Rather, it is about putting forth a more strategic agenda that can be focused upon by program managers or others in the state to address uncertainty.
Finally, HDOT Highway’s tool development process yielded a new level of focus on partnering both inside the agency with district staff and with external organizations, to be able to share and update the most current asset and climate conditions data.
Agile planning requires agencies to build stronger cyclical linkages between planning activities and across departments and organizations.
Long-range planning has always been inherently uncertain. Our cyclical planning process is designed to revisit assumptions and trends every few years. However, current and emerging efforts at managing uncertainty are encouraging agencies to become even more focused on the iterative nature of planning and to seek opportunities to be more agile and responsive to change. Timing is a key challenge, both in understanding the timeline of impact for different types of uncertainty, and in managing and coordinating the data that are generated when tracking or forecasting change across different planning efforts.
Following completion of Alaska Moves 2050, the DOT is considering how to coordinate a “family of plans” as a more integrated whole, with cyclical procedures for updating and sharing information and knowledge between planning activities. Similarly, HRTPO is working to line up other efforts better with the LRTP (the timing of which is constrained by federal requirements) to better facilitate information flow between plans.
All four case agencies recognize that dissemination of information and bridging knowledge gaps within and between departments is key. To advance from planning to implementation requires that organizations translate insights into direction or information for specific groups or staff within a department or at partner organizations, particularly MPOs and RPOs. This also requires
organizational self-reflection around how planning and programming relate, in general, not just in the context of uncertainty.
Alaska Moves 2050
Background and Motivation
The topic of uncertainty has been “top of mind” at the Alaska DOT in recent years. The COVID-19 pandemic, natural disasters, and other recent events have made clear just how quickly circumstances can change and make previous assumptions used for transportation plans outdated. The agency wanted to adopt a more flexible planning methodology that could act as a “playbook”, considering a variety of different possible futures that Alaska may face and factoring these into long-range planning. The agency looked toward the Federal Highway Administration’s (FHWA) instructions for planning, which encourage the use of scenario planning. The DOT decided to pursue scenario planning in its long-range planning processes and, with the help of their consultant, assembled an inhouse team to explore the greatest factors of change that may impact Alaska’s transportation network and how to consider these in future transportation plans and goals.
The scenario planning team, which included a technical advisory committee (TAC) and Statewide Transportation Advisory Committee (STAC) made up of DOT staff from multiple agency departments (planning, maintenance, design and construction, etc.), sought to explore what different trends and events could reasonably happen in the future, and how to establish goals and objectives that consider them. Additionally, the DOT considered how different types of communities throughout the state could be impacted by possible future factors.
In developing and adopting a scenario-based planning approach, the DOT has been guided by three overarching goals:
- Inform community members and decision-makers on what the future could look like based on the need to address emerging trends, impacts of external forces, and concerns about future uncertainties.
- Prompt creative thinking and shared problem-solving to identify different strategies that are needed to plan for a more resilient future.
- Help to build consensus for a decision or plan adoption based on shared knowledge exchange, tradeoff discussions, and consideration of multiple “what if” futures.
Planning and Analysis Activities
The first instances of the Alaska DOT employing scenario planning in their work were in the Alaska Moves 2050 LRTP and the Strategic Freight Plan. The TAC, STAC, and a Freight Advisory Committee (FAC) provided overall guidance and input for these efforts.
The DOT’s process for scenario planning in Alaska Moves 2050 followed four steps: (1) Define place typologies across the state, (2) identify key drivers of change, (3) Define distinct plausible futures, and (4) Conduct spatial analysis of scenario impact by place typology.
The DOT first divided Alaska into five place typologies defined by levels of transportation connectivity or access to better analyze the disparate impacts of possible futures on different types of communities. The place typologies include:
- Urban: large communities located on the [state] roadway network and with multiple modes of access.
- Rural: small communities located on the roadway network.
- Isolated Urban/Rural: smaller communities not located on the roadway network but with multiple modes of access.
- Remote: small communities not located on the roadway network, with a single primary access mode.
- Isolated Remote: small communities located 30 miles or more from the roadway network, an airport, or port.
Next, the TAC and STAC identified the key drivers of change that are likely to influence the future transportation network by impacting transportation performance, demand, needs, funding, and life-cycle costs. Through a qualitative process, the committees identified the top sources of uncertainty as economic growth, funding, and workforce availability. According to Alaska Moves 2050, published in June 2022, other sources of uncertainty considered in the scenario planning process include connectivity, emerging technology, climate change, and population.
After establishing the key drivers of change, the DOT identified three distinct plausible future scenarios. These scenarios include:
- Full Speed Ahead: economic growth across various sectors requires new transportation infrastructure, funding sources, and a skilled workforce to meet demand.
- Cruising: business as usual – economy and population continue to grow at a low rate, and demand for transportation infrastructure is largely unchanged.
- Powering Down: economy stagnates, funding is unstable, declining population and workforce. Transportation maintenance is deferred, and mobility becomes unreliable.
Lastly, the scenario planning team used GIS to analyze available data under each scenario to visualize potential changes to the transportation network and how these changes impact different place typologies throughout the state (Figure 1). Key data inputs used in this exercise came from existing DOT sources and included population and employment projections, transportation network data, road and bridge assets, areas of potential major economic development, and climate change risk areas. To supplement the GIS analysis, the DOT held stakeholder discussions with the STAC and TAC on each scenario to get their perspectives on
each scenarios’ possible impacts. Opportunities and risks for each scenario identified from the stakeholder discussions informed the overall strategic actions in the LRTP.

Outcomes, Recommendations, and Implementation
The scenario planning process used in Alaska Moves 2050 informed identification of a series of opportunities and risks for different place typologies presented by the scenarios. As a result, the DOT outlines goals, policies, and actions to make the best use of Alaska’s existing infrastructure, services, and resources. Alaska DOT’s strategies for considering and addressing key sources of uncertainty are outlined below.
Economic Growth: In facing an uncertain economic future, the Alaska DOT intends to monitor statewide economic trends and to plan for and invest in transportation infrastructure that supports future economic development. The plan outlines several policies to achieve this. First, the DOT will invest in transportation assets and operations that expand access to state, regional, and local resources and improve community connections. The DOT will also pursue transportation assets and operational improvements that expand access to jobs, services, and other economic opportunities.
Funding: As the Alaska DOT faces an uncertain future surrounding the availability of future funds, the DOT would like to better plan for full life cycle costs across the transportation system, including planning, construction, operations, and maintenance, so as to more effectively allocate funds. The DOT plans to employ a set of strategic preservation practices and invest in maintaining and preserving existing assets. To achieve this, the DOT plans to standardize and modernize asset management practices within the agency through the use of data and new technologies, and to implement data-driven management systems to track the quality of transportation assets.
Workforce Availability: To prepare for future uncertainty surrounding workforce availability, the Alaska DOT has outlined goals for improving mobility, access, and interconnectedness to move people and goods efficiently and equitably. To do this, the DOT has outlined actions to prioritize activities and projects that strategically strengthen intermodal connections. Additionally, they are working to plan and provide better public transit and active transportation connections to fill gaps in transportation access.
Also addressed in the plan are strategies related to resilience. The DOT plans to improve the agility of the transportation system during emergencies by expanding real-time information sharing, enhancing system management, providing more multimodal options, and supporting greater redundancy for critical infrastructure. Another key action identified for infrastructure resiliency is to integrate risk and resiliency factors into performance-based planning and programming frameworks.
With respect to implementation, the final Alaska Moves 2050 LRTP plan remains under review as of July 2023. In the meantime, the DOT is taking steps to make improvements within the organization to ensure capacity and capabilities are in place to adopt the recommendations and strategic investments from the finalized LRTP. The DOT is building up its capacity to use data in decision making, including through the formation of a strategic investment section within the division. The TAC has started to use the scenario planning results to identify key projects to invest in, but the DOT needs to build staff capacity before refining the use of scenario planning in project prioritization. The DOT is also exploring ways to make further use of federally required data that they already collect within their own processes.
As the Alaska DOT pursues further incorporation of scenario planning within their planning and decision-making processes, they have also been meeting with representatives from other DOTs who also have experience with scenario planning. The sharing of knowledge, perspectives, and experiences between DOTs has helped the Alaska DOT to consider and plan how they want to use scenario planning in the future.
Lessons Learned: Gaps and Opportunities
Being the first plan to use scenario planning for considering uncertainty, the process of creating the Alaska Moves 2050 LRTP presented valuable lessons for Alaska DOT to improve future long-
range planning efforts. The following explores the challenges that the DOT faced and the lessons they drew from these experiences. Note that while many of these lessons go beyond the scope of planning for uncertainty or scenario planning, they were accentuated by the process of investigating potential future drivers of change and their differential impact across various parts of the state.
The Need for Proactive Public Involvement Process
In this LRTP process, as well as in previous iterations, Alaska DOT encountered a loud minority from the public when conducting engagement activities. There are significant areas of the state that gave no responses to the public input process for Alaska Moves 2050. The DOT believes that the engagement process has been somewhat passive previously and is considering ways to be more proactive. This is particularly important in outlying communities where there are currently gaps in response so as to achieve more equitable representation and input in transportation planning.
Challenges exist to adopting this more active public engagement approach. More active public outreach requires significant resources, and the DOT is resource constrained. The agency will look at the public engagement process within the context of what is trying to be accomplished; it is very important to prioritize the use of resources to engage with communities on projects that specifically impact them.
Building Strategic Partnerships with Regional Planning Organizations
Alaska is unique in that a vast area of the state is not organized into units of local government. Additionally, many areas do not have regional planning bodies. There are large gaps in terms of local or regional organizational structure available to bring statewide planning into more “on-the-ground” implementation. Sometimes, communities without local units of government don’t have local revenue to contribute to transportation projects or a plan, except for possibly discretionary grants or tribal funds. This can limit the realm of opportunity or create additional need for state support.
Throughout the formation of Alaska Moves 2050, the DOT has considered how the state can better support regional planning to help very rural and remote communities. As a result, they’ve developed the following takeaways:
- Think through the organizational structure of any part of the state or community that the DOT is working with to understand their capabilities and resources before even engaging with them to avoid setting unreasonable expectations.
- Help to develop organization capabilities and resources of rural and remote communities. The DOT is starting to establish regional planning organizations (RPOs) throughout the state. The goal is to assist and empower less organized areas of the state to do planning of their own, which would in turn feed into state plans. Helping these areas to get better organized would also improve data collection from these areas.
A few challenges to implementing these lessons and goals remain. First is how to even decide on areas or boundaries for these RPOs. There is a balance to making sure the whole state is represented by an RPO, but also allowing each RPO to have autonomy in selecting their boundaries. It’s important that people in outlying communities are represented, so the DOT is looking critically at the boundaries suggested by each RPO. Organizing funding for the RPOs remains a challenge as well, as the DOT can only fund a certain number of organizations. The DOT is working on collaborating with current and future RPOs to better understand what boundaries make sense from an organizational capacity viewpoint.
Enhanced Data Management
The process of using scenario planning to develop the Alaska Moves 2050 LRTP has affirmed that the DOT needs to continue to develop capacity for data management and ensure consistency across the organization. The organization has learned that it is important for data to be clearly and consistently reported from a single point of contact and are working on managing data within the planning and program management division.
There is currently a large focus within the organization on data modernization, involving improving data collection, upgrading information systems, and better synthesizing analytics. The DOT is looking to rely more heavily on data in their decision-making processes for future plans and investments, and to move beyond predictive analytics (what could happen) and into prescriptive analytics (therefore, what should be done). Instead of trying to predict a single future, the DOT is working toward considering a range of future possible events so that they can prescribe the most strategic and resilient investments for the future transportation network. The DOT is also looking to improve how it tracks and evaluates key performance indicators to better assess if they are meeting their goals, inform project selection, and to better maintain existing infrastructure.
Building Workforce Capacity
As the Alaska DOT moves to further integrate scenario planning and the use of data into project prioritization and investment decision processes, there are a few key challenges that they face. One of the largest challenges faced by the DOT is in staff capacity and having the staff resources to implement further scenario planning efforts. One way that the DOT is trying to address this is by developing a Workforce Resiliency Plan and adapting transportation occupations to reflect the changing nature of work, including flexible hours, remote work, and using new technology and data.
A Shift Towards Agile Planning
Following completion of Alaska Moves 2050, the DOT is beginning to engage with concepts of agile or continuous planning. Rather than focusing on development of plans with rigid starts or stops, the agency is considering how to think of its “family of plans” as a more integrated whole, with cyclical procedures for updating and sharing information and knowledge between planning
activities. While still in early stages at the DOT, staff are actively engaged in thinking through how smaller area or modal plans relate to the state’s long-range plan, and how information or data can be updated between these elements. One of the challenges identified by the department to this approach is how to navigate stakeholder engagement processes and set expectations. When planning processes become too flexible, communication with public stakeholder can break down. Agencies need to be agile, but they also need to be transparent and uphold their core values to serve and engage the public as a public agency.
Hampton Roads TPO Long-Range Planning and Prioritization
Background and Motivation
As a regional planning organization, project prioritization is a key component of the Hampton Roads TPO’s (HRTPO) long-range plans. Having historically emphasized new and innovative practices in planning, the organization wanted to evolve their project prioritization process to identify the most robust and resilient projects to use financial resources more effectively. HRTPO’s federal partners suggested they consider scenario planning for their long-range planning and prioritization processes. Planners at HRTPO were already interested in shifting from a predictive planning (single future) to preparatory planning (multiple possible futures) paradigm. Additionally, they were interested in leveraging their existing project prioritization tool and land use data. HRTPO decided that scenario planning to explore uncertainty is a methodology that aligns well with their goals.
Early in the scenario planning adoption, HRTPO met with staff from other peer agencies in Atlanta and Tampa for an FHWA-facilitated exchange. In this forum, agencies shared their experiences and lessons learned with scenario planning. Within this discussion, peers covered topics ranging from new transportation technologies changing the travel landscape, to being more intentional with expending funds. HRTPO considered the best practices from this peer agency exchange as they developed their own scenario planning approach.
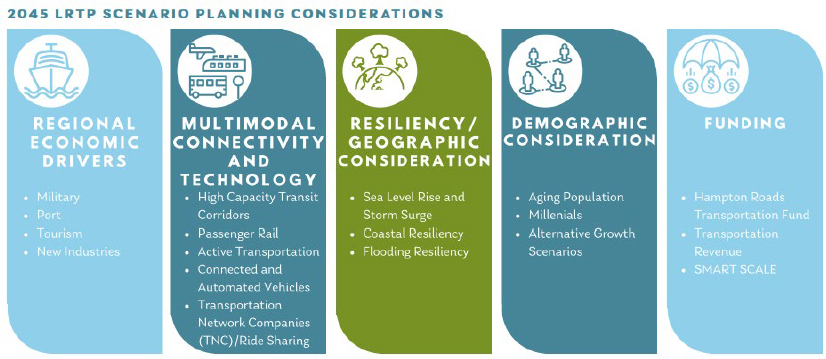
HRTPO first used scenario planning in two coordinated efforts – a regional connector study focused on major cross-harbor investments and the 2045 LRTP. The 2045 LRTP leveraged scenarios developed in coordination with the connector study and brought them into the LRTP prioritization process through travel demand modeling and performance evaluation under multiple possible futures. Scenario planning for project prioritization allowed HRTPO to evaluate how dynamic and often competing factors impact connectivity, mobility, and resiliency. Sources of uncertainty and other factors considered for scenario planning include regional economic drivers, multimodal connectivity and emerging technologies, climate resiliency and geographic considerations, demographic considerations, and future funding (Figure 2). The scenario planning process has allowed HRTPO to explore the different possibilities of what may happen in the region in terms of future growth to identify those projects that will be the most resilient across multiple future scenarios.
Source: HRTPO. https://www.hrtpo.org/uploads/docs/HR_2045LRTP_ProjectPrioritization.pdf
Planning and Analysis Activities
For the 2045 LRTP, HRTP developed four different scenarios to test individual projects against different possible population growth and regional travel patterns. These scenarios include the Baseline (“business as usual”) scenario and three greater growth scenarios: Greater Growth on the Water, in Urban Areas, and in Suburban Areas. HRTPO leveraged land use, economic, and technology assumptions from a land use model, economic model, and their regional travel demand model (TDM) to develop the baseline and future growth scenarios. For example, the land use model was used to allocate growth in different spatial patterns and levels of density across the region under the various scenarios. Similarly, a range of port activity levels, autonomous vehicle adoption, and ridesharing options were implemented within the travel demand model. The scenarios were designed to produce a range of plausible but differentiated potential future travel conditions.

Source: HRTPO. https://www.hrtpo.org/uploads/docs/RegionalScenarioPlanningFramework.pdf
Within their prioritization tool, HRTPO then evaluated projects across all four scenarios. This involved modeling projects in the TDM under each of the four scenarios. A subset of prioritization metrics derived from travel demand model outputs and from spatial analysis in GIS were sensitive for the different scenarios. HRTPO developed scores and rankings based on a range of criteria to identify the best performing projects across all four scenarios. HRTPO originally intended to develop performance rankings for each project for each scenario but decided it would be too conceptually complex for various stakeholders. Instead, HRTPO averaged scenario measures within the prioritization tool, resulting in an aggregated ranking across the four scenarios for each project.
In parallel to the LRTP effort, HRTPO was part of a USDOT pilot to implement the Volpe Resilience and Disaster Recovery tool. The Volpe tool embraces the concept of incorporating scenario planning for resiliency, using info from the TDM, running this against any number of future scenarios, and reporting the key economic impacts for investing in or failing to invest in critical infrastructure. Initially, HRTPO hoped to use results from the Volpe tool in the 2045 LRTP prioritization process, but unfortunately it was not ready in time. Alternative criteria related to sea level rise and storm surge/flooding vulnerabilities were incorporated into the scoring. In the upcoming 2050 LRTP, HRTPO is hoping to use outputs from the now available tool in prioritization to better capture resilience issues and infrastructure criticality.
HRTPO engaged closely with various internal and external stakeholders throughout the scenario planning and project prioritization process for the LRTP. The project prioritization is a data driven process to begin with and became more data intensive when incorporating scenario planning. To
navigate this, planners coordinated very closely with the technical team and other technical stakeholders, many of whom were providing land use and other data for the prioritization tool. HRTPO sought to make the LRTP as transparent as possible, thus engaged their various stakeholders at the technical level with many check points throughout the process. This helped to ensure that stakeholders felt that they had ownership of the tool. HRTPO wanted the public to be involved strategically. The public can directly submit project ideas for each LRTP, and at every major milestone in the LRTP process, there are feedback opportunities for the public.
Outcomes, Recommendations, and Implementation
HRTPO staff view scenario planning for project prioritization within the LRTP as a successful endeavor to plan and prepare resilient projects in the face of an uncertain future. Having worked through the process once, HRTPO sees the value in considering a range of possible futures and intends to adopt the same type of approach in its next long-range plan.
Staff see prioritization of projects that perform the best across multiple possible futures as more defensible than project selection based on single forecasts of future performance. Additionally, the heavy involvement of stakeholders throughout the process encourages deeper conversations about the possible futures that the region faces and how the region can prepare for them. The 2045 LRTP process saw a significant increase in public involvement and submittal of project ideas compared to previous long-range plans. The public seems to have more confidence in their local planning organization and elected officials, and more interest in participating in the conversation, when they feel that decision makers are actively preparing for different dynamic futures rather than trying to predict a single, static future.
As the organization continues to integrate scenario planning and prioritization into more of its planning efforts, HRTPO is always considering how to improve the process. One of the primary areas for improvement is in data management. Since the scenario planning process requires significant coordination with other departments, HRTPO planners are exploring better ways to manage and share data across departments. This includes working with partners on improved data organization and working to make data structures more consistent. Such work will also support the ability of HRTPO to implement more automation in data processing for the next LRTP, thus reducing the considerable burden on staff of more manual analysis. In the next LRTP, HRTPO is also hoping to incorporate more data on resiliency considerations within the TDM, such as incorporating improved scenario assumptions around sea level rise and flooding based on better infrastructure elevation data.
HRTPO is also helping localities in the region integrate scenario planning into local efforts. By adopting the scenario planning framework produced by HRTPO, localities would not only improve their local preparatory planning but also provide better quality data in support HRTPO’s efforts. Some localities have already begun to incorporate scenario planning into their efforts using some of HRTPO’s tools or data, but further adoption will require further staff capacity from localities as well as further staff capacity from HRTPO to conduct the training.
Lessons Learned: Gaps and Opportunities
Staff Capacity and Retention
HRTPO emphasized that improving the scenario planning and project prioritization process requires more staff effort, more knowledge sharing, better retention of staff, and deeper relationship building with other stakeholders. At the beginning of scenario planning adoption, HRTPO staff were not sufficiently prepared as to how much extra time and effort is required. Planners also did not consider staff turnover and how that may impact the scenario planning process. According to a representative from the organization, when you lose staff, you lose knowledge. Detailed documentation on technical processes is critical for knowledge retention. The organization is actively looking at ways to lessen staff burden from the extra effort required for scenario planning. As they are able, HRTPO works with consultants to achieve this. Similarly, they are looking into automating parts of the process in the future.
In addition to knowledge retention, the organization stresses the importance of maintaining a balance of tenured staff who have experience and established relationships with stakeholders and localities, and new staff who bring new ideas and perspectives. HRTPO is exploring ways to invest in staff retention to retain knowledge and keep this balance.
Data Use and Management
The data-intensive nature of scenario-based project prioritization resulted in various lessons learned for data use and management. First, HRTPO decided early in the process to leverage the tools and data that are already part of their core planning activities. This includes building upon the TDM and prioritization tool. Using a framework that works with the investments that the organization already has meant that HRTPO already had a foundation to work on.
Similarly, HRTPO learned that it was important for them to have an established framework upfront and to have stakeholder buy-in before performing analyses. Since the process is already time and labor-intensive, ensuring that there is an established framework early on prevented HRTPO from needing to adjust the process halfway through and using up significantly more staff resources. Similarly, HRTPO learned in the scenario planning process that it is important to manage expectations around data both internally and with stakeholders. While scenario planning can be very helpful, the organization only has so much capacity to invest in running different scenarios and analyses. Having an established framework upfront to communicate expectations and limitations to manage stakeholder expectations helped the organization to stay on track with reaching their goals.
As introduced earlier, the scenario planning also highlighted existing limitations in data management and sharing protocols. As a result, HRTPO has been actively working internally and with partner organizations to set up better processes and share practice for data management, particularly spatial data and large datasets. This also includes working through issues where
different sources were producing different results for the same metrics. HRTPO and VDOT worked closely to resolve inconsistencies in congestion metrics between their respective planning efforts. Regional land use classifications are another key input to the scenario planning process. However, many localities don’t have the resources to produce and maintain this type of data. HRTPO is working to figure out how to manage this capacity constraint as it moves into future LRTP cycles.
Related to data sharing is the question of timing and alignment between planning processes. In some cases, HRTPO wished to use a data output of another planning effort but found that it was not ready in time for the LRTP cycle. As a result, they are seeking going forward to better align processes so that up-to-date data or information is available on a useful timeline.
Coordination and Partnerships with Stakeholders
According to HRTPO staff, ongoing engagement and increased communication was key to the success of the scenario planning effort. This includes working to understand how to communicate to different stakeholders, from more technical staff at partner agencies and localities, to elected officials who have decision-making power over the plan and need high-level summarization and conclusions. While staff made a concerted effort to bring decision-makers along at every phase in the process and received support for both the scenario planning and prioritization approaches, they still found that external stakeholders struggled to connect the two. The agency had to remind people of the scenario planning effort and how it affected prioritization outcomes.
Scenario planning amplified the need for effective communication internally, with other agencies, and with the public. The LRTP has always been a process that touches many different departments and that emphasizes the ability to relate goals, to performance, to outcomes. Scenario planning required more coordination because of the diversity of issues addressed. To be successful, the agency needed to consider many possible sources of change that could affect the future of transportation. They also need to translate that knowledge and think through how to convey complex ideas to the public and stakeholders. Scenario planning has taught HRTPO to think more proactively about critical points for input throughout the long-range planning process. Going forward, the agency continues to focus on improving relationships with communities, particularly those that are and have been historically marginalized, to demonstrate that they are part of the process and get their feedback.
Finally, HRTPO planning staff expressed a desire for more opportunities to exchange ideas and learn from peers. As described by staff, MPOs entering into scenario planning have a “long road ahead” and the opportunity to learn from mentors who have already worked through similar things, and to collaborate and share knowledge, is important.
Hawaii Highways Climate Insights for Infrastructure
Background and Motivation
The HDOT Highways Division sought to better understand, plan for, and mitigate risks to infrastructure assets due to exposure to potential climate change stresses and lava flows. Agency leadership also identified challenges within the organization related to knowledge management. The agency was actively working on resilience efforts in different areas of planning. However, with workforce attrition, and transfer of people and processes between branches within the organization, HDOT saw that efforts were going unnoticed and becoming hard to monitor.
To overcome these issues and make processes transparent and accessible to different stakeholders, HDOT engaged with Google to build a comprehensive platform (Figure 4) with capabilities to review multiple hazards in one place, while simultaneously representing different socioeconomic aspects of transportation system. HDOT is in the process of incorporating insights from the platform into the project development process.

Source Hawaii Highways
Key Questions and Concerns.
The agency was primarily interested in addressing the following questions:
- How should the HDOT team assess risks to highways due to their exposure to potential climate change stresses and lava flows?
- How can HDOT make the highway system more resilient to risks and vulnerabilities that result from extreme weather, natural disasters, emergency events, non-recurring incidents, and sea level rise?
- How should HDOT overcome the issue of siloed data and workforce turnover that makes it difficult to retain institutional memory?
- How can the agency develop a forward-looking perspective in planning and design activities?
Planning and Analysis Activities
Methodology.
HDOT focused on identifying and assessing risks and vulnerabilities particularly where roads, bridges, culverts, and tunnels may be exposed to hazard events associated with changing climate conditions. As part of risk management, HDOT developed an action plan (Figure 5) that laid out a process for identifying risks and prioritizing investments:
- Exposure Assessment determines which infrastructure assets could be exposed to a probable hazard event or a set of probable hazard events.
- Vulnerability Assessment determines how infrastructure assets may be impacted or fail with some probability.
- Risk Assessment estimates the cost of repairs or replacement associated with probable failures and can help prioritize interventions. It estimates the cost and time of the broader impacts associated with probable failures (e.g., societal impacts such as the consequences of lack of access, the availability of alternative routes, and the number of people affected by closed roads).
- Resilience Assessment determines the ability of the system to meet critical functions (e.g., (un)acceptable travel time to hospitals, etc. (un)acceptable delays in the delivery of critical supplies)
The Climate Insights platform addressed the first critical step of determining potential exposure.

Source: HDOT Action Plan
Data and Tools.
As part of the exposure assessment, HDOT leveraged georeferenced asset data and elevation models to understand and assess different terrains and weather conditions, including:
- The 2018 Highway Performance Monitoring System (HPMS) Roads for Hawaii, which represents 971.1 miles of existing HDOT assets.
- Bridge Condition Dataset (BrM) from HDOT to catalog bridges and culverts of at least 20 feet in span length.
- The National Tunnel Inventory, which consists of 11 inbound and outbound tunnel point locations in the state.
- Coastal elevation information from a Digital Elevation Model (DEM) and a Digital Surface Model (DSM) derived from Light Detection and Ranging (LiDAR) data collected by Hawaii Office of Planning through their Statewide GIS program.
A range of modeling techniques were used to project climate conditions and assess subsequent effects of climate change patterns. Global Climate Models (GCMs), created by the World Climate Research Programme (WCRP) Coupled Model Intercomparison Project provide climate projections to simulate future conditions. Hawaii considered both a moderate and a high warming scenario (reflecting various assumptions around fossil fuels, population growth, and technology). To make use of the GCM data required Hawaii to “downscale” the climate projections to a finer geographic scale. The organization explored multiple methods to do so, including statistical downscaling and dynamical downscaling, which used GCM data as the drivers for a higher-resolution regional climate model.2
HDOT’s data-driven implementation plan also suggested use of drones for monitoring hard-to-access locations, use of real-time monitors for shifting slopes, and use of computer tablets for field inspection and maintenance to collect data more readily on such things as the condition of culverts and the surrounding terrain. Insights from the exposure assessment study were made available for review through Google Cloud technology and Carto (location intelligence and GIS tool) in a web analytics dashboard structure.
HDOT onboarded external consultants to do the exposure assessment overlaying data on the platform. The agency already had a hazard viewer map to begin with and in partnership with Google were able to add multiple layers to make it user friendly and incorporate additional information. The team also made use of data from the state’s planning GIS office,3 which allowed the tool to be more quickly developed with agency specific location data rather than some of the standard data used in other Google products such as Google Maps.
Data Management.
Given varying levels of technical expertise, the team experienced a communication barrier with Google team that brought heavy expertise on computer programming for the analytics platform. Additional consultants were hired to bridge this technical gap between Google and HDOT and helped establish a common ground and understanding of the mechanics of the platform.
___________________
The Transportation Environment Resource Council (TERC) was also consulted when HDOT put together tsunami and storm surge information on the kind of data that should be included in the portal, what can be done to continue working with climate agencies.
Outcomes, Recommendations, and Implementation
Data Platform Use Case.
The data platform has already helped HDOT make some infrastructure planning decisions. For instance, it has been used for scoping of a bridge replacement. Given the environmental issues surrounding the bridge, HDOT was able to incorporate resiliency in the design effort from the beginning. Bridge replacements are one of the major issues of concern for HDOT as they are going to be affected due to sea level rise. Hence, instead of replacing them with steel bridges, HDOT has come up with a strategy to put in more temporary bridges to buy them some time to understand uncertainty. In the meantime, the agency is working collaboratively with insights from the platform and with other state government and communities to strategize around which roadways to defend and which to retreat from.
Implementation Plan and Next Steps.
HDOT’s resilience policy is relatively new as of the writing of this case summary (July 2023) and was rolled out in 2022. The policy outlines how tools are available for planning and should be used in each of the different branches. The expectation is for branches and different programs to undertake their own research and create knowledge of best practice in their respective programs with the help of the data portal.
The tool currently checks if an existing project is vulnerable to one or more hazards. If so, design engineers are required to consider adaptive design and mitigation techniques/methods. For example, the HAWAII HIGHWAYS Climate Adaptation Action Plan describes a possible adaptive measure as follows: “A good example of a resilience measure is the ongoing replacement of a bridge substructure in Kaua‘i to withstand a tsunami and a bridge deck that can be easily and expeditiously replaced if damaged by a tsunami.” Resources for adaptive design identified by HDOT include design guidance from the FHWA, such as HEC-17 and HEC-25, and FHWA’s Adaptation Decision-Making Assessment Process (ADAP).4
HDOT’s resilience efforts have already been used to secure federal funding for the project to realign Honoapiilani Highway in West Maui to protect it from sea level rise. Going forward, HDOT intends to use the tool for Long Range Transportation Planning (LRTP) efforts, further resilience planning, and is considering opportunities to establish project evaluation criterion within the agency’s mid-range planning setting.
Currently, the Planning Branch of HDOT Highways Division overlooks the platform and maintains it. However, each program has its own process and will have its own way to populate the
___________________
4ADAP - TEACR - Ongoing and Current Research - Resilience - Sustainability - Environment - FHWA (dot.gov)
platform for which HDOT intends to train more people in each department. Disseminating information to let agency staff know about the platform stands as a top priority for HDOT. As more people realize that this platform exists, the planning department will be given more opportunities to answer questions and find ways to improve and take things to the next level.
There is a discussion within the department about the possibility of creating an adaptive design guidebook that shows different strategies that can be used in different projects, including nature-based solutions. Existing feasibility studies of a specific roadway may serve as a template for other projects in the future. Finally, retreat strategies remain ongoing active planning conversations for Hawaii as a whole. The State of Hawaii Office of Planning and Sustainable Development prepared a retreat strategy for coastal areas in Hawaii to stimulate discussion around land use.5 This process will be complex and long-term. In the meantime, the HDOT tool supports the agency in more proactive planning and design.
Lesson Learned: Gaps and Opportunities
Enhanced Technical Capacity
With the development of this product, HDOT has developed capabilities to consolidate data in one place allowing stakeholders and decision makers to share common information through one digital platform. However, throughout the execution of this project, HDOT identified gaps in technical capacity across different departments. For instance, the Highways Engineering team does not have a dedicated GIS team and lacks a robust feedback data loop with the on-site field staff to help the planning office better understand uncertainty and ground realities. The agency aims to enhance the feedback loop by establishing stronger connections with on-site resources responsible for gathering data. Lack of adequate on-site technology has posed challenges in obtaining precise data. For example, there is not a current process to record information on incidents or emergencies related to infrastructure assets and required responses by field staff. Working to address these processes and technological limitations will help to better support decision-making under uncertainty through more accurate and actionable data.
More broadly, the resilience tool is one among multiple data centralization and coordination efforts within HDOT. With the increasing usage and expansion of resilience and other portals, the management of data has become increasingly challenging. It is becoming evident to HDOT that passive operation of data portals with minimal effort is no longer sufficient. HDOT recognizes the need to allocate additional resources to enhance overall operations and effectively meet their data management requirements.
___________________
5Office of Planning and Sustainable Development | Managed Retreat Report Released (hawaii.gov)
Inter-Agency Partnerships
As part of this project, HDOT worked with multiple stakeholders and continues to explore potential partnerships to improve monitoring and evaluation processes within the dashboard. For instance, on drainage side, HDOT staff worked with the US Geological Survey to develop equations on water expected during storms. With the help of these types of partnerships, HDOT seeks to enhance the technical capabilities of this platform through the integration of more intricate datasets and the implementation of advanced analytics techniques.
Communication and Training
Going forward, further communication about the tool and training on its use and purpose is an important focus for HDOT. To encourage adoption requires more than the publication of a tool or policy. Opportunities for training include the HDOT Highways Division all teams meeting. Districts may also need further guidance on which types of projects are most likely to require adaptation strategies based on resilience assessments. Generally, larger capital improvement projects will be more at risk for impacts of climate and sea level rise than shorter term maintenance. There are also different types of strategies that are appropriate at different timescales. In the long-term, highway realignment may be considered, while a mid-term strategy might shift a roadway within existing right-of-way, and short-term strategies could include rockfall protections or “sand saver” interventions focused on reducing erosion. HDOT is collecting information to highlight different types of projects within the resilience platform, but this will be a more useful resource as it becomes more populated with projects.
Access Ohio 2045
Background and Motivation
To engage with uncertainty, Ohio Department of Transportation (ODOT) incorporated scenario planning within Access Ohio 2045, their Long-Range Transportation Plan (LRTP). Discussions around scenario planning began internally after brainstorming at a TRB scenario planning conference in Portland, OR that was hosted by the Statewide Multimodal Planning Committee of the Transportation Research Board. Additionally, as ODOT was getting ready to launch their plan, there was much discussion around Autonomous and Connected Vehicles. At that time, people were grappling with major uncertainty around the possibility of sudden fleet turnover, and no one understood the potential impact. Rather than relying on historic trends, agency planning staff saw the need to introduce new methods decided to take a different approach to plan for different alternative futures.
While rapidly evolving technology triggered interest on the part of ODOT, the team also examined other drivers of change, such as the economy, development, and population. ODOT found these drivers helpful in addressing issues in various sectors, including freight, which is a key concern for ODOT. Given Ohio’s strategic location and ability to provide warehousing facilities, ODOT
prioritized heavy freight movement under one of the scenarios. In another, they really emphasized technology. The goal was to push the limit on potential trends across different scenarios, with the expectation that what would really happen would fall somewhere in the middle.
Looking back, ODOT sees the COVID-19 pandemic as having helped make the case for scenario planning and developing alternative futures even stronger. Ohio ended up experiencing certain dimensions of the scenarios developed by ODOT prior to the pandemic – for example, the rapid increase in freight movement because of online deliveries. While ODOT never anticipated a global pandemic, the overall planning effort was helpful in preparing ODOT to handling it, as later acknowledged by leadership at ODOT.
Key Questions and Concerns.
The Access Ohio 2045 plan aimed to understand forces that will change transportation and define a set of strategies to prepare for these changes. The team assessed changes in population, economics, development, and technology trends that impact transportation. Each future considered represents a combination of conditions that could occur in Ohio, leading to possible shifts in transportation services, choices, and travel. The plan’s steering committee weighed in on these drivers of the future of transportation:
- Population: Will the population go up or down? Will there be younger or older adults, or people with disabilities?
- Economy: Will Ohio’s economy include the same mix of industry as of today, or will there be job growth in new areas?
- Development: Will development patterns be more concentrated in cities and suburbs? How might rural areas grow?
- Technology: Will technology advance at a steady pace, or will it accelerate and become even more widely adopted? How disruptive will it be?
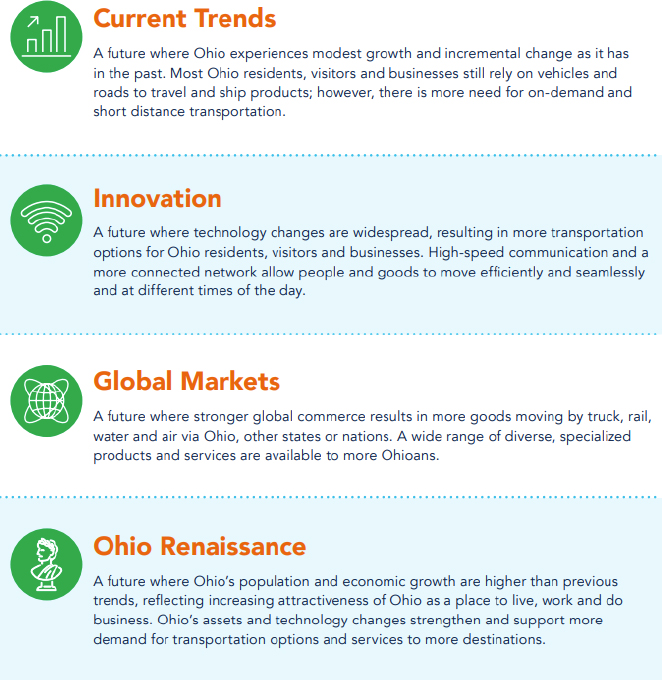
These sources of uncertainty were then organized across four different types of futures, as summarized in Figure 6.
Additionally, one of the biggest concerns that ODOT faces is around funding. ODOT and the Ohio legislature were grappling with the insufficiency of the existing gas tax to cover future costs, as well as considering different funding sources and innovative financing options. The scenario planning exercise aimed to support this conversation by engaging with a range of futures to identify how future funding needs could vary across them. Rather than focusing on a single point forecast, the scenario planning effort helped to bound expectations on funding requirements, including demonstrating significant levels of need in widely varying future.
Planning and Analysis Activities
The ODOT used scenario planning to explore multiple futures of transportation for Ohio and assessed underlying uncertainties within each. The approach involved a series of steps that joined analysis and engagement activities (Figure 7). During this exercise, ODOT organized two groups, i.e., internal and external. The internal group mostly included people from the division of planning. The external group included stakeholders from Metropolitan Planning Organizations (MPOs), Regional Transportation Planning Organizations (RTPOs), and representatives from different modal space such as ports, Association of American Railroads (AAR), trucking association, transit agencies and environmental groups. When developing each scenario, ODOT would run them by internal group first followed by external group to seek feedback and further guidance.

Source: Access Ohio 2045.
ODOT developed estimates of dollar amounts for needs for its different programmatic areas. While needs analysis is often done for a single point estimate, ODOT developed a range of estimates by estimating needs for each scenario. This helps ODOT move beyond single forecasts and historical trends, and to consider a variety of plausible outcomes.
Needs were analyzed in a performance-based way, meaning that needs are the amount of funds needed to achieve performance targets for ODOT’s performance indicators. The ability to model the impacts of each future depended on the extent of data available and the sophistication of ODOT tools in each program area.
For example, ODOT’s traffic volume and asset condition data provided the greatest level of specificity for the needs analysis in categories like highway and bridge preservation and highway capacity. ODOT’s statewide travel demand and asset condition model allowed for sensitivity testing and enabled the iterative processes used to refine needs results by each future. Consequently, ODOT was able to better forecast system demand, capacity, maintenance using established performance measures within each future.
Figure 8 illustrates how needs varied across different scenarios for the road program. The different futures incorporated adjustments reflecting differences in network capacity needs and in requirements based on changes in truck activity.

Source: Access Ohio 2045.
The data used to evaluate needs for non-highway modes was found in materials such as MPO long-range transportation plans and local and regional plans and studies and was thus less comprehensive and readily available. Non-highway needs were first estimated for the Current Trends scenario. Non-highway needs include transit, active transportation, aviation, freight rail, and maritime. To develop needs estimates for other scenarios, scaling factors were developed based on forecasts of key scenario dimensions including households, employment, truck VMT, technology efficiency, and level of technology enticement (effect on demand). Technology adjustment factors reflected professional judgement rather than detailed forecasts.
Outcomes, Recommendations, and Implementation
ODOT assessed the impact of each future, and varying needs of each were identified accordingly (Figure 9). In addition to this qualitative assessment, the plan outlined impacts qualitatively, as summarized in Table 2. Access Ohio 2045 was a policy rather than a project-based plan. As such, ODOT identified a series of strategies and initiatives organized under different themes. To assist with implementation, ODOT developed a separate Implementation Plan to supplement the LRTP. The implementation plan was categorized into four areas:
- Monitor: These are areas where the department was already doing work and the level of effort is appropriate.
- Accelerate: ODOT is already working in these areas, but there’s more that can be done.
- Launch: ODOT is not working on these items currently but need to start soon.
- Defer: ODOT should continue to track these items, but there is no need to devote resources yet.
These categories reflect the temporal nature of uncertainty and differentiates between issues that require action now and those that have not yet reached maturity. There are dedicated
personnel within ODOT that have the responsibility to provide annual updates on each implementation area and to craft implementation strategy accordingly. Scenario planning has helped ODOT to be ready to pivot if needed in case of any changes to the transportation system.

Source: Access Ohio 2045.
Table 2. Potential Transportation Impact by Scenario
| Scenario | Impact |
|---|---|
| Current Trends |
|
| Innovation |
|
| Global Markets |
|
| Scenario | Impact |
|---|---|
| |
| Ohio Renaissance |
|
Lesson Learned: Gaps and Opportunities
Bridging the Planning to Programming Gap
The ODOT is using data sets produced during the scenario planning LRTP exercise for other efforts such as the state freight plan. Nevertheless, there is still a gap between planning and programming and prioritization of fundings. ODOT staff are working to figure out how to share findings and data products with different program managers within the DOT or with regional planning partners. There is considerable dialogue within the department on how to strengthen connections between uncertainty analysis or needs analysis and the capital allocation process. Because each program within the state has its own funding allocation and prioritization process, the question becomes how best to facilitate knowledge transfer and provide useful information to support decision-making in a way that is aligned across the organization and with the LRTP.
There is also growing pressure from stakeholders outside the agency to produce project-based plans. While the Access Ohio 2045 plan is comprehensive, it does not list the type of projects that the team is going to roll out, and so the policy plan is only seen as a stepping-stone for more specific project-oriented planning. The team at ODOT would like to evolve towards more project-based planning in future LRTP cycles. The arrival of a major Intel processing factories to Ohio is a new development that occurred since the last LRTP that has put further pressure on ODOT to consider potential development trends and their specific transportation impacts. Many in the state felt unprepared from an infrastructure perspective for that major development, leading to increased scrutiny on the nexus of transportation and economic development going forward.
Engagement and Building Partnerships
As part of LRTP, ODOT worked with different stakeholders that are a part of typical LRTP projects such as counties, municipalities, townships, other state agencies and public and private transportation operators. To address key sources of uncertainty like development and the economy, ODOT staff point to the importance of coordinating directly with the state’s Department of Development and with outsider organizations like the Ohio Trucking Association and organizations that represent disadvantaged communities or elderly population. Regarding technology, coordination with tech companies (e.g., for self-driving vehicles) is facilitated through
the Drive Ohio initiative. Other coordination has happed within National Electric Vehicle Infrastructure (NEVI) program plans. For example, ODOT is working with energy suppliers to understand charging infrastructure needs. These efforts are not necessarily happening within the planning department responsible for the LRTP, so effort is required to try to keep things aligned and coordinated.
ODOT staff pointed to the inherent uncertainty associated with public engagement. Nevertheless, Ohio DOT staff identified considerable value in discourse within the scenario planning process. The LRTP placed heavy emphasis on stakeholder engagement, including internal engagement within the DOT, with the steering committee, and with districts and regions. By initiating conversations, the plan supported education of stakeholders and helped enable ODOT partners to articulate shared concerns and leverage shared knowledge. Through sharing of knowledge, ODOT was able to advance a more strategic agenda to work towards internally and with others in the state.
Apart from these external relationships, ODOT staff also identified the need to bridge gaps between different working groups within the department. For instance, design engineers expect to receive specific point estimates from traffic forecasts to enable application of engineering standards. This department therefore needs to figure out how to address uncertainty in planning, while still supporting design procedures once a project progresses to the phase of preliminary engineering.
Information Sharing and Data Management
The ODOT works hard to ensure that planning tools are consistent across Ohio so that analyses from different parts of the state can be compared. For travel modeling, there is a high level of consistency in data inputs, networks, and post analysis procedures, and efforts are being made to overcome inconsistency issues. There is an inter-departmental agreement among Ohio agencies to use the same population projections and MPOs are required to adhere to those for official planning activities. There might be different projections for different scenarios, but for official purposes there is a single forecast.
Despite these considerable efforts to share data, the scenario planning exercise and ODOT’s subsequent desire to move towards project-based plans has highlighted the need for additional data sharing and development. ODOT suballocates significant levels of funding, beyond what is required by federal law, to MPOs and to the Large City Capital Program. This provides significant flexibility to local communities to allocate funds to meet local needs. While regions are developing project-level prioritized plans, this information is all housed in plan documents. To support future coordination and planning at the state level, ODOT is investigating the idea of developing a centralized database of project information.
Technical Capacity and Resource Limitations
ODOT planning staff discussed a variety of capacity limitations. The statewide planning and modeling teams have relatively few staff. As a result, these “small but mighty” teams must survive by continually evolving this practice to improve tools and use of automation.
Staff pointed to challenges associated with data quality and the pace of change in data over time. The landscape of data availability is constantly changing, requiring innovation from the agency to keep up. Staff must also understand and deal with individual limitations of data sets. For instance, due to the COVID-19 pandemic, the census had lower than usual response rate which is probably a one-time issue but still affects ODOT analyses.
Apart from Access Ohio 2045, the ODOT was also part of a VisionEval pooled fund study. The modeling group found that approach, which relied on many separate TDM runs to create meta models to support exploration of many possible futures, to be highly resource intensive (“data hungry”) beyond a level they were comfortable with for planning activities. Modeling staff expressed a desire for less resource intensive modeling approaches that leverage publicly available data, pointing to the Federal Transit Administration (FTA) STOPS simplified travel model as a precedent. Looking across the state to ODOT’s regional partners, some large MPOs have TDMs with custom modules for factors like telecommuting or Connected and Autonomous Vehicles (CAVs). These models tend to take a long time to run. Smaller MPOs often don’t have such modeling capabilities. Staff believe that simple elasticities might be helpful in places that don’t have advanced travel modeling tools.


