Public Transit and Ride Sharing for Rural, Tribal, and Frontier Agencies: A Guide (2026)
Chapter: Appendix C: How to Use the Implementation Checklist

APPENDIX C
How to Use the Implementation Checklist
The Implementation Checklist Tool is a workbook designed to assist rural transportation providers and administrators in systematically managing and completing tasks related to various planning and evaluation processes. It is structured as an Excel workbook containing multiple tabs, each serving a specific function within the checklist system. The workbook is available for download.
The Checklist serves as a task management system, enabling users to:
- Organize tasks according to different implementation steps (e.g., goal setting, evaluation, regulatory compliance, and more).
- Track progress with real-time updates that can be reflected in a summary tab.
- Manage priorities and deadlines through specific checklist items that detail the necessary actions at each phase of the corresponding project.
The Implementation Checklist was built based on information gathered on SUM services and rural transportation needs to help develop sustainable services/programs.
How to Use the Tool
The following are step-by-step instructions for using the workbook:
- Familiarize yourself with the tool by reading the detailed instructions on the Directions tab.
- Navigate to one of the Implementation Step tabs. These are the numbered tabs (e.g., 1. Goal Setting and 2. Evaluation Criteria).
- Read the full title of the implementation step near the top of the tab page.
- Review the task description names listed within the implementation step.
- For each task, review the action item descriptions to be considered and completed for the task.
- Use the Completed? column to indicate the estimated level of progress for the action item; options include 0%, 25%, 50%, 75%, 100%, or N/A. The options for 0% through 100% should be used to reflect the amount of progress up to completion (100%) for any applicable action items. Use N/A to indicate that the action item listed is not applicable to your agency and/or the SUM service. (Use the Completion Summary tab to monitor your overall progress across all Implementation Steps.)
- (Optional) Use the Assigned To column to indicate any specific persons/entities responsible for systematically managing and completing the action item.
- (Optional) Use the Notes column to write in any comments about the action item.
- Track progress using the calculated Tasks Complete and Action Items Complete percentage bars near the top of the tab.
- Use the filters function at the top of the table (Row 9) to filter by the Task, Task Description, Action Item, Action Item Description, Theme, Completed?, Assigned To, and Notes columns as needed.
- Complete all action items within the implementation step (either at 100% or N/A in the Completed? column) for all Implementation Step tabs in the workbook.
- Use the References tab for any supporting guidance, information, and industry examples helpful to complete tasks.
Description of the Tabs
The workbook tool contains 11 tabs available for use, including:
- Directions tab
- References tab
- Completion Summary tab
- Eight individual Implementation Step tabs.
There is also a hidden “Completed” tab which is dedicated to internal computations and not intended for user interaction.
Directions
The Directions tab provides detailed instructions for how to use the Checklist Tool. It is particularly essential for first-time users and offers guidance on navigating through the various tabs, marking tasks, and understanding the structure of the tool.
References
The References tab contains reference materials or resources that are pertinent to the individual checklists for each implementation step. Users can refer to this tab for supporting information, or context that may aid in completing the tasks outlined in the checklists. It serves as a centralized location for any project resources needed for guidance on the implementation step. The references are organized by implementation step and task, allowing users to easily find the information from the other project resources related to a specific suggested action (see Figure C-1).
Completion Summary
The Completion Summary tab offers a birdʼs-eye view of the userʼs progress across all of the implementation steps. The percentages and graphics in the tab automatically update based on the completion of tasks in the individual implementation step, giving a visual representation of its status. This summary helps users quickly assess what has been done and what remains, offering a dashboard-like experience that simplifies the management of the implementation steps (see Figure C-2).
Implementation Step Tabs
These tabs contain detailed tasks and action items for each of the implementation steps, allowing users to review and consider suggested action items for each task while tracking and managing their progress by action item (see Figure C-3).
There are eight implementation steps in total:
- Goal Setting
- Evaluation Criteria
- Regulatory Readiness
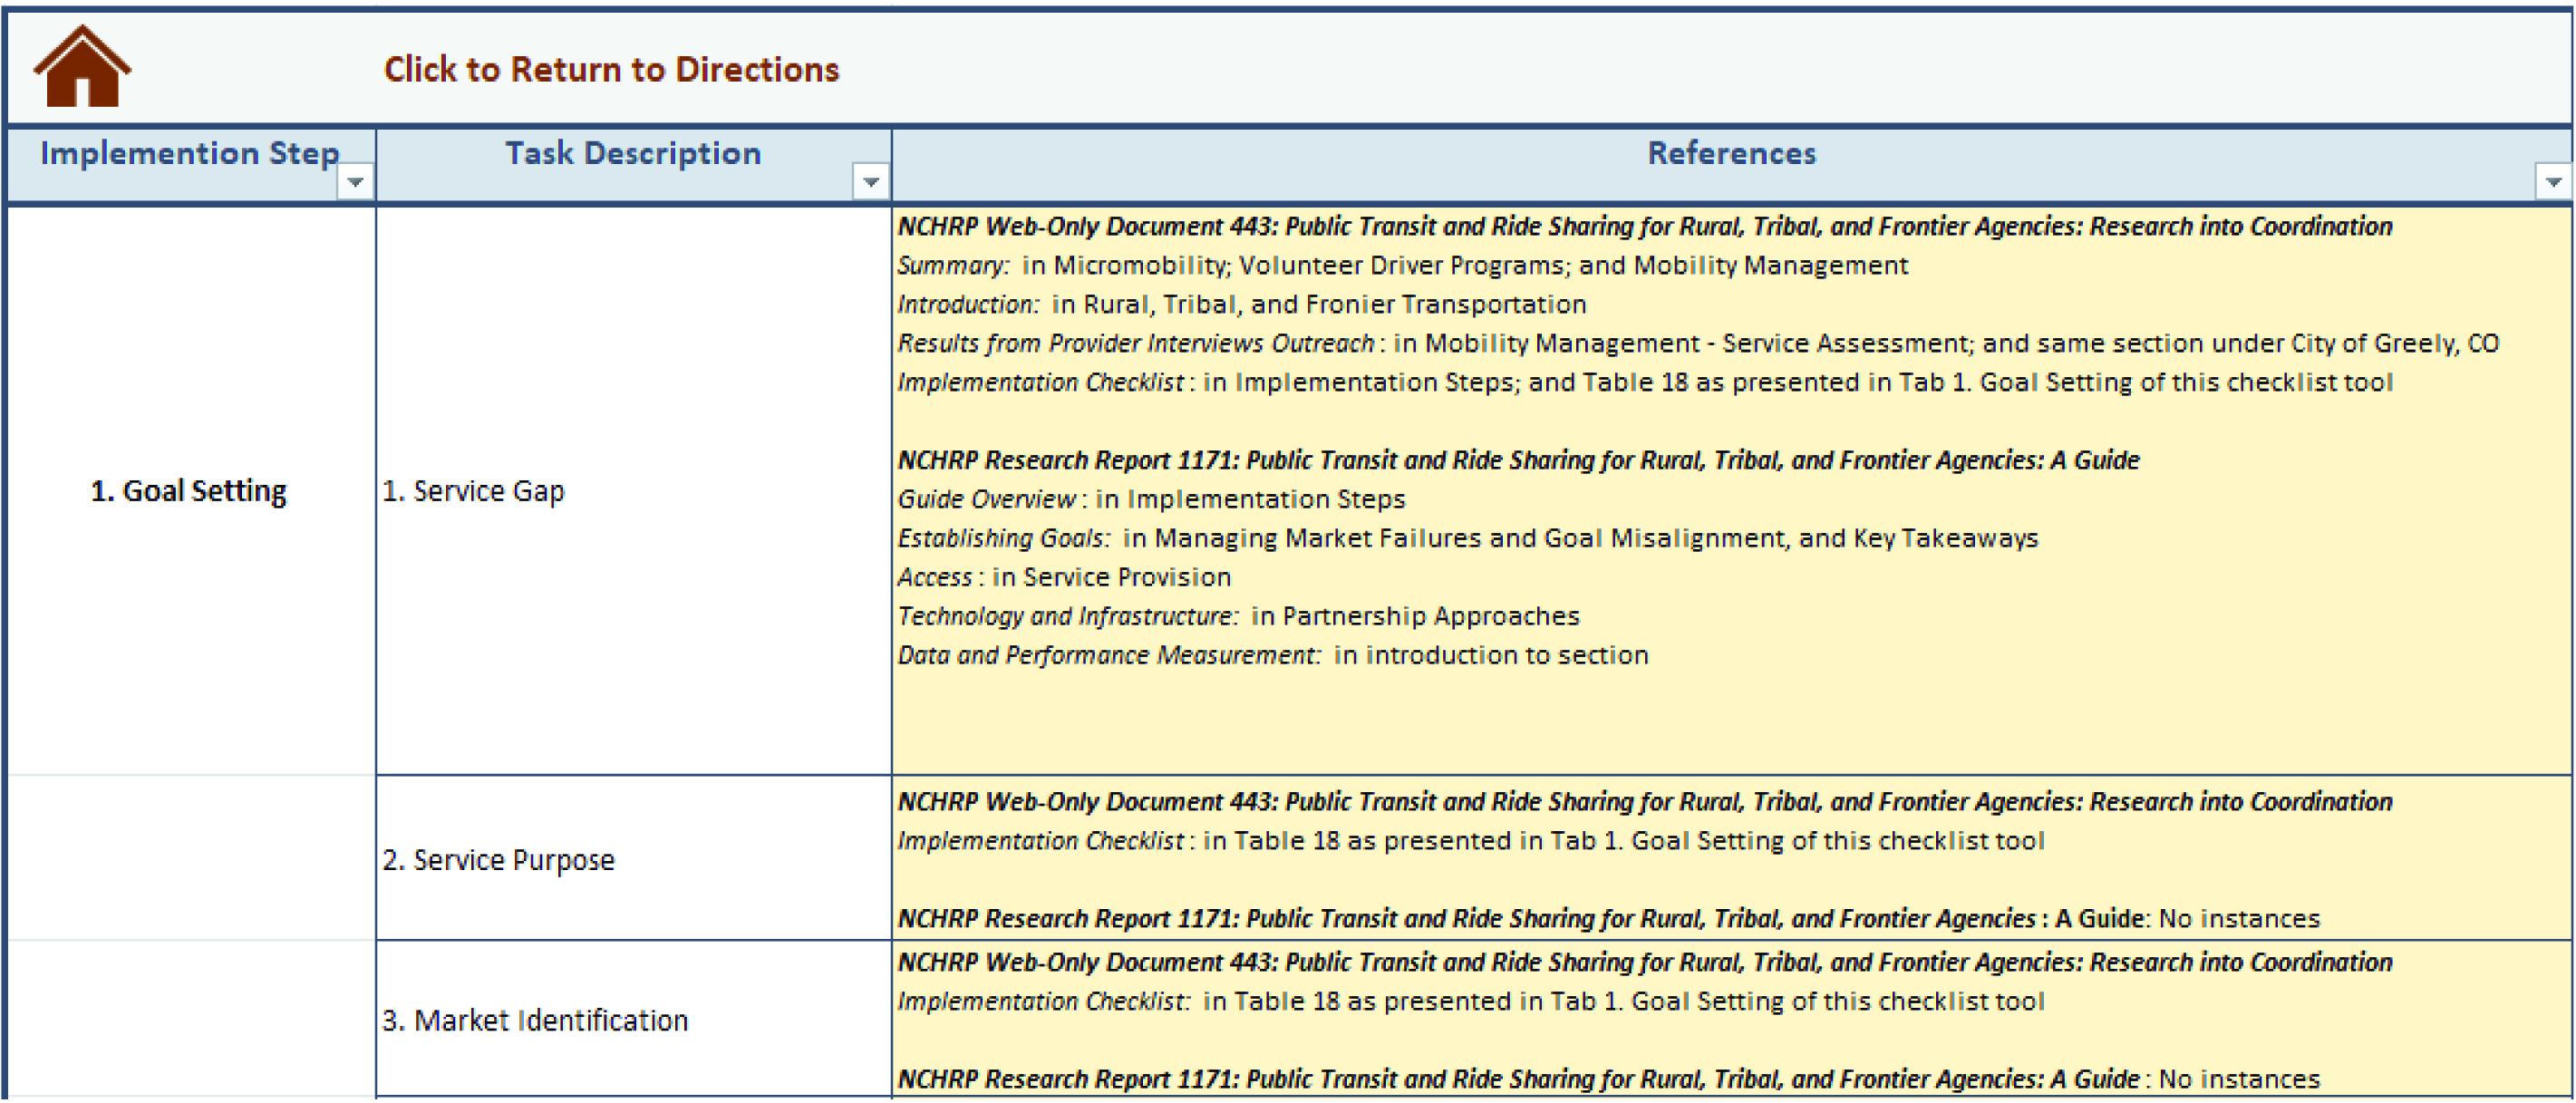
Long Description.
The screenshot begins with a title, ‘Click to return to directions.’ The column headers, which are listed with drop-down boxes, are implementation step, task description, and references.
Column 1 of the table reads ‘1. Goal Setting.’ Column 2 lists three main tasks: 1. Service gap, 2. Service purpose, and 3. Market identification. Each task pertains to its respective references, including the final report and a guidebook. The references for each task list the following:
1. Service gap: NCHRP Web-Only Document 443: Public Transit and Ride Sharing for Rural, Tribal, and Frontier Agencies: Research into Coordination. Summary: in Micromobility; Volunteer Driver Programs; and Mobility Management. Introduction: in Rural, Tribal, and Fronier Transportation. Results from Provider Interviews Outreach: in Mobility Management - Service Assessment; and same section under City of Greely, CO. Implementation Checklist: in Implementation Steps; and Table 18 as presented in Tab 1. Goal Setting of this checklist tool. NCHRP Research Report 1171: Public Transit and Ride Sharing for Rural, Tribal, and Frontier Agencies: A Guide. Guide Overview: in Implementation Steps. Establishing Goals: in Managing Market Failures and Goal Misalignment, and Key Takeaways. Access: in Service Provision. Technology and Infrastructure: in Partnership Approaches. Data and Performance Measurement: in introduction to section.
2. Service Purpose: NCHRP Web-Only Document 443: Public Transit and Ride Sharing for Rural, Tribal, and Frontier Agencies: Research into Coordination
Implementation Checklist: in Table 18 as presented in Tab 1. Goal Setting of this checklist tool
NCHRP Research Report 1171: Public Transit and Ride Sharing for Rural, Tribal, and Frontier Agencies: A Guide: No instances
3. Market Identification: NCHRP Web-Only Document 443: Public Transit and Ride Sharing for Rural, Tribal, and Frontier Agencies: Research into Coordination
Implementation Checklist: in Table 18 as presented in Tab 1. Goal Setting of this checklist tool
NCHRP Research Report 1171: Public Transit and Ride Sharing for Rural, Tribal, and Frontier Agencies: A Guide: No instances.
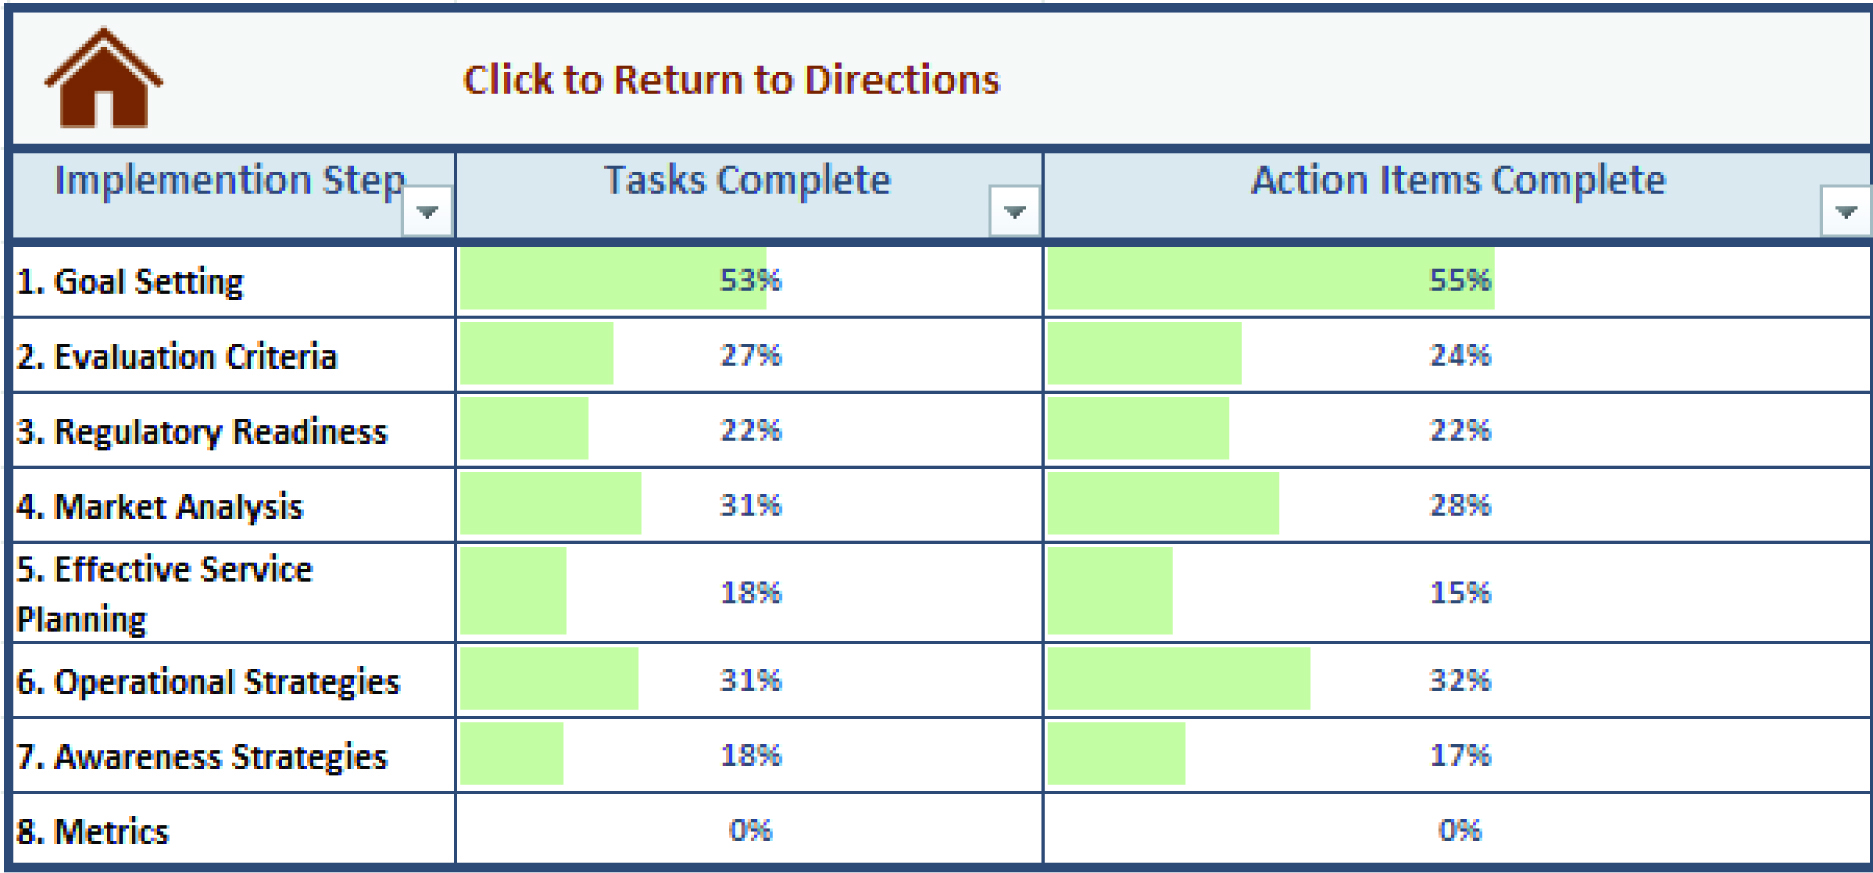
Long Description.
The screenshot begins with the title, ‘Click to return to directions.’ The column headers are mentioned with a drop-down box, which includes Implementation step, Tasks complete, and Action items complete.
The data given in the table for the tasks complete and action items complete for each implementation step are as follows:
1. Goal setting: 53 percent, 55 percent.
2. Evaluation criteria: 27 percent, 24 percent.
3. Regulatory Readiness: 22 percent, 22 percent.
4. Market Analysis: 31 percent, 28 percent.
5. Effective Service Planning: 18 percent, 15 percent.
6. Operational Strategies: 31 percent, 32 percent.
7. Awareness Strategies: 18 percent, 17 percent.
8. Metrics: 0 percent, 0 percent.
- Market Analysis
- Effective Service Planning
- Operational Strategies
- Awareness Strategies
- Metrics
Goal Setting
Action items related to development of goals with respect to existing service gaps, purpose of the SUM service, identifying rider markets for the service, and performance metrics to be used for determining success.
Evaluation Criteria
Action items related to the scope of partnerships with vendors, management of data generated by the service, developing an evaluation plan to determine service success, and procurement steps.
Regulatory Readiness
Action items related to eligibility for funding sources for the SUM service, regulatory compliance, ADA requirements, Title VI requirements, drug and alcohol testing for drivers (if applicable), National Transit Database reporting requirements, and data security and privacy protection considerations.
Market Analysis
Action items related to the needs of riders, service area and span analysis, time period of the service, and technology parameters (e.g., for service zones) needed for the SUM service.
Effective Service Planning
Action items related to coordination with internal stakeholders, working with external stakeholders, setting intentions for the service, service levels, and potential expansion considerations.
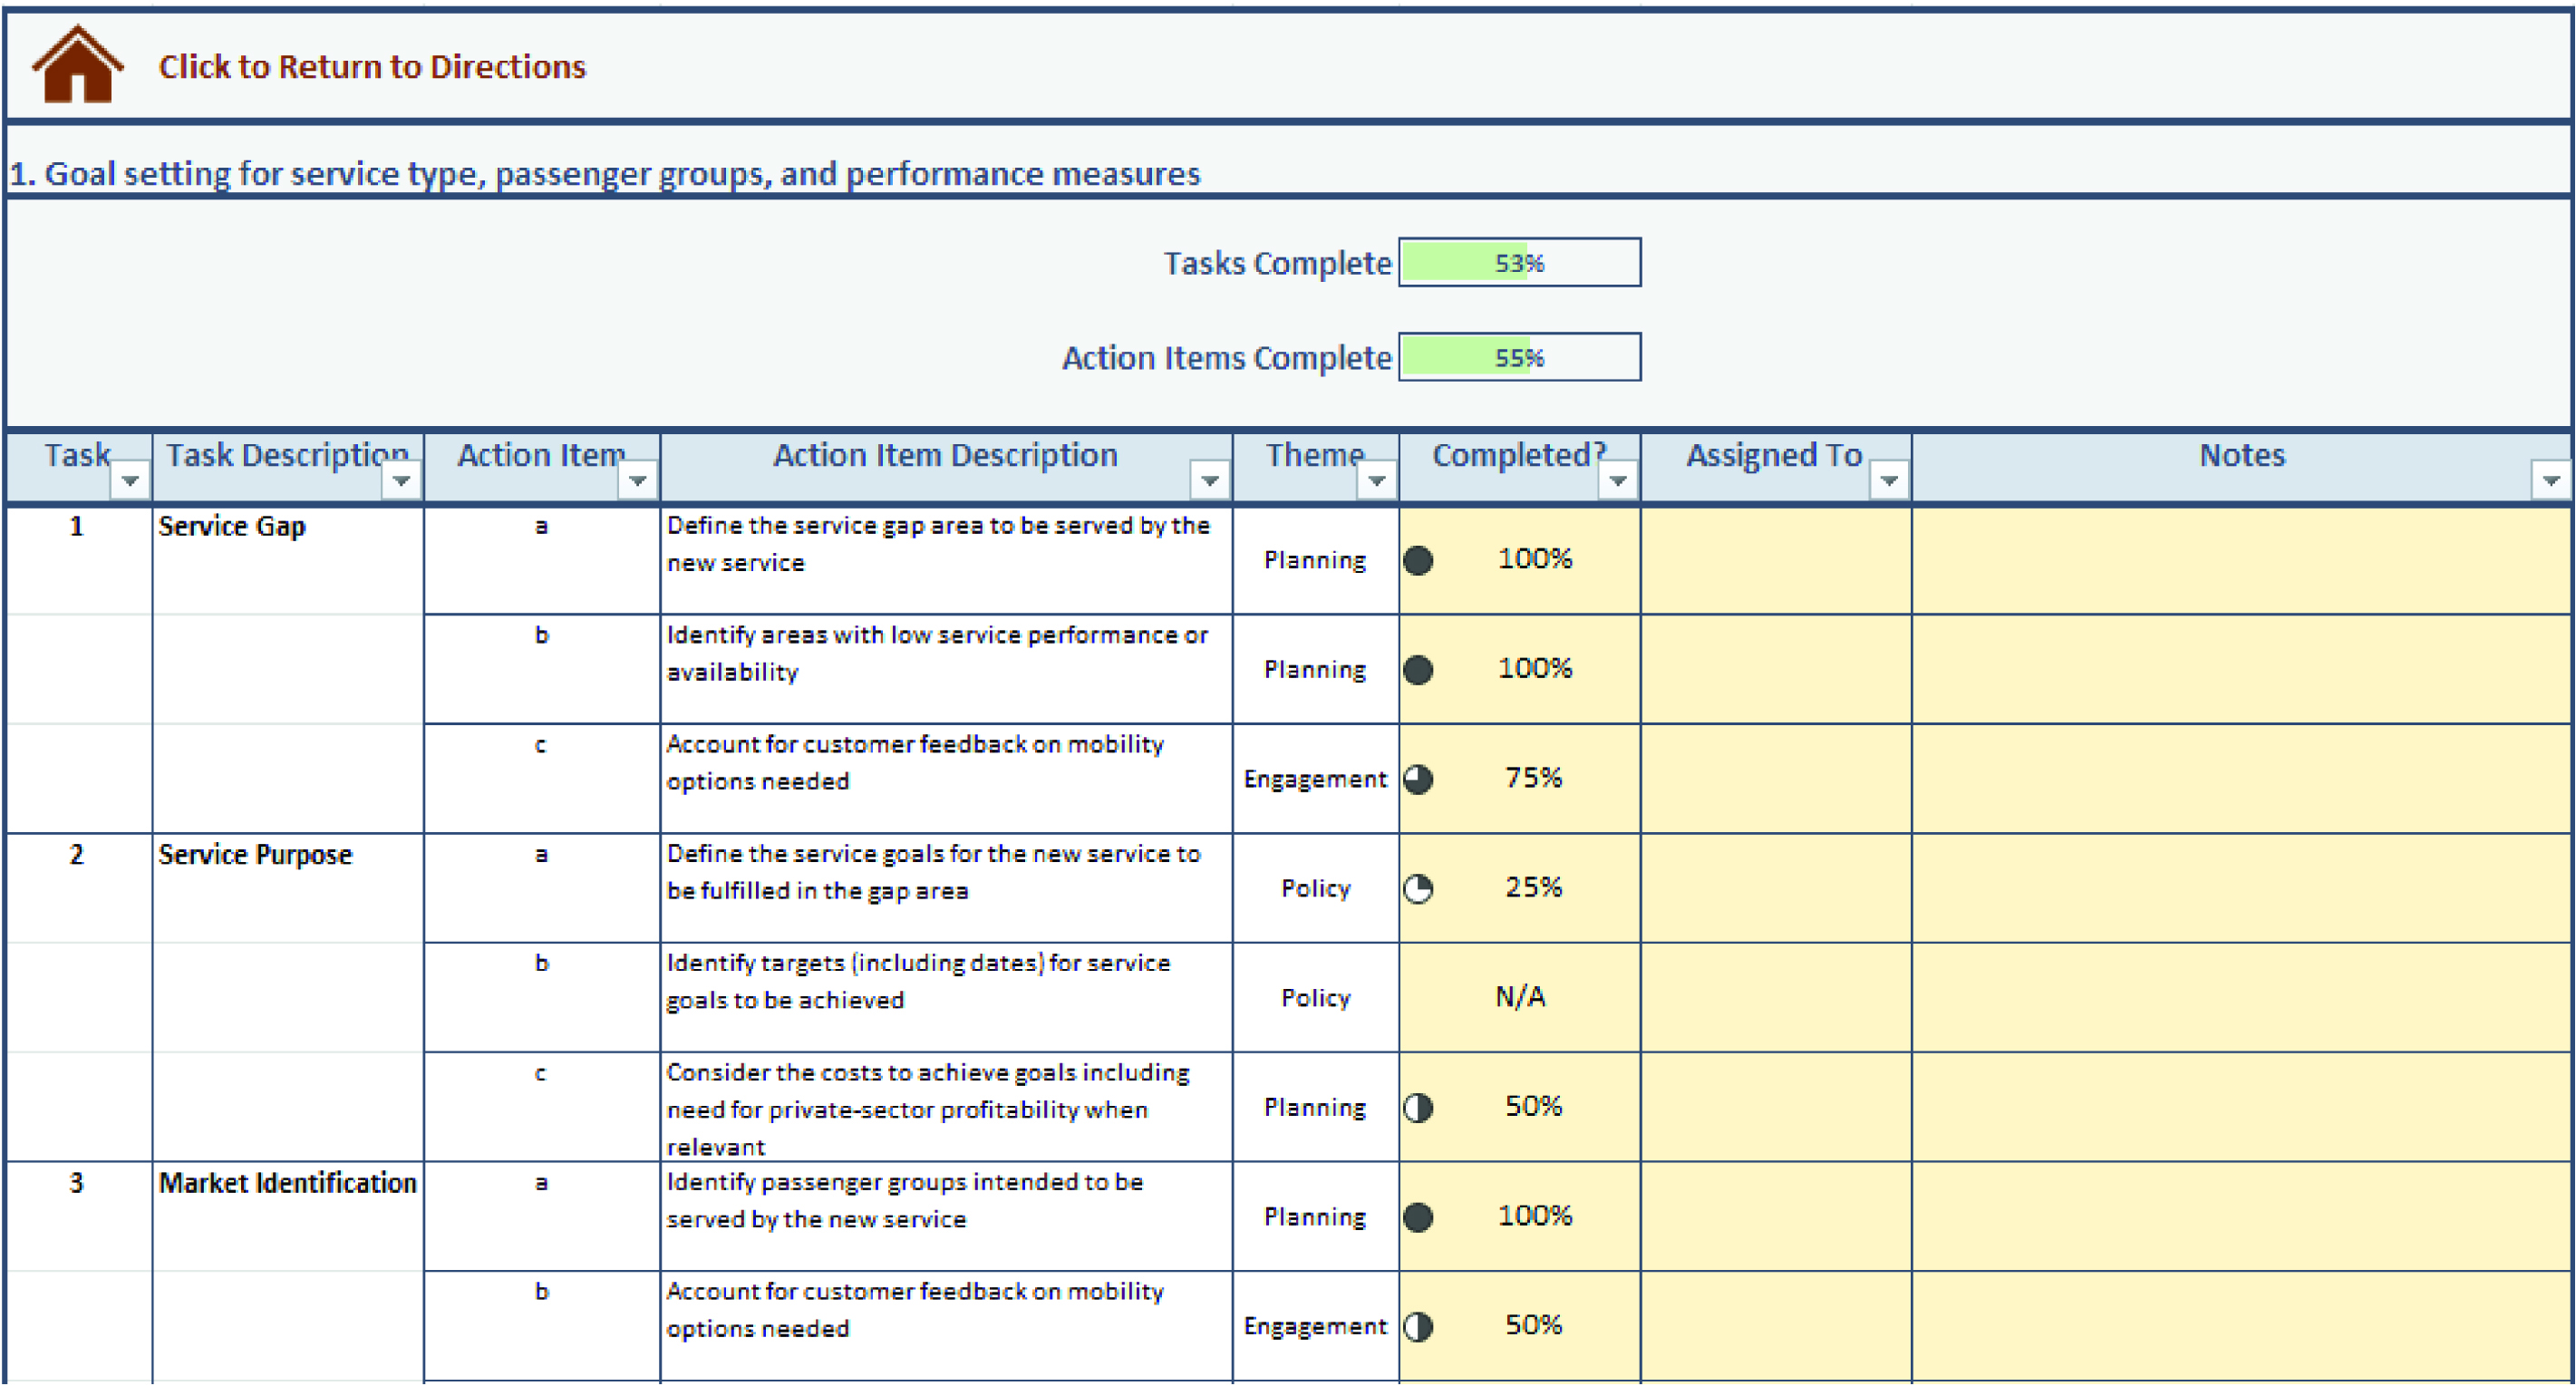
Long Description.
The screenshot begins with a title, ‘Click to return to directions.’ The text below the title read ‘1. Goal-setting for service type, passenger groups, and performance measures.’
The tasks complete bar shows 53 percent complete and the action items complete bar shows 55 percent complete.
The column headers, which are listed with a drop-down box, are task, task description, action item, action item description, theme, completed?, assigned to, and notes.
Column 2 lists three main tasks: 1. Service gap, 2. Service purpose, and 3. Market identification.
Column 3 lists letters assigned to action items for each main task: 1 a, 1 b, and 1 c for Service Gap; 2 a, 2 b, and 2 c for Service Purpose, and 3 a and 3 b for Market Identification.
Column 4 provides the following action item descriptions:
Action item 1 a: Define the service gap area to be served by the new service.
Action item 1 b: Identify areas with low service performance or availability.
Action item 1 c: Account for customer feedback on mobility options needed.
Action item 2 a: Define the service goals for the new service to be fulfilled in the gap area.
Action item 2 b: Identify targets (including dates) for service goals to be achieved.
Action item 2 c: Consider the costs to achieve goals including need for private-sector profitability when relevant.
Action item 3 a: Identify passenger groups intended to be served by the new service.
Action item 3 b: Account for customer feedback on mobility options needed.
Column 5 lists the following action item themes: Action item 1 a: planning, Action item 1 b: planning, Action item 1 c: engagement, Action item 2 a: policy, Action item 2 b: policy, Action item 2 c: planning, Action item 3 a: planning, Action item 3 b: engagement.
Column 6 is marked as 100 percent completed for action items 1 a and 1 b and 75 percent for action item 1 c. Action item 2 a is 25% complete, action item 2 b is marked not applicable, and action item 2 c is marked 50 percent. Action item 3 a is marked 100 percent and action item 3 b is marked 50 percent completed. Assigned to and notes columns are left blank for all task descriptions.
Operational Strategies
Action items related to securement of funding for the SUM service, contracting for service agreements, training agency staff on the technology and the service policies, and service evaluation and refinement tasks.
Awareness Strategies
Action items related to community engagement and outreach, coordinating with external stakeholders on service parameters, conducting stakeholder engagement activities, developing marketing campaigns, and processes for ongoing communication.
Metrics
Action items related to developing a performance evaluation framework, ensuring data availability for performance measurement, conducting periodic performance assessments, and communicating SUM service performance results.
Completed Tab (Hidden)
This tab is used to track tasks that have been marked as completed across the different implementation steps. The tab is hidden and not intended for user interaction; instead, it provides internal computations to visually reflect them in the other tabs.
Calculations
This section of Appendix C describes the methods for calculating action item and task completion rates for each implementation step. It is not necessarily important for users of the workbook to fully understand these calculation methods, but the authors have provided them for reference.
Averages for Action Items
For each implementation step, the average for action items is computed based on the completion percentages of all the action items within that implementation step. This means:
- The average is computed by taking the sum of all non-N/A values under the “Completed?” column and dividing by the count of non-N/A values.
- If a cell is blank (i.e., no value is present), it is treated as 0 for the purpose of the calculation.
- N/A values are excluded from the calculation.
Averages for Tasks
For each implementation step, the average for tasks is computed in two steps:
- Compute the average for each task:
- The task average is computed by averaging the completion percentages of all the action items under that task. If a task has only one action item, the task average will be equal to the completion percentage of that single action item.
- Any N/A values are excluded from the average, while blank cells are treated as 0.
- Once the average for each task is computed, the overall average for the implementation step is calculated by averaging the task averages.
Example
Assume the values provided in Table C-1 for action items under a particular implementation step:
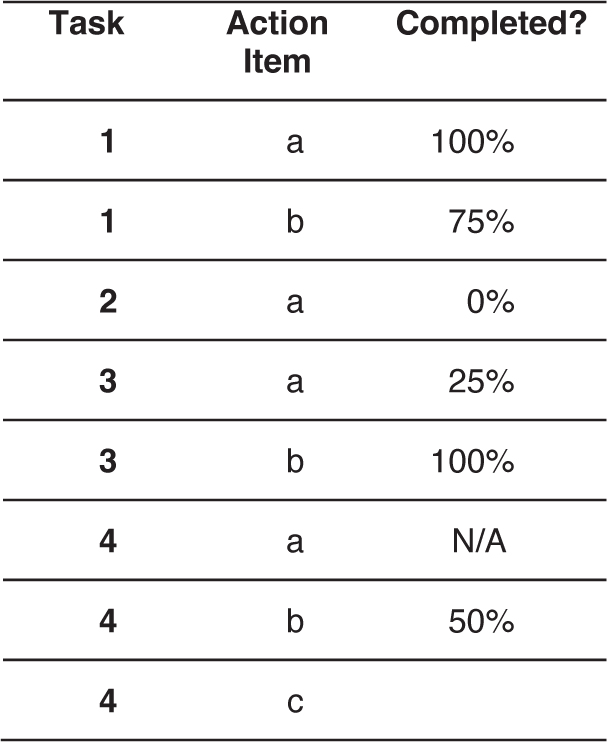
Long Description.
The column headers of the table are Task, Action Item, and Completed? The data given in the table row-wise are as follows: Row 1: 1, a, 100 percent. Row 2: 1, b, 75 percent. Row 3: 2, a, 0 percent. Row 4: 3, a, 25 percent. Row 5: 3, b, 100 percent. Row 6: 4, a, not applicable. Row 7: 4, b, 50 percent. Row 8: 4, c, Blank.
In this example:
- This implementation step has four tasks and eight action items.
- One of the action items is marked as N/A and one is blank (considered 0).
The Action Item complete value is calculated as the average of the remaining seven action item values: (100 + 75 + 0 + 25 + 100 + 50 + 0)/7 = 50%.
Thus, the “Action Items complete” value for this example implementation step is 50%.
The Task complete value is calculated as follows:
- Task 1 has two action items (100% and 75%). The average for Task 1 is (100 + 75)/2 = 87.5%.
- Task 2 has one action item (0%). The average for Task 2 is 0%.
- Task 3 has two action items (25% and 100%). The average for Task 3 is (25 + 100)/2 = 62.5%.
- Task 4 has three action items, but one is N/A and one is blank (which is treated as 0%). The average for Task 4 is (50 + 0)/2 = 25%.
- Then, the overall task average for this implementation step is calculated as the average of its four tasks: (87.5 + 0 + 62.5 + 25)/4 = 43.75%.
Please note that the tool rounds to zero decimal places. Therefore, the “Tasks complete” for this example would be shown as 44%.
This page intentionally left blank.
Abbreviations and acronyms used without definitions in TRB publications: |
|
A4A |
Airlines for America |
AAAE |
American Association of Airport Executives |
AASHO |
American Association of State Highway Officials |
AASHTO |
American Association of State Highway and Transportation Officials |
ACI–NA |
Airports Council International–North America |
ACRP |
Airport Cooperative Research Program |
ADA |
Americans with Disabilities Act |
APTA |
American Public Transportation Association |
ASCE |
American Society of Civil Engineers |
ASME |
American Society of Mechanical Engineers |
ASTM |
American Society for Testing and Materials |
ATA |
American Trucking Associations |
CTAA |
Community Transportation Association of America |
CTBSSP |
Commercial Truck and Bus Safety Synthesis Program |
DHS |
Department of Homeland Security |
DOE |
Department of Energy |
EPA |
Environmental Protection Agency |
FAA |
Federal Aviation Administration |
FAST |
Fixing Americaʼs Surface Transportation Act (2015) |
FHWA |
Federal Highway Administration |
FMCSA |
Federal Motor Carrier Safety Administration |
FRA |
Federal Railroad Administration |
FTA |
Federal Transit Administration |
GHSA |
Governors Highway Safety Association |
HMCRP |
Hazardous Materials Cooperative Research Program |
IEEE |
Institute of Electrical and Electronics Engineers |
ISTEA |
Intermodal Surface Transportation Efficiency Act of 1991 |
ITE |
Institute of Transportation Engineers |
MAP-21 |
Moving Ahead for Progress in the 21st Century Act (2012) |
NASA |
National Aeronautics and Space Administration |
NASAO |
National Association of State Aviation Officials |
NCFRP |
National Cooperative Freight Research Program |
NCHRP |
National Cooperative Highway Research Program |
NHTSA |
National Highway Traffic Safety Administration |
NTSB |
National Transportation Safety Board |
PHMSA |
Pipeline and Hazardous Materials Safety Administration |
RITA |
Research and Innovative Technology Administration |
SAE |
Society of Automotive Engineers |
SAFETEA-LU |
Safe, Accountable, Flexible, Efficient Transportation Equity Act: A Legacy for Users (2005) |
TCRP |
Transit Cooperative Research Program |
TEA-21 |
Transportation Equity Act for the 21st Century (1998) |
TRB |
Transportation Research Board |
TSA |
Transportation Security Administration |
U.S. DOT |
United States Department of Transportation |

Transportation Research Board
500 Fifth Street, NW
Washington, DC 20001