State DOT Policies and Practices on the Use of Corrosion-Resistant Reinforcing Bars (2025)
Chapter: 2 Literature Review
CHAPTER 2
Literature Review
This literature review summarizes the current body of knowledge with respect to CRRB performance as well as associated design recommendations and decision-making approaches for selecting among alternative types of CRRBs. As discussed in Chapter 1, the bar types forming the scope of this review are epoxy-coated steel, galvanized steel, steel with multilayer coatings, stainless steel, chromium-alloyed steel, stainless steel clad, and FRP reinforcing bars.
Characteristics of CRRBs
This section discusses prior literature documenting the durability performance, mechanical properties, and bond characteristics (including development length) of CRRBs in the following three subsections:
Durability Performance
This section discusses the durability of the CRRB types that form the scope of this research, first organized by bar type. Because durability is related to the constituent materials in each bar type, these and the resulting corrosion protection mechanisms are briefly explained. The current state of practice and durability concerns are also discussed, as is the durability performance as described qualitatively and quantitatively in prior laboratory and field studies (to the extent such information is available).
Numerous metrics exist for describing durability performance. From a design perspective, the most informative metric is arguably expected service life; this is reported where possible. However, the current state of practice lacks a means to predict service life as a function of CRRB type and the numerous additional parameters (e.g., environment, concrete mix design, and fabrication and construction quality) that affect the service life. Therefore, it is emphasized that the reported values for service life are representative of the specific conditions from which these results were obtained and that service lives in other situations may have significant differences.
Metrics that are based on corrosion mechanisms may provide greater understanding of expected performance in general situations. For metallic bars, the corrosion mechanism can be broadly considered to have two phases: a time to corrosion initiation and a corrosion rate following initiation. Furthermore, the time to corrosion initiation is related to the chloride concentration threshold at which corrosion initiates. This is known as the critical chloride threshold and is a key metric that provides a scientific basis for comparing the performance of alternative types of CRRBs. Furthermore, the chloride exposure on the external surface of the concrete, the concrete cover, and the permeability characteristics of the concrete can be used to estimate the amount of time it will take for the chloride concentration at the depth of the rebar to reach the critical chloride
threshold. This amount of time is typically assumed to be the time of corrosion initiation. Various authors define corrosion resistance using one or more of these metrics.
An additional metric of interest is the time to concrete cracking, which is based on the previously discussed metrics in addition to the amount of internal pressure exerted on the concrete by the volumetric increase of corroding metal. Because this volumetric increase and the diffusive properties of the chemical compounds formed during corrosion vary for different types of CRRBs, the time to cracking can vary even for similar amounts of corrosion. Therefore, this metric, the corrosion resistance metrics discussed in this previous paragraph, and combinations thereof are all considered under the umbrella term durability in this section and subsequently.
Following such discussions for each bar type, a comparison of key factors describing durability (to the extent possible) and other advantages and disadvantages of each CRRB type concludes this section. It is noted that several literature reviews on CRRB, either in general or on specific types, have been previously performed (e.g., Brito and Kurda 2021; NACE International 2018; and Yeomans 2004). Findings from these studies have been considered and supplemented with additional research resulting from state DOT-sponsored research conducted in the last 20 years (from 2004 to the present) and other relevant sources throughout the following discussion.
Epoxy-Coated Steel
Epoxy-coated black steel reinforcing bars consist of fusion-bonded epoxy applied to a black steel reinforcing bar. This epoxy coating provides a physical barrier between the underlying steel bars and the corrosive effects of water, oxygen, and chlorides. Therefore, the quality of this coating and its bond to the steel are the critical parameters affecting the performance of epoxy-coated steel reinforcing bars.
This bar type was first used in bridges in 1973 and is now widely used, with the quality of the coating and bond evolving over this period of time. In evaluating the durability of epoxy-coated bars as reported in the literature, it is useful to consider the time period of these studies relative to the prevailing quality control methods in effect during the time period being represented. NACE International (2018) summarizes the evolution in quality control requirements for epoxy-coated reinforcing bars as described by various versions of the ASTM specifications for epoxy-coated rebar (ASTM 2022b). Some of the notable milestones in this evolution from a durability perspective include publishing the first version of these specifications in 1981; requiring all damage to be patched and limiting the repair area to 1% in 1990; increasing the requirements for the bend test (a measure of coating ductility and adhesion) in 1994; reducing the time between preparing the surface and coating the bars in 1995; introducing requirements for a cathodic disbondment test and limiting outdoor storage in 1997; and increasing the range of allowable coating thicknesses from 5 to 9 mils to 7 to 12 mils in 2007.
In addition to initial adhesion properties, one factor that may contribute to diminished performance of epoxy-coated reinforcing bars is loss of adhesion of the coating over time. It has been demonstrated that chlorides exacerbate the loss of adhesion (Darwin et al. 2011), but Pincheira et al. (2015) also noted loss of adhesion in noncorroded bars, leading them to conclude that this effect is not solely caused by chlorides. Similarly, Smith and Virmani (1996) observed coating disbondment and softening in field samples with “prolonged exposure to a moist environment.”
There is contradictory information on the significance of this loss of adhesion. Lee (2008) concluded from FHWA laboratory research that coating disbondment did not mean that the epoxy coating failed to provide corrosion protection. Conversely, Pyć et al. (2000) observed visible signs of corrosion underneath coatings with a lack of adhesion that were taken from bridge decks in Virginia that had been in service from between 4 and 20 years. Smith and Virmani (1996) similarly stated that the amount of disbondment appeared to influence performance in field
evaluations of bridges in 10 states and Canada. McKenzie (1993) also noted corrosion beneath locations of repaired coatings. In an effort to improve adhesion, Darwin et al. (2011) evaluated epoxies with higher than typical adhesive properties but did not observe these to result in improved corrosion performance when used in concrete.
Another issue that has been demonstrated as affecting the performance of epoxy-coated reinforcing bars is exposure to ultraviolet (UV) rays. Darwin et al. (2020) report that laboratory-simulated UV exposure equivalent to as low as 1.2 months resulted in significantly diminished performance.
During the long duration over which epoxy-coated reinforcing bars have been used, the effect of these issues on performance has been widely examined through field and laboratory studies. Laboratory studies have evaluated the performance of epoxy coatings with both ideal coatings and those with intentionally created defects simulating construction and handling damage. These have also included embedding the bars in both sound and intentionally cracked concrete.
One of the primary findings from these studies is that the concentration of chloride needed to initiate corrosion is higher (and the corrosion rate is lower) in epoxy-coated bars compared to that of black bars. NACE International (2018) completed an extensive literature review stating that the evidence supporting this conclusion is clear. More recently, Brito and Kurda (2021) completed a literature review with the same conclusion. Darwin et al. (2011) clarify that this finding is also true for epoxy-coated bars when they were intentionally damaged with ⅛-inch diameter defects.
Despite the clear relative relationship between the chloride concentration threshold and corrosion rates of epoxy-coated bars and black bars, there is a wide variety in the specific values reported for these metrics. For example, Smith and Virmani (1996) and Donnelly et al. (2011) performed field evaluations of bridge decks with chloride levels greater than the chloride concentration threshold for black bars. More specifically, the lowest chloride concentration at which active corrosion of an undamaged epoxy-coated reinforcing bar was observed was five times the black bar threshold, although uncorroded epoxy-coated bars also existed in chloride concentrations 10 times the black bar threshold. Similarly, Manafpour et al. (2016) found the chloride concentration thresholds of epoxy-coated bars as compared to black bars in bridge decks in Pennsylvania to differ by a factor of seven. NACE International (2018) attributes variability such as this and throughout the literature to factors such as the quality of the coating, the size and frequency of coating defects, exposure conditions, and properties of the concrete.
In considering the field performance of epoxy-coated bars, many studies have reported generally good performance and have identified exceptions to this trend. One comprehensive study from FHWA (Smith and Virmani 1996) evaluated the field performance of 92 bridge decks in 10 states and Canada that had been in service for up to 20 years. No evidence of corrosion was found on 81% of the samples. The exceptions were noted as being associated with cracked concrete, shallow cover, high permeability concrete, high chloride concentrations, or some combination of these. Similarly, in field evaluations of eight bridge decks in Iowa, the most significant corrosion damage was correlated with the bridges that had full-depth transverse cracks, apparent plastic shrinkage cracking, and isolated conditions of low cover (Donnelly et al. 2011).
Field evaluations by Lawler et al. (2011) and Pincheira et al. (2008, 2015) also reported that epoxy-coated reinforcing bars were generally in good condition with little active corrosion after up to 35 years of service in West Virginia and 30 years of service in Minneapolis–Saint Paul, respectively. Pincheira et al. (2015) note that the exceptions in this case were near or at expansion joints, or where cracks had developed. At these locations, chloride ion concentrations at the bar level were 5 lb/yd3 or greater. Therefore, corrosion in these situations is not surprising because this concentration exceeds the chloride threshold for corrosion initiation in epoxy-coated bars reported in any of the other studies reviewed.
Another indication of good field performance of epoxy-coated reinforcing bars is the observation made in NACE International (2018) with respect to older bridge decks that have epoxy-coated bars in the top mat and black bars in the bottom mat (a practice no longer recommended for reasons that will be discussed later). NACE International notes that many of these have visible evidence of corrosion on the bottom surfaces (where the chloride concentration is presumably lower) but does not show evidence of corrosion on the top surfaces.
An example of performance issues of epoxy-coated reinforcing bars is detailed by Sagüés et al. (2010) regarding extensive damage to concrete reinforced with epoxy-coated bars that had been in service for as little as six years when problems were first observed. These bars were located in a marine environment (Florida Keys) and variable performance occurred that correlated with concrete permeability. In situations in which concrete with relatively high permeability (quantified by a diffusion rate of approximately 10–7 cm2/s) was used, deterioration was observed. However, similar bridges having diffusion rates one or two orders of magnitude lower were observed to have acceptable performance during the same timeframe. The corrosion was found to be associated with disbondment. Galvanic corrosion was also noted as being a likely factor in this situation. NACE International (2018) also describes this situation as being “a first generation epoxy coating product, with indications of poor manufacturing and significant amounts of preexisting coating breaks.”
Lau and Sagüés (2009) evaluated the condition of similar bridges with intermediate permeability after an additional decade and found visually apparent corrosion damage. However, no severe corrosion was observed in members with very low-permeability concrete and large cover distances.
NACE International (2018) describes other examples of performance issues, such as a punch-through failure of a bridge deck in Virginia at the location of leaking construction joints and cracking, which resulted in a high chloride concentration (Sprinkel et al. 2010). NACE International (2018) also references a 2005 review by the Ontario Ministry of Transportation that describes several bridges containing epoxy-coated reinforcing bars that failed to provide a 20-year service life (Pianca et al. 2005).
Another category of research with respect to epoxy-coated reinforcing bars is that of studies that have performed data analysis using the condition ratings reported in owners’ inspection data to predict service life or time in a specific condition state. One example of this is the work of Boatman (2010), who estimated a 70-year service life for concrete bridge decks with epoxy-coated reinforcing bars (compared to 35 years for black bars). However, Boatman states that the age range available in the dataset (approximately 30 years) may detract from the accuracy of this prediction.
Manafpour et al. (2016) and Agrawal and Kawaguchi (2009) performed similar data analyses focusing on the duration that epoxy-coated reinforcing bars may be expected to remain at various condition ratings based on the National Bridge Inventory (NBI) rating system (FHWA 1995) for bridges in Pennsylvania and New York, respectively. Manafpour et al. (2016) supplemented their analyses with field investigations, which were conducted on bridges with ages ranging from 5 years to slightly more than 50 years; it was found that decks with epoxy-coated (and galvanized) reinforcing bars lasted about 18% longer than black bars at condition rating 8. Agrawal and Kawaguchi (2009) compared the time it took for epoxy-coated and black reinforcing bars to transition between various conditions states. To transition from condition state 7 to condition state 5, 38 and 32 years are reported for these two bar types, respectively. To transition from condition state 7 to condition state 4, the time reported ranged from 60 to 62 years and from 43 to 49 years (depending on the mathematical analysis used), respectively.
Other insight into service life comes from the field evaluations of bridge decks in Iowa performed by Donnelly et al. (2011). In that evaluation, all five decks that were greater than 23 years old showed corrosion-related damage, although for four of these bridges, the average damaged area was less than 4% of the deck area. Service life predictions were made based on these observations
to estimate that these decks may reach 10% damage at ages ranging from 29 to 60 years. These calculations were based on conservative assumptions of past surface chloride concentrations and were compared to service life estimates of 9 to 23 years for black bars. Similarly, a study of two sets of bridge decks in West Virginia (one built with black bars and the other built with epoxy-coated bars) showed a service life extension of at least 15 years (Lawler et al. 2011).
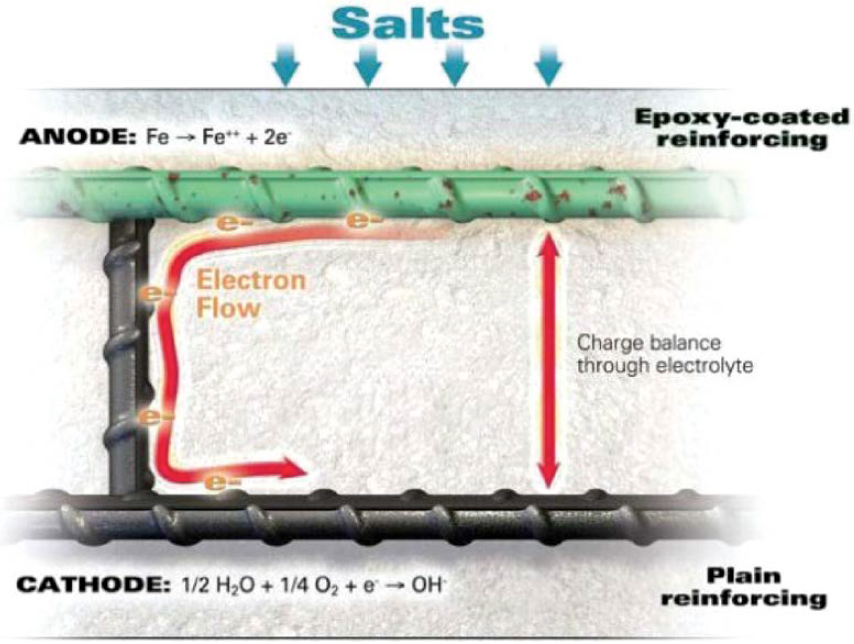
A prior common practice was to use epoxy-coated reinforcing bars in the top mat and black bars in the bottom mat of reinforced concrete bridge decks; this is often referenced as an example of “mixed bar” design. The premise of this design strategy was to place the more corrosion-resistant material in the region of the deck more prone to chloride exposure due to deicing agents applied to the bridge deck and to place the lower-cost black bars where chloride concentrations are typically lower. However, several laboratory studies (e.g., McKenzie 1993; Lee and Krauss 2003) observed that this resulted in significantly diminished performance of the epoxy-coated bars because a galvanic cell formed between the two types of bars, accelerating corrosion.
Figure 2-1 illustrates that in these situations, there is a difference in voltage potential, with the epoxy-coated bars functioning as anodes and the black bars functioning as cathodes. Therefore, it has been suggested that the service life extension of designs using epoxy-coated reinforcing bars in both mats was more than twice that of using epoxy-coated reinforcing bars in the top mat only (NACE International 2018).
Field evaluations have also supported laboratory findings such as this one. For example, field evaluations of eight bridge decks in Iowa demonstrated a relative ranking of performance, with bridge decks having only epoxy-coated reinforcing bars performing the best, those with all black bars performing the worst, and those with a mix of bar types performing somewhere in between. Furthermore, in a large-scale comparison of over 500 bridges with only epoxy-coated reinforcing
bars compared to those with a mix of epoxy-coated and black bars, Treat and Dymond (2021) observed that bridges with only epoxy-coated bars had less deterioration.
In summary, there is a large body of evidence to support the conclusion that epoxy-coated bars provide significant benefits over black bars. The primary limitation of this bar type is potential damage to the coating during construction. Isolated instances of poor performance have been associated with combinations of high chloride concentrations (including locally high concentrations due to more structural detailing, construction quality, or deferred maintenance), high permeability concrete, cracked concrete, or low concrete cover. Strategies exist to mitigate these effects related to concrete permeability, cover, and (to some extent) cracking. Furthermore, epoxy-coated bars have been subjected to evolving quality standards. Therefore, improved performance of modern epoxy-coated bars is a reasonable expectation.
Galvanized Steel
Galvanized steel reinforcing bars consist of a galvanized coating applied to a black steel bar. Specifications and commercial products exist for applying this coating through submerging the bars in a molten bath of zinc (i.e., hot-dip galvanizing as described in ASTM A767) or a process of uninterrupted passage of long lengths of bars through a molten bath of zinc or zinc alloy (i.e., continuous hot-dip galvanizing as described in ASTM A1094). Although hot-dip galvanizing has had variations in use as reinforcing steel in the United States since the 1930s (NACE International 2018), the continuous galvanized process is a much more recent development; the first ASTM specifications for this manufacturing process were published in 2015. Continuous galvanizing results in more flexible coating that is marketed as better able to withstand bending. Test results by Darwin et al. (2020) substantiate this claim by showing corrosion losses of an order of magnitude lower for bent continuously galvanized bars as compared to bent hot-dip galvanized bars, while the straight bars manufactured using these two methods performed similarly. The improved tolerance of continuously galvanized bars to bending can also result in fabrication and construction efficiencies. However, because they are a more recent innovation, continuously galvanized reinforcing bars have not yet been in service long enough to obtain relevant field data on their performance.
One aspect of the concept underlying this bar type is similar to that for epoxy-coated bars: to apply a barrier coating that prevents or delays water and chlorides from reaching the steel bars. However, in the case of galvanized bars, a metallurgical bond forms between the steel and the galvanized layer. An additional functionality of this bar type is that the zinc in the galvanized layer provides cathodic protection because it will sacrificially corrode relative to steel. The benefit of this property is evidenced through testing by Darwin et al. (2020) that showed no statistically significant differences in corrosion potential for damaged and undamaged reinforcing bars manufactured by either hot-dip or continuous galvanizing. Although the simulated damage in this case was limited to 0.13-inch diameter penetrations, Yeomans (2004) states that the length over which the cathodic protection benefit can extend is as much as three times this distance (0.39 inches, or 10 mm) from areas where the coating has been removed.
An additional benefit of galvanized bars and the preferential corrosion of the zinc layer is that the corrosion products of zinc are relatively dense compared to the iron oxides that are formed during the corrosion of steel. Therefore, the volumetric expansion that occurs during the corrosion process is minimized, which in turn reduces the associated internal pressures in the concrete that tend to lead to concrete cracking. Yeomans (2004) states that this effect is also minimized because the corrosion products that form on galvanized bars tend to precipitate away from the surface of the bar, also lowering the radial stresses exerted by corroding reinforcing bars. O’Reilly et al. (2017) quantified this effect and found that twice the corrosion loss was needed for galvanized bars to result in concrete cracking compared with black bars. Furthermore, bars with galvanized coatings are more damage resistant than epoxy-coated bars.
Because modestly damaged galvanized coatings can continue to provide some corrosion protection to the steel through cathodic protection and because coating damage is less frequently observed, coating damage is less of a concern for galvanized bars compared to that for epoxy-coated bars. Therefore, instead of focusing on coating performance, the literature on galvanizing bars is largely focused on quantifying performance, particularly relative to black bars. A recent literature review by Sagüés and Alexander (2022) also recommended additional evaluation of two issues related to the chemical processes that occur when galvanized bars are placed inside of curing concrete.
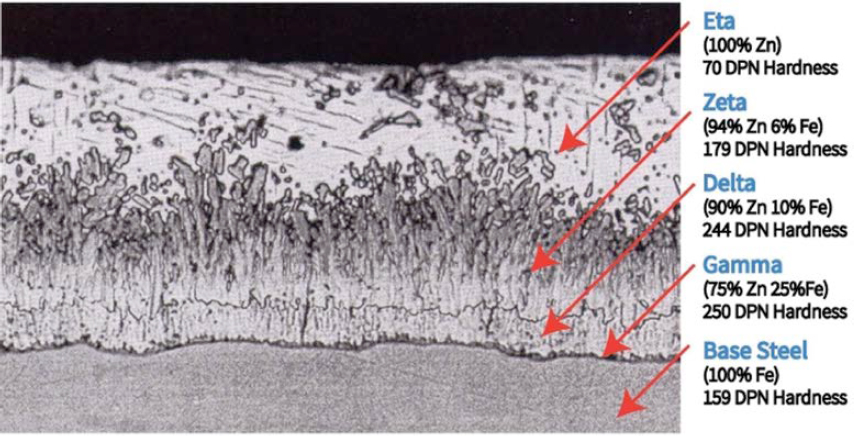
One of the issues highlighted was that of controlling concrete mix designs to control the pH of the concrete pore water during curing. The second issue highlighted by Sagüés and Alexander (2022) was the importance of a minimum thickness of the Eta layer of the galvanizing (i.e., the outer pure zinc layer with no metallurgical bonding with the steel; see Figure 2-2). This value was recommended by Sagüés and Alexander to be 10µm (based on a reference to Andrade and Alonso 2004) plus an unspecified tolerance for “pre-installation wastage.”
These two issues are important for related reasons; Sagüés and Alexander (2022) concluded that favorable resistance to chlorides occurs when the pH remains between 11.8 and 13.2 and the Eta layer is of sufficient thickness to remain present during the liquid phase of concrete curing. This promotes the development of a protective zinc layer that is in place when the pH later increases—several hours or days after mixing. Andrade and Alonso (2004) clarify that if the pH during curing is less than 12.8 +/− 0.1, the protective layer forms within “the first hours after mixing,” but for pH values between about 12.8 and 13.2, the protective layer develops “slowly,” with the galvanizing continuing to dissolve during this process. Furthermore, if the pH during curing exceeds 13.2, the protective layer will not develop, but reasonable precautions can prevent this situation (Andrade and Alonso, 2004).
Regarding the observed performance of galvanized reinforcing bars, variable findings are reported in the literature. Yet an extensive body of research suggests that the corrosion resistance (in terms of chloride concentration threshold) of galvanized reinforcing bars is 2 to 4 times that of black bars. For example, in an extensive literature review of 88 publications focused on laboratory and field performance of galvanized reinforcing bars, Yeomans (2004) discusses the trends that have emerged from these studies over time. This review highlights that although earlier
studies often contained a lack of evidence that galvanized coatings provided a benefit relative to the performance of black bars, more recent research (since the mid-1980s) provides consistent evidence that galvanized reinforcing bars are superior to black bars in terms of the chloride concentration needed to initiate corrosion and therefore the time to corrosion initiation. This ratio was reported by Yeomans to be typically between 2 and 4 in the studies they reviewed and sometimes as high as 10 (particularly in field studies).
A more recent international literature review by Brito and Kurda (2021) concluded a similar level of relative performance in terms of chloride resistance of galvanized reinforcing bars to black bars (having the same factor of 2 to 4 times the corrosion resistance). A recent literature review by Sagüés and Alexander (2022) sponsored by the Florida Department of Transportation (FDOT) concluded that the critical chloride threshold for corrosion initiation of galvanized reinforcing bars is 1.5 to 4 times the threshold of black bars. Although NACE International (2018) cites several additional exceptions to this (situations in which galvanized and black bars performed similarly in one or more aspects, as do Darwin et al. 2009 and Maeda et al. 2020), they conclude that assuming galvanized reinforcing bars have a chloride concentration threshold of 2 to 5 times that black bars “merits consideration as a working estimate.” Darwin et al. (2020) extended these considerations to estimate time to first repair of bridge decks with alternative reinforcing bar types. In these estimates, time to first repair is defined as the sum of the time to corrosion initiation, the time from corrosion initiation to concrete cracking, and 10 years (representing the time from first observed cracking to repair). Time to corrosion initiation is calculated based on the experimentally determined chloride concentration threshold and an assumed cover depth of 2.5 inches (in the estimates reported herein) compared to field data regarding the chloride content at varying depths in bridge decks. The bridge decks considered were an aggregated population of bridge decks in Kansas having average annual daily traffic (AADT) greater than 7,500 and represented monolithic decks and those with conventional as well as 5% and 7% silica fume overlays. Furthermore, time from corrosion initiation to concrete cracking is estimated based on the experimentally determined corrosion rates compared to an estimate of the corrosion loss to cause cracking based on an empirical equation developed by Darwin et al. (2011). Information on the rationale for the selection of 10 years between the first observed cracking and repair is not available. The estimates by Darwin et al. (2020) on time to first repair resulted in galvanized bars having the maximum estimated time to first repair of the bar types included in this synthesis (with an estimated time of 50 years) compared to 22 years for black bars, 43 years for epoxy-coated bars, and 41 years for chromium-alloyed bars with 9% chromium.
Limited evaluations have been performed on the field performance of galvanized reinforcing bars, but these have generally shown favorable results. For example, Andrade et al. (2001) conducted testing of samples that had been submerged in natural seawater for 10 years and did not show any signs of corrosion. Yeomans (2004) also summarized previous field surveys of two bridges in Pennsylvania. For one of these, the galvanized coating thickness remained above the minimum specified thickness after 27 years despite the chloride concentration being 2.5 times higher than the chloride concentration threshold for black bars. In the second bridge of similar age and chloride concentrations, at least 67% of the minimum specified coating thickness remained.
In summary, there is a large and variable dataset regarding the laboratory performance of galvanized reinforcing bars in concrete. This generally supports the notion that the theoretical benefits of galvanizing—a durable and cathodically protective coating—are manifested in reality. Reasons for the variability observed in the existing performance results may be related to the rate of zinc loss relative to concrete curing actions as affected by variations in the chemistry of the concrete. Several previous large-scale literature reviews have concluded that the relative durability of galvanized bars is at least 1.5 to 4 times higher than that of black bars. Limited field evaluations support that this typical laboratory performance does translate to field performance (at least to some extent) and that perhaps larger performance gains (relative to black bars) can result in some situations.
Steel with Multilayer Coatings
The example of steel with multilayer coatings considered in this work is black bars coated with a zinc-based coating and then coated with epoxy. The zinc-based coating can be applied by galvanizing or metallizing (i.e., thermal spray). Specifications for this reinforcing bar type are provided by ASTM A1055 (ASTM 2022c), which specifies that if galvanizing is used, the continuous galvanizing process specified by ASTM A1094 shall be used. The rationale of using this bar type is to mitigate the problems that can occur when epoxy coatings are damaged, by providing a zinc-rich layer that provides an additional barrier as well as cathodic protection (in the same manner as was described for galvanized bars). This bar type contains the advantages of both epoxy-coated bars and galvanized bars while (theoretically) mitigating some of the disadvantages of epoxy-coated bars. At present, there is insufficient data to support whether this theoretical advantage can be realized in practical situations.
A limited number of laboratory studies report conflicting or inconclusive results. For example, Clemeña (2003) compared the performance of multilayer coated bars with several other bar types to conclude that the corrosion resistance of the multilayer coated bars was superior to that of black and chromium-alloyed bars, with chloride corrosion thresholds 8 to 10 times the value for the black bars. Epoxy-coated bars were not included as a basis of comparison in this study. In contrast, Darwin et al. (2011) compared the performance of multilayer coated bars to epoxy only-coated bars to find that multilayer coated bars had lower chloride thresholds for corrosion initiation and higher initial corrosion rates because of preferential corrosion of the zinc. Yet, because of a slightly extended period of time between corrosion initiation and concrete cracking for multilayer coated bars compared to epoxy-coated bars, it was estimated that multilayer coatings would provide a modest one additional year of estimated time to first repair (56 years versus 55 years for epoxy-coated bars). Darwin et al. (2011) also evaluated the progression disbondment in epoxy-coated and multilayer coated bars to find favorable disbondment rates for multilayer coatings of between 1.0 and 8.8 mm2/week in the accelerated testing conditions, compared to 3.2 to 25 mm2/week for the epoxy-coated bars.
Stainless Steel
Stainless steel bars are generally regarded as having durability superior to that of other metallic bars. This occurs due to relatively high amounts of chromium as an alloying element [16.0% to 24.5% for stainless steel reinforcing bar options that meet the requirements of ASTM A995, Standard Specification for Plain and Deformed Stainless-Steel Bars for Concrete Reinforcement (2015)]. When chromium interacts with water and oxygen, chromium oxide is formed, which then forms a highly protective barrier on exposed surfaces. The ASTM A995 specification lists seven different types of stainless steels, organized into two categories (austenitic and duplex steels), yet hundreds of different types exist with chromium contents ranging between 12% and 55%.
Several standard test methods have been formalized to evaluate the corrosion resistance of stainless steel reinforcing bars. ASTM A955, Standard Specification for Deformed and Plain Stainless-Steel Bars for Concrete Reinforcement (ASTM 2020c), specifies two options for this evaluation: a rapid microcell test (consisting of bars in an aqueous solution that simulates concrete pore water) and a cracked beam test (consisting of three bars embedded in a rectangular cross section).
ASTM A955 also specifies corrosion performance metrics that must be achieved from one of these tests. For the microcell test, the average corrosion rate from a minimum of five specimens cannot exceed 0.25 µm/yr at any time during the test, and no single specimen can exceed a corrosion rate of 0.50 µm/yr. Similar requirements exist for the cracked beam test except that the average corrosion rate cannot exceed 0.20 µm/yr at any time during this test. When employing this standard, the maximum corrosion rate of stainless steel bars can be known with confidence. AASHTO M 334 (the AASHTO parallel to ASTM A955) gives alternative and optional test methods for assessing the durability of stainless steel reinforcing bars.
No significant technical concerns are reported in the literature regarding stainless steel. However, one frequently mentioned concern is its cost. Therefore, minimizing this cost has been a focus in some prior research. From a review of the literature available on stainless steel at the time of the study, Hartt et al. (2004) point out that there is a strong relationship between the concentration of the costly alloying elements (chromium and molybdenum) and corrosion performance. Therefore, they recommend a strategy of identifying the type of stainless steel that provides satisfactory durability for the design life at the lowest life-cycle cost. NACE International (2018) proposes a similar concept, defining the most cost-effective option as the least-cost option that will remain passive at the chloride concentration expected at the reinforcing depth.
Based on this premise, Presuel-Moreno et al. (2008) conducted a literature review to identify lower-cost stainless steel grades relative to 300 Series stainless steels. Presuel-Moreno et al. identified low-nickel austenitic stainless steels, such as 201LN, and several types of ferritic or martensitic stainless steels containing 12% to 15% chromium as promising materials for meeting this goal. Although low-nickel austenitic stainless steels will likely have less durability compared to traditional 300 Series stainless steels, their performance versus cost may lead to life-cycle cost advantages relative to both traditional stainless steel and epoxy-coated steel. Therefore, low-nickel 200 Series stainless steels were recommended for further evaluation.
Prior experimental testing of outdoor exposures of stainless steel-reinforced concrete specimens is summarized by NACE International (2018). This summary concludes that these corrosion rates were “much lower” than those for black bars and that “in many cases corrosion rate was negligible.” Using other laboratory methods, O’Reilly et al. (2017) tested austenitic (type UNS S24100) and duplex (UNS S32304) stainless steel reinforcing bars using rapid microcell and cracked beam tests as described by ASTM A955. They found that for properly pickled duplex stainless steel, the corrosion rate was less than 0.2 µm/yr in cracked beam tests (data from austenitic cracked beam tests are not reported) and was “essentially zero” in the rapid microcell tests for both types of stainless steel evaluated. These results meet the ASTM A955 requirements.
Additionally, Scully and Hurley (2007) report laboratory testing in which the chloride concentration threshold of a duplex stainless steel not contained in the ASTM specifications (type 2101 LDX) was 29 times that of black bars, while an austenitic stainless steel (type 316LN) resisted more than 58 times the chloride concentration of black bars prior to corrosion initiation. These results led to the conclusion that the type 316LN and similar stainless steels could last 100 years or more before corrosion initiation.
Scully et al. (2007) also evaluated corrosion mechanisms after initiation and highlighted that stainless steel also has a lower corrosion rate after initiation, which minimizes associated propagation of the radial stresses that can lead to concrete cracking. Furthermore, they state that the lateral spread of corrosion is expected to be limited, which will also reduce the likelihood of cracking compared to situations in other bar types. The volumetric expansion of the corrosion products was also evaluated; it was concluded that these are similar to black bars, alleviating concerns that this may be a detracting feature that could have outweighed other benefits of stainless steel bars. It is noted that the results were based on bars in the pickled condition, which is often a requirement in specifications and is known to result in better performance (O’Reilly et al. 2017).
Studies reporting field performance of stainless steel reinforcing bars are limited. Most studies that have been performed have been conducted on bridges that have not been in service for sufficient time for there to be an expectation that chlorides would have penetrated to the rebar depth. One notable exception to this is a bridge in a severe marine environment as quantified by International Standards Organization (ISO) category C5 (ISO 2012a) in Yucatan, Mexico, that is reported in NACE International (2018). Evaluation of this 75-year-old structure showed that only 1 out of 145 pier caps showed corrosion-induced concrete cracking. NACE International
also notes that the concrete of this structure had a high porosity, exacerbating the severity of the exposure condition.
Research has also been performed using deterioration modeling and reliability analysis to estimate the service life of stainless steel-reinforced concrete. Guest et al. (2020) performed deterioration modeling to estimate the life spans of bridge decks in Canada. They conclude that, because of the high chloride concentration threshold of stainless steel reinforcing bars, these decks are likely to exceed the typical 75-year service life. Kefiler et al. (2019) used a test method implemented by the European Committee for Iron and Steel Standardization (ECISS 2014) to determine the chloride threshold at which corrosion initiates in stainless steel bars. Tests were performed on pickled and unpickled ferritic stainless steel and unpickled austenitic and duplex stainless steel. These results were used to estimate service life. The results showed a minimum service life of 145 years for all pickled steels when considering a reliability factor of 1.5 and a minimum service of 200 years (the maximum value considered in the testing) for all pickled steels when considering a reliability factor of 0.5.
A final consideration with respect to stainless steel is the use of stainless steel in combination with black bars. Similar to mixed bar designs that used epoxy-coated bars, Darwin et al. (2013) found that mixed bar designs with stainless and black bars corroded significantly more than when stainless steel was the sole reinforcing bar type. Furthermore, the mixed bar design performance in some cases more closely matched the results when black bars were the sole reinforcing bar type. NACE International (2018) also discusses this issue, but in considering the situation of selective use, such as stainless steel use being limited to repair area or other critical locations, conclude that galvanic corrosion is not a problem. The reasons stated for this are the relatively small difference in cathodic potential of stainless steel and actively corroding black steel and the assumption that the area ratio between anodes and cathodes will be favorable in this situation.
In summary, the literature reports several positive features regarding stainless steel reinforcing bars. These include high chloride concentration thresholds for corrosion initiation and slow corrosion rates, which have led to service life estimates (based on reliability analysis) of 145 to 200 years depending on the reliability factor selected. The limited field observations that are available support that these are reasonable estimates for many aggressive situations. The largest disadvantage of stainless steel seems to be its high initial cost.
Chromium-Alloyed Steel
Chapter 1 defined chromium-alloyed steel bars as those alloyed with chromium, but at proportions lower than the threshold for classification as stainless steel. Three types of these bars are specified in ASTM A1035 (ASTM 2023a). The primary difference between these three bar types is their chromium content, with the range of the smallest proportion of chromium being 2.0% to 3.9% and the largest proportion ranging from 8.0% to 10.9%. The microstructure of chromium-alloyed steel bars also leads to high minimum specified yield strengths (100 ksi or 120 ksi). NACE International (2018) reports that this bar type has been used in over 100 bridge projects in North America and in the Middle East region. Somewhat similar to stainless steel bars, these bar types have not yet been in service for a sufficient amount of time for field data on long-term performance to have been assessed.
The durability concept of chromium-alloyed steel bars is to provide a more corrosion-resistant alloy relative to black bars at a more affordable initial cost than that of stainless steel bars. By decreasing the chromium content, cost and durability are both reduced but not proportionally. Although the chromium content of chromium-alloyed steel bars is lower than that of black bars by roughly a factor of two, the reduction in corrosion protection is far greater. A synthesis of the data reported in NACE International (2018) indicates that compared to stainless steel bars, chromium-alloyed bars have lower chloride concentration thresholds for corrosion initiation
(0.33% to 1.7% weight of concrete compared to 2.5% to 8.0% weight of concrete). Comparing the minimum and maximum of these ranges for each bar type results in the stainless steel bars having 5 to 8 times the chloride concentration threshold. Furthermore, although the corrosion rate of stainless steel approaches zero, chromium-alloyed steel bars have a nonzero corrosion rate. Little is reported on the corrosion chemistry of chromium-alloyed steel bars, but this suggests the formation of markedly different compounds during the corrosion process that lack the protective capabilities of the passivated outer layer stainless steel.
Comparing the performance of chromium-alloyed bars containing approximately 9% chromium (i.e., ASTM A1035 Type CS) to black bars, a literature review by NACE International (2018) summarizes that the chloride concentration threshold values range between 2.7 and 6.0 times those of black bars. They further conclude that “pending the development of further data, the overall evidence suggests that a chloride threshold value of four times that of [black steel] can be used as a working assumption for estimating times for corrosion initiation.” Darwin et al. (2002) and Gong et al. (2004) reach this same conclusion regarding corrosion initiation but found that the differences in corrosion rate of chromium-alloyed and black bars are generally less than the differences in corrosion initiation, with the corrosion rate of chromium-alloyed bars being one-third to two-thirds the rate for black bars.
Only one of the studies considered in developing these conclusions (in the literature reviewed by NACE International) regarding the relative performance of chromium-alloyed and black bars used pickled specimens, as this practice is not common for chromium-alloyed steel bars. Farshadfar et al. (2018) showed that pickling can reduce corrosion losses in 9% chromium bars by half but did not see a significant benefit to this practice for bars with 4% chromium content.
Darwin et al. (2002) and Gong et al. (2004) also performed various laboratory tests to compare the performance of chromium-alloyed and epoxy-coated bars for the purpose of informing life-cycle cost analyses. This comparison showed that although corrosion initiation was delayed for chromium-alloyed bars, the corrosion rate after initiation was higher in the chromium-alloyed bars. This led to the conclusion that epoxy-coated steel provides superior corrosion performance to chromium-alloyed steel, with service life estimates for typical conditions in South Dakota of 30 years for bridge decks reinforced with chromium-alloyed bars and 40 years if epoxy-coated reinforcing bars were used instead; service life estimates were 10 to 25 years if using black steel. These estimates were based on epoxy-coated bars with ⅛-inch diameter intentional defects in the coating and a corrosion rate calculated based on the total surface area of the bar. This results in these epoxy-coated bars having very low average corrosion rates. If corrosion rates are instead calculated based on the exposed area of the bar, the calculated corrosion rate increases by a factor of 100. Therefore, the relative performance between chromium-alloyed and epoxy-coated bars described in this synthesis may be a reasonable description of average performance but may not capture the service life of the worst-case (i.e., damaged coating) locations in epoxy-coated bars.
Farshadfar et al. (2018) investigated the performance of chromium-alloyed bars with an epoxy coating. The epoxy coating was not found to have a statistically significant effect on the coated bars with 2% chromium, but the coated bars with 4% chromium were found to have corrosion rates of 15% to 30% of the rate of the conventional epoxy-coated bars. The life-cycle cost analysis (LCCA) performed by Farshadfar et al. thus showed the coated 4% chromium bars to be the most cost-effective option of those considered in their study. The coated chromium-alloyed bars were also observed to have 50% to 80% of the disbondment of the coating compared to conventional epoxy-coated bars. This benefit was most significant for the bars with higher chromium content.
The Presuel-Moreno et al. (2008) literature review (aimed at identifying lower-cost stainless steel grades relative to the 300 Series stainless steels) summarizes the status of chromium-alloyed steels as that they “may also be of interest because they offer a marginal gain in corrosion
performance at a very low cost.” Although their performance relative to black bars is well supported, their performance relative to epoxy-coated bars (which are economical, widely available, and familiar to owners, designers, and constructors) is less clear. Some prior studies have concluded that they are not cost-effective from either a first-cost or life-cycle cost perspective, assuming a one-to-one replacement of bars. However, their higher yield strength may provide benefits that epoxy-coated bars cannot. Furthermore, a recent study with epoxy-coated chromium-alloyed bars (Farshadfar et al. 2018) shows that this may be a promising CRRB alternative. NACE International (2018) summarizes a study by Hartt et al. (2007) leading to the suggestion that mixed bar designs with chromium-alloyed and black steel are not a favorable combination for maximizing durability.
Stainless Steel Clad
Stainless steel clad bars consist of a stainless steel coating (typically type 304 or 316L stainless steel) that is metallurgically bonded to black bars. Stainless steel clad bars have the advantages of the durability of stainless steel bars (assuming that the coating is intact) while also being more economical than solid stainless steel bars due to the smaller volume of stainless steel used. The Virginia DOT (VDOT) drafted special provisions for the use of stainless steel clad bars in 1999 that can be found in the appendix of work by Clemeña et al. (2003), which were used in the implementation of stainless steel clad bars on the project described by Clemeña et al. Commercial production of these bars has been limited and sporadic, which has prevented its use (NACE International 2018).
Stainless steel clad bars perform similarly to stainless steel bars when the coating is intact; performance concerns relate to instances in which the coating is missing or damaged. One of these situations is at the cut ends of bars. Clemeña et al. (2003) reported that a deviation from the specifications to seal the cut ends with epoxy instead gluing a plastic cap to the end of the bars was ineffective because the glue did not prevent the caps from detaching. This resulted in corrosion at the ends of the bars prior to their installation. NACE International (2018) summarizes other strategies for sealing the cut ends of stainless steel clad bars, including having a proprietary stainless steel cap attached with an organic adhesive and welding overlays (Cui and Sagüés 2006; Cross et al. 2001) as giving favorable results for the proprietary method and variability, (apparently based on welding quality) for the welded overlays.
More unpredictable breach of the stainless steel cladding may occur as a result of fabrication errors during manufacturing or because of damage during transportation or construction. In these aspects, the coating is relatively tolerant to mechanical impact and has good ductility. Clemeña et al. (2003) provide support for the abrasion resistance of stainless steel clad bars by stating that no cracks or other forms of damage were observed on installed stainless steel clad bars during the construction of a bridge deck in Virginia. This was in contrast to visual comparison with epoxy-coated bars used elsewhere in the construction of the same bridge, which was attributed to poor handling procedures for these bars. Furthermore, NACE International (2018) concludes that stainless steel cladding bars in concrete with coating voids of diameters from 0.5 to 1.0 mm have “rather high corrosion resistance” based on testing by Clemeña and Virmani (2004) and Cui (2003). It is also reasonable to expect slower corrosion rates in stainless steel clad bars with breached coatings compared to that of black bars—data from Bertolini et al. (1998), Jaggi et al. (1999), and Cui (2003) and summarized by NACE International (2018)—report less cathodic current in the former situation. However, if voids in the coating are larger, the durability is similar to that of black bars (NACE International 2018, citing research from Hurley and Sculley 2006, Cross et al. 2001, and Cui and Sagüés 2006).
The bond between the coating and steel bars was also a concern regarding stainless steel clad bars in work by Clemeña et al. (2003), based on previous experiences with lack of sufficient adhesion.
However, systematic evaluation of this by slicing bent bars showed no evidence of lack of adhesion, leading to the conclusion that the adhesion issues in earlier fabrications had been resolved.
With successful mitigation of these issues, laboratory studies consistently support the corrosion resistance of stainless steel clad bars. Clemeña (2002) concluded based on a summary of prior laboratory testing performed by the Virginia Transportation Research Council that stainless steel clad bars and solid stainless steel bars could withstand the same chloride concentration without corroding, which was a level at least 15 times the corrosion threshold for black bars. Similar comparisons between stainless steel clad bars and black bars were reported by Scully and Hurley (2007) where the stainless steel clad bars had a chloride threshold 14 to 20 times that of black bars; however, the chloride resistance of solid stainless steel bars was at least four times that of the stainless steel clad bars in this study. Darwin et al. (2013) reported variability in results when assessing undamaged stainless steel clad bars relative to the requirements for solid stainless steel bars in ASTM A995. The requirements of the rapid macrocell test were consistently satisfied, but some specimens did not meet the requirements of the cracked beam test. This led to a recommendation to evaluate specific stainless steel clad bars prior to use. After exposing black, galvanized, epoxy-coated, and stainless steel clad reinforcing bars to seven years of various levels of chloride exposures, only the stainless steel clad bars showed no signs of corrosion in testing by Rasheeduzzafar et al. (1992).
Given the limited implementation of stainless steel clad bars, there is little documentation of field performance. Reporting on the construction of a bridge deck using stainless steel clad bars, Clemeña (2002) states that there were “no significant technical problems with substituting this type of bar for the black steel and epoxy coated bars currently used.” NACE International (2018) acknowledges that although there are limited field studies that demonstrating a lack of performance issues with this bar type, there are no field studies on this bar type in which bridges have been in service for sufficient time to expect that chlorides would have permeated to the reinforcement.
In a recent NCHRP IDEA project, published as NCHRP IDEA Final Report for Project 240: Stainless Steel Coated Rebar for Chloride Resistant Concrete Highway and Bridges (McAlpine 2023), two alternative manufacturing methods for manufacturing stainless steel clad bars were evaluated: (1) cold spray and (2) applying a stainless steel coating to a steel billet prior to hot rolling the rebar. This latter method was found to transition the coating from brittle to ductile behavior, allowing the bars to bend without cracking or delamination. Rapid macrocell corrosion testing demonstrated that the cold spray method resulted in 25% of the corrosion rate of black bars; the method of coating prior to hot rolling resulted in a corrosion rate of less than 10% of that of black bars.
Fiber-Reinforced Polymer
FRP reinforcing bars are composed of fibers embedded in a thermoset polymer matrix (typically vinyl ester or epoxy). Compared to metallic bars, FRP bars present advantages because of their unique degradation mechanisms, which do not cause expansive stresses that damage the concrete (ACI 2015). Durability of FRP bars is governed by the durability properties of the fiber, matrix, and fiber–matrix interface (typically depending on the choice of fiber sizing and its compatibility with the matrix resin), with most of the prior research being generalized by fiber type. The presence of defects (e.g., excessive voids and inadequate fiber saturation) during the manufacturing process can also play a role in the durability of the composite.
Extensive research has been conducted on the durability properties of glass fiber reinforced polymer (GFRP) bars, which culminated in an American Concrete Institute (ACI) design guide (ACI 2015). Commonly used types of glass fibers (E-Glass and S-Glass) in civil engineering applications have shown relatively poor resistance to moisture, alkali, and acids (Sen et al. 2002; Nkurunziza et al. 2005; Swit 2022). The research revealed that moisture absorption by the matrix in GFRP
composites leads to the plasticization of the matrix, causing a subsequent decrease in elastic modulus. Additionally, moisture infiltration can result in cracking of the fiber–matrix interface due to matrix swelling, osmotic pressures, and weakening of chemical bonds between the matrix and fibers (Nkurunziza et al. 2005). The most damaging environment for GFRP composites in concrete structures is high alkalinity (pH >13.5), which is typical in concrete leachate solution (Sen et al. 2002). High alkalinity can trigger various deterioration mechanisms, primarily the breakage of silica chains due to their reaction with hydroxide ions (OH-) and the hydrolysis of the glass network by OH- (Bashir et al. 2018). Moreover, it is well-documented that typical glass fibers and their composites are prone to stress corrosion cracking (Fujii et al. 1994; Schmitz and Metcalfe 1966), which leads to relatively poor performance of GFRP bars under high sustained loads (Benmokrane et al. 2019). The current design guidelines for bridges therefore limit the stress in GFRP bars that are under service loads to 30% of a bar’s guaranteed tensile strength (design tensile strength multiplied by the environmental reduction factor) unless the bar manufacturer can demonstrate that higher values can be safely utilized (AASHTO 2018). To address these durability issues, corrosion-resistant and alkali-resistant grades of glass fibers have been developed, but these are not yet commonly used in commercial applications.
Aramid fibers have better mechanical properties than glass fibers (Table 2-1). However, they are significantly more expensive and have notable durability issues, especially related to creep, moisture, and exposure to ultraviolet light (Benmokrane and Ali 2018). ACI (2015) recommends limiting tensile stress under service-level loads in aramid FRP (AFRP) bars to 30% of their guaranteed tensile strength to account for creep rupture failure mode. Basalt fibers emerged as a promising alternative to glass fibers due to their superior mechanical properties and reduced carbon footprint (Fiore et al. 2015). Although research is still underway to definitively characterize the long-term performance of basalt fibers, the current data indicate that their durability performance is better than that of GFRP bars (Kampmann et al. 2022). Design guidelines also do not provide explicit direction for the design of basalt FRP (BFRP)-reinforced concrete members. Carbon fibers are inert to the environments that are typical for civil infrastructure applications and exhibit superior durability properties to other fiber types. Consequently, in carbon FRP (CFRP), the property degradation is primarily driven by matrix and fiber–matrix interface deterioration. CFRP composites exhibit improved resistance to creep rupture; consequently, ACI (2015) recommends limiting the stress in CFRP bars that are under service loads to 55% of a bar’s guaranteed tensile strength.
In design, the effect of environmental exposure on the tensile properties of FRP bars is accounted for via the environmental reduction factors applied to the bar’s design tensile strength. ACI 440.1 design guidelines recognize the differences between FRP materials’ durability via differing environmental reduction factors (Table 2-1), which are applied to the design tensile strength of the bar. The same environmental reduction factors for GFRP bars are recommended in AASHTO (2018). Neither guideline recommends an environmental reduction factor for the tensile modulus. Furthermore, recognizing the susceptibility of GFRP bars to degradation in alkaline environments,
Table 2-1. Environmental reduction factors for various fibers and exposure conditions (ACI 2015).
| Exposure Condition | Fiber Type | Environmental Reduction Factor |
|---|---|---|
| Concrete not exposed to earth and weather | Carbon | 1.0 |
| Glass | 0.8 | |
| Aramid | 0.9 | |
| Concrete exposed to earth and weather | Carbon | 0.9 |
| Glass | 0.7 | |
| Aramid | 0.8 |
ASTM D8505 specifies limits on the maximum permitted moisture absorption and the minimum required property retention following standard accelerated conditioning in an alkali solution.
The most typical resins presently used in FRP bars are vinyl ester and epoxy. Older generations of bars utilized cheaper unsaturated polyester resins. While polyester resins can be designed to attain good mechanical properties, they often exhibit excessive shrinkage during curing and are prone to rapid degradation when exposed to moisture (Dagher et al. 2004). Bars with vinyl ester and epoxy resins typically perform better in terms of durability performance than those with polyester (Benmokrane et al. 2017). Although vinyl ester is typically preferred over epoxy due to its lower moisture uptake, ASTM D8505 allows the use of both resins in BFRP and GFRP bars provided that the specified physical and durability properties are met.
Fatigue resistance of FRP bars is another consideration when it comes to durability. As concrete decks sustain the moving concentrated loads, they may be subjected to accumulation of fatigue damage during their lifetime (Carvelli et al. 2010). Therefore, the focus of several studies was on comparing the fatigue performance of GFRP-reinforced decks to those with steel reinforcement, although the fatigue resistance of metallic reinforcing bars typically does not impose performance limitations. This research demonstrated that FRP-reinforced deck slabs have superior fatigue performance and approximately three times longer fatigue life than those reinforced with steel bars, likely due to the smaller mismatch in modulus between GFRP and concrete (El-Ragaby et al. 2007). Other studies have reported similar findings (Carvelli et al. 2010; El-Ragaby et al. 2007). Based on the tensile test data, however, it is generally recognized that CFRP exhibits improved fatigue behavior over other fibers. Recognizing the relative differences between fibers, ACI (2015) recommends limiting stress under service loads to the same values as those recommended for creep rupture, while AASHTO (2018) suggests limiting the same stress to 25% of the guaranteed tensile strength of GFRP bars.
Concrete cores with embedded GFRP bars were analyzed from 11 bridges across the United States with 15 to 20 years of service, exposed to various environmental conditions (Bencezcry et al. 2021). The study aimed to assess performance of GFRP reinforcement and durability, considering factors such as deicing salts, wet–dry cycles, and freeze–thaw cycles. Tests included chloride penetration depth, carbonation depth, and pH evaluations. The authors concluded that carbonation was widespread, with some cores showing carbonation depths surpassing 38 mm, potentially reaching GFRP bars. Chloride penetration was observed in most bridges and was attributed to deicing salts. Concrete pH was generally high (above 11), which is detrimental to GFRP bars, according to literature. The oldest bridges exhibited a pH average of 10, indicating corrosion initiation of the present internal steel reinforcement. However, no conclusive correlation between pH and GFRP bar degradation was established.
In a companion paper from the same study, Al-Khafaji et al. (2021) conducted mechanical and physical tests on the extracted GFRP bars, along with concrete tests, to evaluate the environment surrounding the bars. Findings suggest that GFRP bars could be a promising replacement for steel in bridge decks exposed to deicing salts. Experiments on bars concluded that the bars met or exceeded fiber mass content requirements, had a water uptake of below 1% in most cases, had low moisture content, and showed minimal evidence of microcracking. The glass transition temperature varied between 80°C and 115°C, exceeding the minimum specification requirement of 80°C. The authors reported interlaminar shear strength (ILSS) retention of 72% to 92%, and only a 2.5% reduction in tensile strength (in one bridge) after 17 years of service. However, an associated discussion paper (Meinheit 2022) notes that the tensile tests were performed using nonstandard specimens without adequate controls and therefore that the findings from the tensile tests may be misleading, particularly when considering a relatively significant degradation of the ILSS.
The challenge of repairing damaged GFRP-reinforced members (such as after an impact load or fire event) is not thoroughly addressed in the literature. Limited research in this area primarily
focused on fire-damaged GFRP-reinforced members, where repair with externally bonded FRP composites was evaluated as an option (Jafarzadeh and Nematzadeh 2022).
Comparison Among Bar Types
Table 2-2 summarizes the prior discussions from the perspectives of the durability relative to black bars, estimated time to first repair, other advantages, and disadvantages of each bar type. The values reported on durability and estimated time to first repair are meant to illustrate generalizations on relative performance only. The prior discussion has made clear that there is tremendous variability in the performance of any CRRB in any specific situation due to manufacturing quality, construction practices, concrete properties and chemistry, and the specific environment.
Table 2-2. Summary of literature on durability of CRRB.
| Bar Type | Durability Relative to Black Bars | Estimated Time to First Repair* | Other Advantages | Disadvantages |
|---|---|---|---|---|
| Epoxy-coated | Variable, ranging from 1.3 to 7.0 in representative studies | 491–552 | Variables affecting performance are well known | Construction damage to coating |
| Galvanized | Mostly 2.0–4.0; up to as large as 10 | 501 | Cathodic and barrier protection; relatively durable coating—especially when using continuous galvanizing method | Controlling concrete chemistry is necessary to maximize benefits |
| Steel with multilayer coatings | 8.0–10.0 in one study | 562 | Cathodic and barrier protection; improved bonding of epoxy coating | Uncertain cost-effectiveness |
| Stainless | up to 1,500 | >1003 | Nature of corrosion products are less likely to produce cracking in concrete | High initial cost |
| Chromium-alloyed | 4.0 | 381 | 100–120 ksi yield strength | Cost-effectiveness if only considering durability perspective |
| Stainless steel clad | Theoretically the same as stainless if coating not breached | >1003 | Cost-effectiveness | Concerns for breach of cladding |
| FRP | Infinite corrosion resistance | Unknown | Fatigue life; lightweight | Less familiarity among designers and contractors; high initial cost; potential degradation not easily detectable |
* Estimates are for the purpose of illustrating relative performance only. Times are specific to the scenario considered in determining these estimates, including the presence of an overlay for all bar types except stainless steel and stainless steel clad. Estimate for epoxy-coated bars is based on averaging corrosion rate over total bar area (in contrast to localized corrosion at points where epoxy coating was damaged).
Therefore, reporting definitive values on relative performance is not possible. It is emphasized that the values in Table 2-2 should not be taken as such or extrapolated to scenarios beyond the generalizations that they represent.
The durability information in Table 2-2 is generally in agreement with prior large-scale literature reviews (NACE International 2018; Brito and Kurda 2021; Yeomans 2004) when these references reported such metrics. It is noted that the scope of the data available on durability for differing bar types varies tremendously; values based on limited data are noted. The estimated time to first repair values reported for metallic bars are based on average values from a series of studies simulating bridge decks by Ji et al. (2005), Darwin et al. (2011), Farshadfar et al. (2018), and Darwin et al. (2020). This body of work used the same testing methodology to evaluate numerous CRRB alternatives, including all of the metallic types listed. Therefore, this series of work provides a rare opportunity in durability testing to compare the relative performance of different types of bars independent of environmental variables. It is again emphasized that these results are specific to the assumptions made and conditions employed in these studies and, even then, are clearly acknowledged to be estimates. They should not be extrapolated to other situations, but they are useful for informing relative performance.
An overall summary of the information in Table 2-2 is that there are not significant differences in the overall durability findings for epoxy-coated, galvanized, steel with multilayer coatings, and chromium-alloyed steel (although each of these may have differing performance in specific scenarios). The expected service lives of these bar types are all advantageous relative to an average estimated time to first repair of 18 years for bridge decks reinforced with black bars in these same studies. Also, these bar types all show significantly less than the expected durability performance of stainless steel and stainless steel clad bars.
Table 2-2 and the previous discussion have indicated that the durability of epoxy-coated bars is variable. Decades of research and evolving quality control on these bars has the potential to lead to improved performance of members reinforced with these bar types. The largest disadvantage of this bar type is the relative ease with which the coating is damaged. Several studies have investigated techniques for improving the bond and durability of these coatings to have an impact on damage, with minimal success at present. Additional information on the other entries in Table 2-2 can be found in previous sections.
Mechanical Properties
Although the use of CRRBs is typically motivated by durability considerations, some CRRBs have mechanical properties that differ from historical practice, which results in possible design implications. The reinforcing bar types forming the scope of this research are at a state of maturity at which their mechanical properties are standardized in the following material specifications: black and epoxy-coated in AASHTO M 31; galvanized in ASTM A767 (hot-dip galvanizing) and ASTM A1094 (continuous galvanizing); chromium-alloyed in ASTM A1035; stainless steel in AASHTO M 334, stainless steel clad bars in AASHTO M 329, and FRP in ASTM D8505. This section summarizes these properties and their associated implications for the implementation of CRRB.
Metallic Bars
For metallic reinforcing bars, the key material properties are the yield, the ultimate stresses, and the ductility. Ductility is quantified by percent elongation (for which the requirements differ as a function of bar diameter). Table 2-3 summarizes these requirements for common representative grades of each reinforcing bar type. In general, the data for Grade 60 bars are reported because these are most commonly used. However, the lowest grade for chromium-alloyed
Table 2-3. Representative mechanical properties for metallic reinforcing bars.
| Bar Type | Yield Stress (ksi) | Ultimate Stress (ksi) | Elongation (%) |
|---|---|---|---|
| Black1 | 60 | 80 | 7–9 |
| Epoxy | 60 | 80 | 7–9 |
| Galvanized | 60 | 80 | 7–9 |
| Chromium-alloyed | 100 | 150 | 6–7 |
| Stainless, grade 60 | 60 | 90 | 7–9 |
| Stainless, grade 100 | 100 | 120 | 6–7 |
| Stainless clad | 60 | 90 | 7–9 |
1 AASHTO M 31/ASTM 615; ASTM A706. Grade 60 bars have the same yield and ultimate stress, but 10% to 14% elongation.
reinforcing bars is Grade 100. Therefore, the data for both Grade 60 and Grade 100 stainless steel reinforcing bars are included for comparison.
The data in Table 2-3 show that these mechanical properties are relatively consistent across all CRRB alternatives of a specific grade. Furthermore, it is highlighted that black bars and coated black bars have the same or similar mechanical property specifications. For example, epoxy-coated and galvanized bars share the same mechanical property specifications as black bars. This is directly the case for epoxy-coated bars, which must meet the same mechanical requirements in AASHTO M 31 and the equivalent ASTM specification (A615). This is indirectly the case with galvanized bars, with both of the ASTM specifications for galvanized bars incorporating ASTM A615 (ASTM 2022a) by reference. Tanks and Sharp (2015) concluded that the mechanical properties of stainless steel clad bars were also analogous to carbon steel based on their testing, with the yield stress, ultimate stress, and elongation meeting the provisional requirements for stainless steel clad bars that existed at the time (AASHTO 2004).
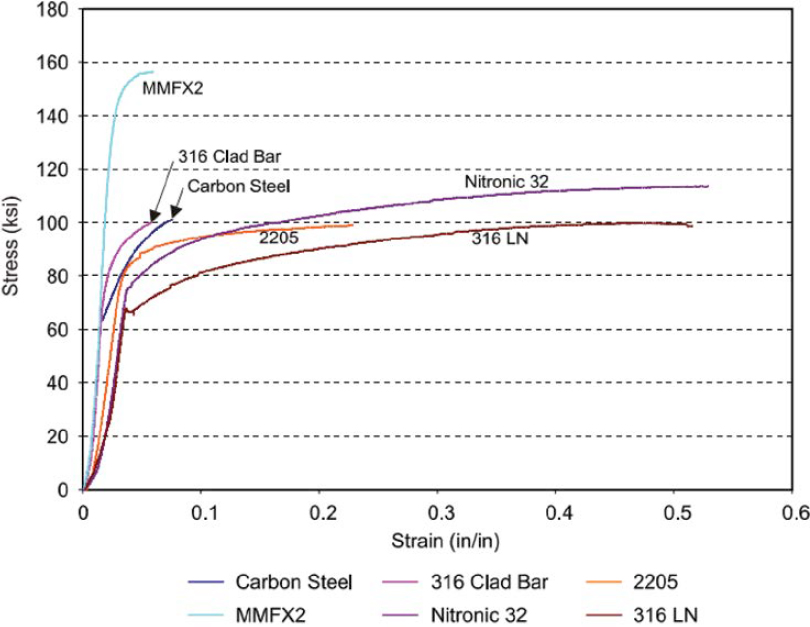
However, with a change to a higher material grade (i.e., to 100 ksi from 60 ksi), several aspects of the mechanical behavior of CRRBs deserve increased attention. In addition to the increase in strength, Figure 2-3 highlights that chromium-alloyed (labeled as MMFX2, which contains 8% to 10% chromium and is now marketed as ChromX or ASTM 1035 CS) and some stainless steels (e.g., the 2205 series in Figure 2-3) can differ from uncoated and coated black bars in terms of their lack of a defined yield plateau, their ductility, their elastic modulus, or all of these. The most straightforward of these changes to consider is the lack of a defined yield plateau. In these situations, the specifications cited previously state that the yield stress should be determined through the commonly accepted 2% offset method (AASHTO 2004; ASTM 2023a).
NCHRP Report 679: Design of Concrete Structures Using High-Strength Steel Reinforcement (Shahrooz et al. 2011) evaluated the effects of the higher yield stress of chromium-alloyed steel reinforcing bars as this was higher than the design specifications allowed at the time. This substantiated the use of yield strengths of up to 100 ksi in design for concrete with compressive strengths of up to 10 ksi (and in some cases 15 ksi).
A related concern is that the stress and strain at service load (i.e., 60% of the yield stress) is significantly higher than when using Grade 60 reinforcing bars. This leads to a potential concern regarding crack widths. However, Shahrooz et al. found that the crack widths in their flexural tests were within accepted limits and were predictable using current specifications when limiting service stresses to 60 ksi (i.e., 60% of the 100 ksi yield stress as done for conventional reinforcing bars). Similarly, after four years of crack monitoring of an in-service bridge using ASTM A1035 chromium-alloyed steel reinforcing bars, Chiaw and Harik (2006) found no measurable cracks (i.e., no cracks of a size greater than ![]() inch) despite there being no discussion of limiting the service stresses in these members.
inch) despite there being no discussion of limiting the service stresses in these members.
In related considerations of ductility, Shahrooz et al. (2011) proposed increasing the net tensile strain in extreme tension steel at nominal resistance from a minimum of 0.005 to 0.008 for tension and from a maximum of 0.002 to 0.004 for compression for ASTM A1035 chromium-alloyed steel reinforcing bars. Experimental testing of beams reinforced with this bar type confirmed that these limits ensured acceptable ductility, predictable behavior, and performance similar to that of beams reinforced with conventional reinforcing bars. Alternatively, Salomon and Moen (2014) investigated crack widths and ductility in experimental testing of one-way slabs with alternative types of CRRB. They found that it was necessary to decrease the cover from the original value of 2.5 inches to 2.0 inches and to decrease the reinforcement area for chromium-alloyed and duplex stainless steel reinforcing bars to achieve crack widths and ductility consistent with AASHTO requirements.
Figure 2-3 shows the typical finding that the elastic modulus of chromium-alloyed bars is equivalent to that of black bars. While the typically assumed value for this is 29,000 ksi, both Salomon and Moen (2014) and McGurn (1999) report this value to be 30,000 ksi. In contrast, the elastic modulus is reported as 29,000 ksi for four variations of austenitic stainless steel and 28,000 ksi (i.e., 3% less) for duplex stainless steel (McGurn 1999). Salomon and Moen (2014) report an elastic modulus of 27,000 ksi for Unified Numbering System (UNS) S32304 duplex stainless steel. In assessing moment–curvature relationships of one-way slabs using these materials, Salomon and Moen concluded that the modulus of black, epoxy-coated, chromium-alloyed, and austenitic reinforcing bars resulted in similar flexural stiffness, but that the duplex stainless specimen had lower flexural stiffness.
FRP Bars
FRP bars are manufactured via pultrusion, with continuous fibers oriented parallel with the longitudinal axis of the bar. Fibers provide strength and stiffness to the bar, while the matrix ensures uniform stress distribution across the bar cross section and fiber alignment and protects
fibers from environmental exposure. Compared to metallic bars, FRP bars have several key differences in terms of mechanical properties. FRP bars are linear elastic to failure (i.e., they do not exhibit yield). In addition, the fibers are aligned in a specific direction to provide strength and stiffness along that direction, rendering them anisotropic. Consequently, elastic modulus, strength, and coefficient of thermal expansion are orientation dependent.
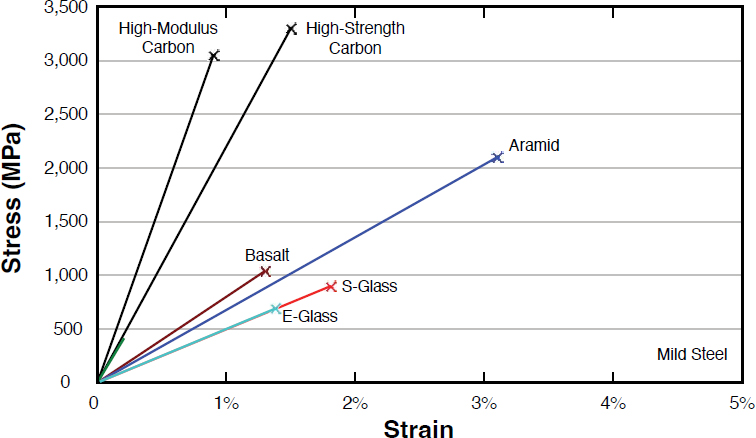
The most important mechanical properties of FRP bars are elastic modulus and tensile strength. Figure 2-4 demonstrates a graphical comparison of stress–strain curves for some FRP fiber types against mild steel. These stress–strain curves demonstrate that FRP bars remain linearly elastic until failure, without exhibiting ductile behavior. The only bar types currently specified are GFRP and BFRP bars (ASTM D8505), in which a minimum modulus of elasticity is specified as 8,700 ksi (60 GPa). The minimum tensile strength requirement varies with the bar diameter, taking size effect into account. These properties primarily depend on the type of fiber used and the fiber volume fraction, as indicated in Table 2-4.
The primary application of interest for FRP bars is in concrete decks. The following paragraphs provide an overview of relevant recent studies focused on mechanical performance, such as deflections, strains, and live-load distribution factors.
Lin et al. (2013) conducted laboratory and field load tests on precast box girders and deck slabs reinforced with GFRP bars. Following successful laboratory evaluation of the decks with respect
Table 2-4. Ranges of mechanical properties for FRP bars as per ACI 440.1 for fiber volume fractions ranging from 0.5 to 0.7.
| Mechanical Property | GFRP | CFRP | AFRP |
|---|---|---|---|
| Tensile strength, ksi (MPa) |
70–230 (483–690) |
87–535 (600–3,690) |
250–368 (1,720–2,540) |
| Elastic modulus, ×103 ksi (GPa) |
5.1–7.4 (35–51) |
15.9–84.0 (120–580) |
6.0–18.2 (41–125) |
| Rupture strain, % | 1.2–3.1 | 0.5–1.7 | 1.9–4.4 |
to the relevant service and strength-limit state design limits, the decks were erected on a bridge in Missouri. Deck slabs were erected on steel girders, while the box girders were transversely post-tensioned with CFRP tendons. Live-load field tests indicated that the deflections were 18% and 7% of the allowable deflection for steel-girder span and concrete box-girder span, respectively [using AASHTO (2010) to determine deflection limits]. In addition, the impact factors following 50 load cases were well below the AASHTO design limit.
Holden et al. (2014) conducted a comprehensive study on the performance of precast concrete deck panels reinforced with GFRP bars, focusing on the Beaver Creek Bridge (in Utah) over a three-year monitoring period. The bridge exhibited evidence of good composite action with prestressed girders. Deck deflections remained within the AASHTO (2009a) code limits, with the highest recorded deflection of 0.15 inches over a two-year period, well below the 1.32-inch design limit. The highest strain in the deck was 121 microstrain, below the code limit of 138 microstrain, indicating satisfactory performance. The vertical accelerations in the girders were minimal, indicating dynamic stability, and the dynamic deflections were much smaller than the static deflections. The live-load moment and shear distribution factors demonstrated even load sharing between the girders, with experimentally measured factors being lower than those recommended by AASHTO. The finite element bridge model verified the field data, showing that deck deflections and stresses were within code design limits.
Abdelkarim et al. (2020) conducted an investigation of a steel-girder bridge in Quebec, which had a deck reinforced with both galvanized steel and GFRP bars. Live-load field tests and visual inspections conducted over a period of 6.5 years demonstrated adequate performance of the bridge. The study also highlighted the disparity between live-load distribution factors of 0.57 prescribed by the AASHTO Load and Resistance Factor Bridge Design Specifications (LRFD BDS) and those observed in field tests (0.27), indicating that AASHTO load distribution factors may be overly conservative for GFRP-reinforced members, consistent with the finding from prior research on bridges with steel-reinforced decks.
McRory et al. (2020) compared the static load performance of full-scale steel-reinforced decks and two types of GFRP-reinforced decks, one constructed with normal concrete and the other constructed with alkali-resistant fiberglass macrofiber-reinforced concrete. All decks were first subjected to 1- and 2-million fatigue cycles before being monotonically loaded to failure. The authors concluded that all three decks had satisfactory performance at both service and ultimate load levels. The authors, however, noted that the addition of fiberglass macrofibers alleviated bond loss observed in GFRP-reinforced decks without macrofibers.
Several studies evaluated the field performance of GFRP bars in concrete decks following several years of service. Shafei et al. (2020; 2023) evaluated the performance of GFRP-reinforced concrete decks on two bridges in Minnesota that were constructed in 2018. The field strain measurements and load tests performed indicated that decks performed as expected and in accordance with the design assumptions. Overall, the authors concluded that no significant differences were observed between comparable steel- and GFRP-reinforced decks.
Due to their brittle nature, design with FRP bars requires consideration of limit states typically not considered in steel-reinforced or steel-prestressed concrete design. For example, in flexure design, depending on the reinforcement ratio, failure of an FRP-reinforced beam might be controlled by either FRP rupture or by concrete crushing failure modes, both resulting in a brittle failure without much warning. Consequently, the flexural strength reduction factors are in the 0.55 to 0.75 range depending on the tensile strain in the GFRP reinforcement (AASHTO 2018), significantly below those typically encountered in steel-reinforced concrete design. Furthermore, due to the low axial stiffness of GFRP bars, the cracks in GFRP-reinforced members are significantly wider than those in steel-reinforced concrete members with an equal area of reinforcement,
resulting in the neutral axis being typically located shallower in the section. Because of this, the contribution of aggregate interlock and uncracked concrete in compression is lower. Moreover, due to the anisotropic nature of FRP bars, resistance of dowel action is considered to be reduced. Consequently, the concrete contribution to shear resistance is lower than that of comparable steel-reinforced members (ACI 2015; AASHTO 2018).
For lower-stiffness FRP bars, such as aramid, glass, and basalt, however, serviceability limit states or creep rupture and fatigue often control the design (ACI 2015). In serviceability design, crack widths are limited, not necessarily to limit environmental exposure of FRP bars (since FRP bars are corrosion-resistant), but mostly for aesthetics, creep rupture, shear effect, and concrete durability concerns (ACI 2015; AASHTO 2018). To limit crack widths in FRP-reinforced members, a maximum permitted spacing of bars is recommended, which depends on the elastic modulus of a bar, maximum permitted crack width, clear cover, stress in FRP bar under service loads, and a bond reduction factor that accounts for the degree of bond between FRP bars and concrete (AASHTO 2018). This bond reduction factor has been a topic of ongoing debate; the factor varies widely between manufacturers, ranging from 0.62 to 1.45 according to the most recent data (Shield et al. 2019), where a factor of 1.0 is representative of FRP bars having bond characteristics similar to uncoated steel bars (ACI 2015). A factor of 0.83 has been historically recommended in the design guidelines (ACI 2015). More recent evidence confirmed that a reduction coefficient of 0.83 is applicable to sand-coated bars, while a coefficient of 0.71 has been recommended for all other bars (Shield et al. 2019). In FRP-reinforced members, deflections are typically computed using the effective moment of inertia approach similar to that of steel-reinforced concrete members, based on the equation developed by Bischoff (2005).
AASHTO (2018) provides comprehensive guidelines for the design of GFRP-reinforced concrete bridge members. Additionally, some states have developed their own design guidelines (e.g., T.Y. Lin International 2016 and FDOT 2024).
Bond and Development Length
The bond between the reinforcing bars and the concrete is essential to the intended structural behavior of reinforced concrete members. The properties of this bond are represented in design codes through the concept of development length. The AASHTO LRFD BDS gives equations for development length for various loading scenarios. These equations are based on uncoated (e.g., black) reinforcing bars (AASHTO 2020a).
Because coated bars can have different (typically lower) coefficients of friction, modification factors to the AASHTO LRFD BDS equations increase the development length for coated bars. This is increased by 50% for epoxy-coated bars that have a cover distance of less than three times the bar diameter or a clear distance between bars of less than six times the bar diameter (compared to that of uncoated bars). Otherwise, the development length of epoxy-coated bars is increased by 20% relative to that of uncoated bars. No coating factors are given for any other coating type in the AASHTO LRFD BDS.
Textured epoxy-coated (TEC) bars have been developed in efforts to improve the slip resistance and therefore decrease development lengths. Although recent research (Pérez-Claros and Andrawes 2023) has shown that textured epoxy-coated bars can demonstrate improved initial slip resistance, additional study was recommended to provide statistical confidence in structural performance. Pérez-Claros and Andrawes also note that there are still challenges to overcome with TEC bars, particularly with respect to bond strength and manufacturing consistency.
As another form of coated bars, the slip resistance and development length of galvanized bars has been a topic of research. The general consensus of these studies is that no special modifications
are needed with respect to the development lengths used with galvanized bars relative to existing design codes. For example, Brito and Kurda (2021) concluded from an extensive international literature review that the bond strength between galvanized bars and concrete is similar to the behavior of epoxy-coated bars in concrete. A literature review by Andrade et al. (2001) also concluded that there was not a cause for concern regarding bond strength for galvanized bars. They supported this conclusion by performing pull-out and beam tests comparing the performance of specimens with black and galvanized bars that had been exposed to natural seawater for 10 years. They found that both types of bars exceeded the requirements of The International Union of Laboratories and Experts in Construction Materials, Systems and Structures (RILEM 1994a, 1994b).
Similarly, Hamad and Mike (2005) compared the structural performance of galvanized and black bars in flexural testing of six full-scale beams (three containing black bars and three containing galvanized bars). They found that galvanized bars and black bars resulted in the same failure mode (splitting of the concrete cover in the splice region) and that the bond strength of galvanized bars was a minimum of 94% of that of black bars. In a domestic study by Phares et al. (2014), nine galvanized specimens were compared to nine epoxy-coated specimens (three each of three different diameters of each bar type) using ASTM A944 (2010) test protocols. They concluded that “no notable difference in either peak load, slip, or failure mode could be identified.” However, some inconsistent trends were observed, and Phares et al. recommended further study with larger sample sizes and more variables considered before incorporating galvanized bars into design codes. No studies were found on the development length of any other type of coated metallic bar.
Considering uncoated CRRB, the development length of ASTM A1035 chromium-alloyed steel reinforcing bars was specifically studied by Darwin et al. (2002) and in NCHRP Report 679: Design of Concrete Structures Using High-Strength Steel Reinforcement (Shahrooz et al. 2011). Darwin et al. (2002) concluded that these bars provide satisfactory bond strength with concrete based on their relative rib areas being consistent with current practice. A similar conclusion was reached by Ahlhorn and DenHartigh (2023) for both stainless steel bars (with a minimum yield strength of 80 ksi) and a bar referenced as “high-strength, high-chromium,” which appears to be analogous to ASTM A1035 bars. Based on statistical analysis of 250 bond tests without transverse reinforcement, Ahlhorn and DenHartigh concluded that the observed bond strengths were generally greater than those expected from current development length equations and that existing equations can therefore be directly applied to the bar types and sizes (#4 and #6) considered in their scope of work. Shahrooz et al. (2011) confirmed the applicability of the current AASHTO development lengths for uncoated straight and hooked ASTM A1035 bars. However, it was noted that it was essential to provide cover and confinement in accordance with the current design requirements in order to achieve this result.
Ciancone et al. (2008) evaluated the development length of both ASTM A1035 chromium-alloyed and high-strength stainless steel (yield strength exceeding 100 ksi) hooked reinforcing bars in testing specifically simulating the anchorage forces needed to fully develop strut and tie behavior. Similar to Shahrooz et al., Ciancone et al.’s testing of specimens with and without confinement also highlighted the importance of this variable in this situation. Based on Ciancone et al.’s results of unconfined specimens, a 30% increase in the development length of these bar types relative to that of epoxy-coated bars was proposed. Ciancone et al. also note that increasing the development length did not necessarily result in increased capacity or ductility; they hypothesize that transverse reinforcement may be required to fully develop these high-strength bars in these situations.
Bond of FRP bar to concrete depends on the bar manufacturing process, mechanical properties of the bar, and environmental conditions (ACI 2015). The bond stress transfer mechanism of FRP bars is different from steel in that the bond stresses are transferred between concrete and FRP fibers through a relatively thin resin layer on the surface of the FRP bars. Due to the low
strength of the resin, a possible bond failure mode includes shear failure of the resin-rich interfacial region. To enhance the mechanical bond between the FRP bars and concrete, FRP bars are typically manufactured with ribs (similar to steel bars) or, more commonly, sand-coated (ACI 2015). In bridge design, AASHTO (2018) recommends a development length equation that was developed by Wambeke and Shield (2006) from a database of 296 bond tests, and is computed as a function of bar location in the section (i.e., to account for the “top bar” effect), specified compressive strength of concrete, GFRP bar stress at ultimate, cover and bar spacing, and bar diameter. The design stress in FRP bars can also be provided with hooks. Mechanical anchoring devices are permitted, provided that their performance is verified by laboratory tests (AASHTO 2018).
Decision-Making Tools
Two primary—and related—decision-making concepts often motivating the use of CRRBs are LCCA and service life design. A discussion of prior studies on CRRBs that have incorporated these concepts is described in the following two subsections.
Life-Cycle Cost Analyses of CRRBs
Because there is typically a cost premium for CRRB, various studies have been conducted to consider the life-cycle cost of CRRBs to more holistically assess the economic impact of using CRRB. In other words, these studies can be used to determine whether the higher cost premium for various types of CRRBs is economically justified based on the need for lower maintenance costs over the life of the structure. This section will first give an overview of the methodologies that exist for performing LCCA, then summarize results of LCCA of CRRB alternatives, and conclude with discussion of the key variables affecting these findings.
Methodologies
A general framework for LCCA is given by ASTM E917 (ASTM 2017). Although this standard pertains to buildings and building systems, the general concepts are also relevant to the LCCA of bridges. These include the following key steps:
- Identify objectives, alternatives, and constraints
- Establish assumptions
- Compile cost data
- Compute life-cycle cost for each alternative and identify the minimum
- Choose alternative based on LCCA and considerations of risk, uncertainty, unquantifiable effects, and funding constraints
ASTM E917 also identifies typical types of assumptions that must be determined. Those relevant to typical bridges are:
- Calculations in terms of present value or annual value
- The study period (e.g., life-cycle)
- Inflation rate used for future costs
- Discount rate considering time value of money
- Comprehensiveness
LCCA of bridges is described in NCHRP Report 483: Bridge Life-Cycle Cost Analysis (Hawk 2003). This framework expands the typical considerations of initial and maintenance costs to also include failure cost due to vulnerability and uncertainty, in order to create a range and probabilistic distribution of expected costs. Owner and user costs to consider that are specific to bridges are also listed. Probabilistic models have also been created by Labi et al. (2014), Cadenazzi et al. (2021), and
Shen et al. (2021) to account for one of the largest uncertainties in performing LCCA of CRRB: the time until repair will be needed. Results from Cadenazzi et al. were based on estimated repair times from Life-365 software (Silica Fume Association 2017) and showed a smaller spread of costs for FRP compared to black bars, implying more confidence in the results for this CRRB alternative. In contrast, the scope of Shen et al.’s analysis included consideration of the uncertainty in the repair times for epoxy-coated, galvanized, chromium-alloyed, and stainless steel reinforcing bars, while Labi et al. considered black, epoxy-coated, stainless steel, and stainless steel clad reinforcing bars. Furthermore, Gombeda et al. (2022) note that ASTM A955 specifies corrosion rates for stainless steel, which is the only material for which there are such performance requirements (ASTM 2015). Frameworks for more readily performing LCCA include Bridge Design Aid 402-01 from the Indiana Department of Transportation (InDOT 2019). This framework contains a sample spreadsheet populated with examples, data on estimated service lives for various bridge components (independent of reinforcing bar type), and commentary regarding suggested considerations with respect to design life, agency costs, and user costs.
Results
Regardless of the framework and the specific costs and other assumptions selected, several studies (e.g., Labi et al. 2014; Salomon and Moen 2014; Darwin et al. 2020; Cadenazzi et al.2020, 2021; Shen et al. 2021; and Gombeda et al. 2022, 2023) have shown that when various types of CRRB are considered from an LCCA perspective, most provide a more economical option relative to black bars. For example, Table 2-5 shows representative data from three of these studies, which used the three different metrics represented in the columns of Table 2-5. These costs included initial and maintenance costs, which are further documented in the cited references. Although the specific metrics and assumptions differ, similar relative rankings in terms of life-cycle cost result. Black bars are the most expensive option in all scenarios considered. Shen et al. (2021) reached this same conclusion for all considered scenarios with service lives exceeding 28 years, as did Labi et al. (2014) in two case studies (consisting of a large bridge with high traffic volume and a small bridge with low traffic volume) implementing their LCCA methodology.
Conversely, galvanized bars are consistently among the least expensive options when reviewing the data in Table 2-5. The life-cycle costs for epoxy-coated and chromium-alloyed bars were similar to those of galvanized bars for the studies represented in Table 2-5; chromium-alloyed bars were the least expensive option in Shen et al.’s study. Only one study (Gombeda et al. 2023) considered stainless steel clad bars, which were the most cost-effective option considered for a 100-year design life
Table 2-5. Example LCCA results ($/yd2).
| Bar Type | Reinforcement Cost 75-Year Life1 | Reinforcement Cost 100-Year Life1 | Deck Cost 100-Year Life2 |
|---|---|---|---|
| Black Bar | $4.00 | $6.00 | $758 – 1,093 |
| Epoxy-Coated | $2.15 | $3.21 | $512 |
| Textured Epoxy-Coated | $2.32 | $3.37 | --3 |
| Galvanized, Hot-Dip | $2.21 | $3.26 | $473 |
| Galvanized, Continuous | $2.14 | $3.18 | $461 |
| Stainless Steel Clad | $2.60 | $2.60 | --3 |
| Stainless Steel | $3.97 | $3.97 | --3 |
| Chromium-alloyed | $2.36 | $3.46 | $544 |
1 Simplified life-cycle cost for reinforcement from Gombeda et al. 2022, 2023.
2 Life-cycle cost of decks from Darwin et al. 2020.
3 Not a bar type considered by Darwin et al. 2020, but deck cost could be calculated based on reported reinforcement cost.
and had a unit cost 20% lower than the next best option. Only one of these studies (Gombeda et al. 2022) considered stainless steel (solid) bars, which were the most expensive CRRB option considered in these scenarios. However, Gombeda et al. (2022) noted that the use of stainless steel can be a justifiable option for structures with heavy deicing agent use and for those with longer service lives.
Similar LCCA, as well as life-cycle assessment, which is focused on environmental impact metrics (see EN 2020), were performed for a case study of a short-span bridge in a marine environment in Florida (Cadenazzi et al. 2020). The uses of black, epoxy-coated, stainless, and FRP bars were compared to conclude that epoxy-coated reinforcing bars were not a cost-effective solution in this aggressive environment. In contrast, FRP reinforcing bars were determined to be the most cost-effective solution. However, stainless steel-reinforced concrete could be considered as a viable option if the material costs fluctuate. The break-even point between stainless steel and FRP was determined to be an 18% variation in the cost of both materials (stainless steel cost decreased by 18% while FRP increased by 18%).
Salomon and Moen (2014) conducted an LCCA for black, epoxy-coated, chromium-alloyed, and stainless (316L) steel. The results showed that despite CRRB alternatives having up to 70% greater initial cost compared to that of black reinforcing bars, stainless steel or chromium-alloyed steel resulted in the minimal cost over a 100-year life span depending on whether 0% (chromium-alloyed bars) or 2% (stainless steel bars) inflation was assumed.
Alternatively, Clemeña (2002) proposed a straightforward method of considering cost as simply the bar cost divided by the expected number of years before corrosion begins. This approach avoids the need to make the assumptions regarding future costs and economics that are required for LCCA. In their cost comparisons using this simpler metric, black, epoxy-coated, and stainless steel bars had similar costs based on conservative assumptions of stainless steel durability. However, the cost of stainless steel clad bars was no more than half the costs of the other bar types. Clemeña further states that “[t]here is no doubt that a complete [LCCA] . . . would make [stainless steel] clad bars even more favorable.”
Another aspect of minimizing life-cycle cost can be inferred from Salomon and Moen (2017)’s documentation of a bridge replacement project in Bland County, Virginia, which used high-strength chromium-alloyed reinforcing bars to achieve 23% weight savings in the reinforcement. This weight savings can offset the cost premium of this bar type.
The general conclusion that CRRBs are cost-effective from an LCCA perspective is somewhat contradicted by Williamson et al. (2007) in their LCCA for bridge decks using black, galvanized, stainless, and chromium-alloyed reinforcing bars. Although the time to cracking of decks with black steel was estimated to be six years, the corresponding service life prediction was 160 years. Therefore, since it was concluded that this (atypical) predicted service life exceeded a 100-year design life (as did all CRRB options that were considered), the lowest initial cost option of black bars was stated to be the optimal choice for most situations.
Discussion
Because LCCA are necessarily dependent on many assumptions, several studies (e.g., Labi et al. 2014, Hasan et al. 2020, Shen et al. 2021, Cadenazzi et al. 2020, and Gombeda et al. 2022) have evaluated the sensitivity of the results to various parameters. Key factors that affect the conclusions reported were material prices (Cadenazzi et al.), assumed service life of both the structure (Gombeda et al.; Shen et al.) and the reinforcing bars (i.e., Williamson et al. 2007 compared to the other studies summarized here), and the discount or inflation rate assumed.
Additionally, Hasan et al. (2020) conducted a probabilistic LCCA to determine the locations of bridges exposed to airborne chlorides that could be suitable for stainless steel rebar in reinforced concrete girder bridges. The study evaluated sensitivity to four parameters: discount rate, corrosion
rate of stainless steel rebar, concrete cover, and water–cement ratio. It was concluded that the discount rate and water–cement ratio have a significant effect on the LCCA performed in this work. Cadenazzi et al. (2020) clarify that the discount rate significantly affects the net present value of reinforcing bar types that are expected to require deck replacements during their service lives but has a minimal effect on FRP and stainless steel designs given the low maintenance costs of these CRRB types. Consequently, the choice of discount rate dictates the conclusion for which of the reinforcing bar options had the minimum cost (Cadenazzi et al. 2020). Additional information on discount rates can be found in the Office of Management and Budget Circular No. A-94 (OMB 2023).
Labi et al. (2014) and Shen et al. (2021) have considered owner costs and user costs, both separately and cumulatively. Shen et al. found that user costs are significantly higher than owner costs for bar types that have relatively short service lives due to the indirect costs of bridges being out of service during repairs. From this, it follows that more corrosion-resistant options will be advantageous from a life-cycle cost perspective in high traffic areas. Labi et al. found that for a small and low traffic volume bridge, the owner costs greatly exceed the user costs, while the opposite is true for a large and high traffic volume bridge. They further consider the concept of weighting user and owner costs. Similarly, Gombeda et al. (2022) highlight that critical parameters such as a bridge’s location, AADT, and weather should be carefully considered and accounted for in the analyses.
Service Life Design Considerations for CRRB
Bridges designed according to the AASHTO LRFD BDS are typically assumed to provide an estimated 75-year design life. This design life is based on assumed transient load models (AASHTO 2020a) and is independent from durability considerations. Service life design is an evolving process intended to explicitly consider durability and to potentially create a more economical life-cycle solution.
The publication of the first edition of the AASHTO Guide Specification for Service Life Design of Highway Bridges (SLD Guide Specification) (AASHTO 2020b) presents a comprehensive framework for service life design. The SLD Guide Specification was influenced by fib Bulletin 34 (fib 2006), ISO Standard 16204 (ISO 2012b), SHRP 2 Report S2-R19A-RW-1: Bridges for Service Life Beyond 100 Years: Innovative Systems, Subsystems, and Components (Azizinamini et al. 2014), SHRP2 Report S2-R19B-RW-1: Bridges for Service Life Beyond 100 Years: Service Limit State Design (Kulicki et al. 2015), peer exchanges (e.g., Iowa Peer Exchange, 2018), and the FHWA Long-term Bridge Performance Program. It describes goals for three service life categories—normal, enhanced, and maximum—and corresponding recommendations to meet these goals. It should be noted that at the present time, there is insufficient information to reliably target a specific number of years, but values such as 100 years or more are often assumed.
For reinforcing bars, four general categories are identified in Section 4.2.4.1d of the SLD Guide Specification, with Class A being representative of black bars, Class D being representative of stainless steel, and Classes B and C representing loosely defined intermediate options. The corresponding commentary encourages owner discretion in the exact assignment of specific CRRBs to Classes B and C, based on factors such as prior experience in situations specific to their DOT. Table 4.2.4.2.2-1 of the SLD Guide Specification then recommends combinations of reinforcement class, concrete type, and cover distance as functions of service life category for various types of environmental exposures.
The SLD Guide Specifications are derived from NCHRP Web-Only Document 269: Guide Specification for Service Life Design of Highway Bridges, which is aimed at developing such guidelines and contains an extensive literature review on the topic of service life design, material and component design specifications, and applications of probabilistically calibrated limit states
(Murphy et al. 2020). In 2022, FHWA produced a Service Life Design Reference Guide (FHWA-HIF-22-052) as a “road map” of concrete and steel bridge service life design concepts and methods for designers and owners. This document provides example problems using the SLD Guide Specification methodology.
Many state agencies have supported research projects and created their own documents to provide service life design guidelines to their constituents. For example, the Minnesota DOT (MnDOT) has created a state-specific service life design guide for bridges that considers the environments and experiences in their state (MnDOT 2023). In that guide, the use of different reinforcing bar types (black, epoxy-coated black, epoxy-coated 4% chromium-alloyed, stainless steel, glass FRP, and galvanized) and their suitability for different service life categories are described for different member types. With respect to member types, the guide provides specific recommendations for the design of bridge decks, wearing courses, metal railings, substructures, expansion devices, bearings, foundations, and retaining walls, as well as aesthetics, to ensure that the desired service life is achieved.
The Colorado DOT (CDOT) is another example of a state agency that has developed statewide strategies based on three tiers for enhancing bridge service life (CDOT 2020). The strategies cover concrete materials, reinforcing steel, CRRB, structural steel, and design detailing (to name a few) and provide guidelines on when to utilize enhanced strategies.
Bales et al. (2018) evaluated the adoption of the fib Bulletin 34 methodology (2006) to the design of reinforced concrete bridge decks in Virginia using state-specific environmental data compiled for this purpose. They concluded that sufficient data were available to implement this methodology, which resulted in a predicted service lives exceeding 100 years when chromium-alloyed steel (the only CRRB option considered), low-cracking concrete, and appropriate cover depths were assumed.


