Learning from Our Buildings: A State-of-the-Practice Summary of Post-Occupancy Evaluation (2001)
Chapter: Appendix B A Balanced Scorecard Approach to Post-Occupancy Evaluation: Using the Tools of Business to Evaluate Facilities
Appendix B
A Balanced Scorecard Approach to Post-Occupancy Evaluation: Using the Tools of Business to Evaluate Facilities
Judith H. Heerwagen, Ph.D., J.H. Heerwagen and Associates
In the past decade, organizations have begun to look at their buildings not just as a way to house people but also as a way to fulfill strategic objectives (Becker and Steele, 1995; Horgen et al, 1999; Ouye and Bellas, 1999; Grantham, 2000). In part this is due to re-engineering and downsizing of the past two decades. Also, however, chief executive officers (CEOs) are beginning to think of their buildings as ways to achieve strategic goals such as customer integration, decreased time to market, increased innovation, attraction and retention of high-quality workers, and enhanced productivity of work groups.
Traditional post-occupancy evaluation (POE) methods do not provide the type of feedback needed to assess these organizational outcomes. POEs focus on individual-level assessment, most typically on satisfaction, use patterns, and comfort, rather than on organizational- or group-level outcomes associated with core business goals and objectives. Because organizations are increasingly asked to justify all of their major expenses, including facilities, evaluation methods that begin to address these higher-level issues would be of great value. At the present time, there are very few data to show linkages between facility design and business goals.
As a result, decisions are often made on the basis of reducing costs. Current cost-focused strategies include reducing the size of work stations, moving to a universal plan with only a few work station options, eliminating private offices or personally assigned spaces, and telecommuting. Evaluation methods that identify and measure the business value of facilities would be a highly valuable way to expand the current knowledge base and to provide a wider array of outcomes against which to measure facility effectiveness.
Ouye (1998; Ouye and Bellas, 1999) suggests that workspace design and evaluation can become more strategic by adopting the tools of business, specifically the Balanced Scorecard (BSC) approach proposed by Kaplan and Norton (1996). As applied to facilities, the BSC approach pioneered by Ouye and the Workplace Productivity Consortium is valuable not only for evaluation purposes, but also for design because it forces designers to think systematically about the relationship between the workplace and organizational effectiveness. Although the Balanced Scorecard was developed primarily with the private sector in mind, the approach is also applicable to the evaluation of government facilities. A core theme for both the private sector and the government is to provide facilities that are both efficient and effective. As noted in the General Services Administration’s (GSA’s) The Integrated Workplace (GSA, 1999, p.5):
By using the Integrated Workplace as part of your strategic development plan, matching business goals to workplace designs, you can consolidate and reconfigure the spaces where you work while providing people with the tools they need to support the organization’s mission.
Even more important for federal facilities is the strong link between the BSC approach and the requirements for strategic planning and performance assessment initiated by the Government Performance and Results Act of 1993 (GPRA). GPRA was enacted as part of the Clinton administration’s “Reinventing Government” initiative to increase the efficiency of federal agencies and to make them more accountable for achieving program results. GPRA requires federal
departments and agencies to develop methods for measuring their performance against strategic goals and program objectives, an approach that is very consistent with the Balanced Scorecard. Because the BSC focuses on evaluation as a means to enhance overall strategic performance, the results from the BSC approach would provide valuable input to the GPRA performance review for federal facilities. At the present time, measures of facility “success” include costs per square foot of space and square foot per occupant. Such measures do not address the strategic issues of concern to GPRA and the Balanced Scorecard.
The Balanced Scorecard assesses four categories of performance: financial, business process, customer relations, and human resource development (Kaplan and Norton call this dimension “learning and growth”). The term “balanced” refers to several factors. First, there is a balance across the four categories to avoid overemphasis on financial outcomes. Second, the evaluation includes both quantitative and qualitative measures to capture the full value of the design project. And third, there is a balance in the levels of analysis– from individual and group outcomes to higher-level organizational outcomes. Figure B-1 shows some possible measures to use in each category. All of these measures have logical links to the workplace environment, and in some cases there is empirical support also.
This appendix draws on the framework developed by Ouye (1998; Ouye and Bellas, 1999) but expands it to include greater discussion of the links between physical space and business outcomes. The approach and process described in this chapter also focus on dif-
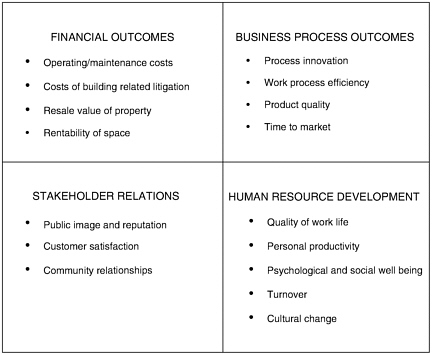
FIGURE B-1 Building evaluation measures using the BSC approach.
ferent categories of outcomes. Whereas Ouye’s “workplace performance” process focuses on strategic performance, group performance, and workplace effectiveness, this appendix links evaluation more directly to the four dimensions of the Balanced Scorecard.
ADVANTAGES OF USING THE BALANCED SCORECARD APPROACH
At the present time, POEs focus on the human resource dimension of the BSC and primarily on quality of work life (which includes environmental satisfaction, comfort, functional effectiveness of space, access to resources, etc.) This is an important component, but only one indicator of the success of the facility. In fact, it is possible for a facility to rate very high on these characteristics, but to have a negative impact on the other areas if the building costs considerably more to operate and maintain or if the design interferes with key work processes in some way. This may happen if a design emphasizes visual openness to enhance communication at the expense of ability to concentrate (Brill and Weidemann, 1999).
The BSC approach, in contrast, begins by asking these kinds of questions:
-
How can workplace design positively influence outcomes that organizations value?
-
How can it reduce costs or increase income?
-
How can it enhance human resource development?
-
How can the workplace enhance work processes and reduce time to market?
-
How can the work environment enhance customer relationships and present a more positive face to the public?
By asking these questions at the beginning of the design project, the BSC approach provides an analytical structure to the entire process, from conceptualization through evaluation and finally to “lessons learned.” For an organization or design firm, these lessons learned become the knowledge base for future design efforts.
One of the trade-offs inherent in using the BSC approach, however, is the difficulty of generalizing to different contexts. Because the evaluation methodology is so closely linked to a unit’s own mission and objectives, it is difficult to generalize findings to other spaces and units. To deal with this difficulty, a core set of measures could be used across facilities to gain a better understanding of the entire building stock, while other measures would be unique to the goals and objectives of the particular organization, department, or division (Ouye, 1998).
APPLYING THE BSC APPROACH
In applying the BSC approach, the following general steps need to be taken:
-
Identify overall organization mission and specific objectives for each of the four BSC dimensions.
-
Identify how the facility design is expected to help meet each objective.
-
Select specific measures for each of the organizational objectives based on links to the workplace design. Set performance goals for each measure.
-
Conduct evaluation “pre” and “post.”
-
Interpret findings in light of the mission and objectives.
-
Identify key lessons learned.
An example will help illustrate this process.
1. Identify Mission and Objectives
Mission: Become a showcase government office of the future.
Specific objectives for each BSC dimension:
-
Financial—reduce the costs of modifying facilities.
-
Business process—reduce time for delivery of products; create more collaborative working relationships within and between units
-
Stakeholder relationships—upgrade the image of government workspace, increase customer satisfaction.
-
Human resources—improve overall quality of work life; reduce turnover and absenteeism.
2. Identify Potential Links to the Physical Environment
This step of the evaluation process is the most neglected in facility evaluation. It requires conscious articulation of design hypotheses and assumptions about expected links between the specific objectives and the features of the environment. By making these potential links more explicit, it will be easier to inter-
pret results and to assess differences between spaces that vary on key physical features and attributes. Furthermore, by testing specific design hypotheses, the BSC approach can be used to test and develop theory. In contrast, most POE research is theoretically weak and does not contribute to either hypothesis testing or theory development.
This step requires research on what is known already as well as logical speculations. The hypothesized links form the basis for characterizing the baseline and new environments. It includes physical measures of the ambient environment (thermal, lighting, acoustics, and air quality) and characterization of other key features and attributes of the environment that are known or suspected to influence the outcomes of interest to the study. The specific features and attributes used in the characterization profiles are related to the objectives and measures. For instance, if one of the objectives is to reduce absenteeism, then features of the environment known to influence illness need to be catalogued pre and post. These include materials selection for carpeting and furnishings; ventilation rates; ventilation distribution; thermal conditions; cleaning procedures; and heating, ventilation, and air conditioning (HVAC) maintenance (Fisk and Rosenfeld, 1997; Heerwagen, 2000). The profiles will enable the evaluation team to understand better what works and what does not and why. They can also be incorporated into a database that can be integrated across facilities.
For example, one of the measures cited above for improved work process is increased collaboration both within and between units, especially support for spontaneous interactions and meetings. A quick review of research literature provides the basis for developing the potential links to the environment. Specific questions to address in the literature review include: How do people use the environment for social interactions? What aspects of the environment encourage different kinds of interactions? How do groups work, and what resources do they typically use? How important are spontaneous meetings compared to planned meetings, and how do they differ from one another?
Recent research on informal communications and interactions in work settings shows specific features and attributes of informal spaces that are likely to influence the extent to which the spaces are used and their degree of usefulness to work groups. These features include comfortable seating to encourage lingering, location in areas adjacent to private workspaces to encourage casual teaming, white boards for discussions, presence of food nearby, some degree of separation from main traffic routes, acoustical separation for nearby workers who are not participating, ability of team members to personalize the space, and ability to maintain information displays, group artifacts, and work in progress until these items are no longer needed (Allen, 1977; Sims et al., 1998; Brager et al., 2000). Once these potential features are identified, the baseline and new environments can be assessed to identify the extent to which these features are present.
A similar process would be carried out for each of the objectives. For many of the objectives, there is likely to be little research available. Nonetheless, the assumptions, hypotheses, and predictions should still be articulated and linkages to the environment should be logically consistent. As another example, reduced time to market could be influenced by factors such as co-location of people working on the task, easy access to electronic groupware tools to coordinate work, sufficient group space for spontaneous meetings, vertical surfaces for continual visual display of work in progress and schedules, and central storage for materials associated with the task while it is ongoing.
3. Identify Specific Measures for Each Objective
Many different kinds of measures are likely to be used in the evaluation process. Nonetheless, each potential measure should be assessed against general criteria to help decide whether or not it should be included in the evaluation process. These criteria follow:
-
Usefulness—the measure addresses the mission, goals, and objectives of the business unit and can be used in strategic planning.
-
Reliability—the measure produces consistent results when applied again.
-
Validity—the measure is a good indicator of the outcome of interest (it measures what it purports to measure).
-
Efficiency—the overall measurement plan uses the minimal set of measures needed to do the job and enables conclusions to be drawn from the entire data set.
-
Discrimination—the measures will allow small changes to be noticed.
-
Balance—the entire set of measures will include both quantitative and qualitative measures and direct and indirect measures. Quantitative data can be translated into numbers and used for
-
statistical analyses. Qualitative data, on the other hand, often include interviews and results from focus groups that are more difficult to translate into numeric scales. Nonetheless, such data provide a rich understanding of the context and processes that make it easier to interpret quantitative results. Further, qualitative approaches are often used as a means to develop items for surveys and structured interviews or other data-gathering mechanisms. The second aspect of a balanced family of measures is direct versus indirect measures of performance. Direct measures include outputs such as sales volume. Indirect measures are often correlated with performance or are the building blocks of performance rather than actual performance output. Examples are frequency of use, occupant satisfaction, or absenteeism.
Setting Performance Goals. The organization needs to decide prior to the evaluation what degree of improvement it is working toward for each of the identified measures. Does even the slightest increase in the expected outcomes matter? Alternatively, should you aim for a 10 percent improvement, a 25 percent improvement? Setting performance guidelines will help in data interpretation and conclusions. Scientific research uses statistical significance as proof of success. However, statistical analyses may not be as useful in an applied context. The degree and direction of change over time may be more relevant to organizational performance. Very few performance evaluation processes, including the Balanced Scorecard, use statistical analyses to judge whether organizational changes are “working.” Instead, managers look at the overall profile of outcomes and make a decision about new policies or procedures based on how well the data match improvement goals (Kaplan and Norton, 1996).
The following examples identify some potential measures for each of the stated objectives in our hypothetical example.
Costs of Modifying Facilities. This would involve identification and calculation of all costs involved in relocating workers or reconfiguring office space, including costs associated with packing or unpacking, time and costs of facilities staff needed to reconfigure work stations, time associated with planning the move and reporting, costs for any special equipment or services, and lost work time. The data would include total costs of staff time (number of hours × hourly pay rate), total costs of special equipment or services, and the amount of time overall to carry out the change from the initial request to completion. In order to demonstrate reduced costs (the objective), pre and post comparisons would focus on the total number of people involved in a move and the costs of their time; the overall time needed to carry out the change; and the total dollar costs of the move.
Delivery Time for Products. This would require tracking the time to actually produce a product such as a report, starting with the initial assignment and ending with the date of final delivery. To identify where in the overall process the efficiencies occurred, subtasks would also be timed. Data would include a written commentary on work process, number of people involved in the task and their responsibilities, and reasons for any unusual delays or work stoppages. The best tasks for such an analysis are reports or other products that are done on a repetitive basis and therefore are likely to be very similar from year to year. If different types of products are selected pre and post, then any differences in delivery times could be due to factors such as task complexity rather than to increased efficiencies resulting from changes in physical space.
Facility Image. Data on image would include subjective assessments through brief surveys completed by visitors, customers, job applicants, and staff. Specific questions would depend upon the nature of the facility and the type of work. Pre-post analysis would look for changes in perceptions.
Customer Satisfaction. Data on customer satisfaction could include surveys, analysis of unsolicited customer messages (complaints, concerns, praise), customer retention, and number of new customers. Objective data could include the time needed to complete transactions with different customers or stakeholders or the number of requests for information processed per day.
Inter- and Intra-unit Collaboration. Communications and collaboration activities are notoriously difficult to document accurately unless logs are kept of all meetings, formal and informal. Furthermore, the value of collaboration is reflected not only in the frequency of the meetings, but also in the outcomes of the interactions (e.g., new ideas, problems solved more quickly). To get as accurate a picture as possible of changes in meeting characteristics, multiple methods should be
used. First, motion sensors can be used to gather data on frequency of use for particular spaces. The sensors would have to contain counters or other data-processing technology (e.g., a sensor that would measure how long the lights were on) that would ignore short-duration changes (e.g., someone walking into the room briefly and then leaving). The occupancy data would have to be supplemented either with behavioral observations or surveys and interviews that gathered information on number and character of meetings attended within the past week (or some other limited time period to enhance the potential for accurate recall). The survey-interview process would also gather data on the attendees, the nature of the meeting (spontaneous versus planned; focused on a specific problem, brainstorming, task integration, information exchange, and so forth), and the perceived value of the meeting (specific outcomes, usefulness, etc.).
Data analysis would compare the number of meetings, the participants (number from within the unit, number from other units), the purpose, the outcome, and the perceived value. If the facility had an impact on collaboration, one would expect to find a wider range of participants, more meetings for problem-solving and brainstorming versus simple information exchange, more spontaneous meetings, and a higher perceived value.
Quality of Work Life. POEs traditionally focus on quality-of-work-life issues such as comfort, environmental satisfaction, work experiences and perceptions, sense of place, and sense of belonging. Many design firms and research organizations have examples of surveys that are used in a pre-post analysis.
Turnover. There is a great interest in retaining workers due to the high costs of turnover, in terms of both the financial costs associated with hiring someone new and the knowledge costs that result from losing valuable skills and knowledge when a worker leaves. Turnover is usually calculated as a rate of workers who voluntarily leave an organization divided by the total number of workers for the same time period. Turnover does not include retirements, dismissals, deaths, or loss of staff due to disabling illness. Some degree of staff turnover is important because it introduces new ideas and new skills into an organization. Thus, for evaluation purposes, the organization needs to decide what degree of turnover is desirable. Pre-post comparisons of turnover rates should then be assessed against what is considered a desirable level.
4. Conduct Evaluation Pre and Post
Key issues in conducting the pre-post process include gaining cooperation from managers and staff who will be the study subjects, timing of the evaluation, and use of control or comparison groups.
Gaining Cooperation. The evaluation process will fail if the occupants are reluctant to participate or if there are insufficient staff to help with the organizational data gathering for some of the measures (such as turnover rates). Occupants are much more likely to continue to be engaged in the process if they are involved in helping design the measurement plan and if they see a benefit from participation. Having support from high-level organizational leaders is also critical because it signals the importance of the project. The facility occupants also need to be informed of how the data will be used and they need to be assured that their own input will be kept confidential.
Control Groups. Because so many other factors can influence the outcomes being studied, it is difficult to know whether performance changes are due to the workplace itself or to other factors that may change simultaneously. This is especially true when the design is part of an organizational change effort, which is often the case. Confounding factors may be internal to the organization (changes in policies or markets), or they may be external to the organization but nonetheless can affect business performance (such as economic conditions). The best way to avoid problems of interpreting the success of a design is to use control groups along with pre-post studies. An appropriate control group would be a business unit in the same building that does a similar kind of work but is not going through a workplace change. The control group should be as similar to the design change group as possible.
The control group is studied at the same time as the group experiencing the design changes, with both groups studied during the pre and post design phases. Although the control group would not experience the design change, it would get the same surveys or other measures at the same time. If the design has an impact independent of organizational issues, then the pre-post responses for those in the design change condition
should show greater differences across time than for those in the control group.
Timing of Measurement. The pre-measurement should be done at least two to four months prior to the move into a new facility in order to avoid issues and problems associated with the move itself. Ideally, the existing facility should be evaluated before work begins on the new facility, although this is very seldom done due to the need to assemble a research team and develop a measurement plan. The post-measures should be done six to nine months after project completion to enable workers to adapt to the new setting. The delay will help to diminish the “settling-in” phase when problems may be most obvious and the workplace needs to be fine-tuned. It will also reduce the impact of a “halo” effect associated with being in a new or renovated space.
5. Interpreting Results
When data analysis is complete, the project reconsiders the design hypotheses and asks: Do the data support the hypotheses? Do the results meet the performance goals?
There are very few scientific research studies that show complete support for all hypotheses and predictions. Thus, we would not expect to find perfect alignment in design evaluation. Where misalignments occur, it is important to try to understand why this happened.
The design and evaluation teams will have a natural tendency to focus on the positive and ignore the results that do not turn out the way they expected. However, it is often more valuable to understand why things went wrong for several reasons. First, you do not want to repeat the mistakes. Second, negative results often force a rethinking of basic assumptions and a search for better links between the environment and the behavioral outcomes.
A problem with all facility evaluations, regardless of specific methodologies, is the issue of causation. If a new facility is found to have positive outcomes, can these be attributed unequivocally to the physical environment and not to other factors? The answer is clearly no. Causation can be determined only by carefully designed experiments that vary only one component at a time. Since this is unrealistic in field settings, the causation issue will always be present. The best that can be done is to minimize other explanations to the degree possible through the use of control and comparison groups. It will also be important to use a high degree of logic in interpreting results, to look for consistency across facilities that share similar features, and to look at relationships between measures.
For instance, if absenteeism is of interest, then absenteeism rates should be associated with other outcomes, such as symptom expression or low levels of motivation, both of which could lead to taking days off due to illness or lack of desire to come to work. Assessing patterns of absenteeism will further aid in interpretation of results. Absence associated with motivational issues is likely to have a different pattern of days off than absenteeism due to illness. Because illnesses happen randomly and often last for more than one day, absenteeism due to illness should be clustered and randomly distributed over the days of the week. Motivational absenteeism, on the other hand, is more likely to occur on particular days of the week (especially Monday or Friday) and would be more likely to occur just one day at a time, not for several days. Another way to assess absenteeism is to look at its opposite— attendance. Attendance can be assessed by determining the percentage of workers with perfect attendance or the percentage who used less than the allowed number of sick days in the year prior to and the year after the move to the new facility. In addition to looking at relationships between measured outcomes, there should also be a logical connection to the physical environment profiles. Absenteeism and illness symptoms should be associated with factors such as poor indoor air quality and low maintenance of HVAC systems.
Another problem for interpreting the results on facility evaluation is that redesign often goes hand in hand with organizational change. Thus, positive (or negative) results could be due to organizational issues and not to the physical environment. This is where control groups become very valuable. If the organizational change is widespread, then similar units should also experience the effects of these changes. Thus, differences between the control group and the group in the new space are more likely to be related to the environment. Again, the use of logical thinking is also important. When organizational change occurs, some aspects of behavior are more likely to be influenced than others. For instance, if staff perceive the change very negatively, then motivationally influenced absenteeism may go up in both the new and the control spaces. Other outcomes, such as the costs of “churn,” are less likely to be affected by organizational change policies.
Greater assurance of a true connection between the
physical features of the space and the measured outcomes can be gained also by using a geographical information system (GIS) approach to data analysis. Outcomes on various subjective measures can be plotted on floor plans to gain a greater understanding of the spatial distribution of responses. For instance, a GIS format used by the author to assess environmental satisfaction and comfort in an office building in California clearly showed that problems associated with distractions occurred primarily in particular locations, regardless of whether people were in private offices or cubicles. Similarly, thermal and air quality discomfort tended to cluster more in some areas than others. At the present time, most post-occupancy data analysis uses human characteristics as the primary unit of differentiation (e.g., different job categories, gender, age), with comparisons in responses across job categories or age. By supplementing the demographic data with geographical analysis, the evaluation will provide a more complete picture of the facility. A similar process, called spatial modeling, has been suggested by Aronoff and Kaplan (1995). Both the GIS and the spatial modeling approaches allow for analysis of the variability and distribution of responses in a spatial format.
7. Identifying Lessons Learned
An issue with lessons learned is: Where should the knowledge reside—in people’s heads or in the environment? Should the lessons be internalized and become part of one’s tacit operating knowledge, or should the lessons be located for anyone to access—in reports, databases, and so forth? Both should happen. If people are going to work with the knowledge gained, they need to incorporate it into their everyday ways of thinking and working. Internalization takes time and continued work with the knowledge and issues (Norman, 1993; Stewart, 1999). Once internalized, knowledge is part of a person’s intellectual capital and leaves the organization when the person does. This is why knowledge also needs to be made explicit so it can become an organizational asset, not just a personal asset (Stewart, 1999). Seminars and presentations on the results of facility evaluations—with both positive and negative results highlighted—should be an ongoing practice.
Since a major purpose of evaluation is to apply the knowledge gained to future projects, simple databases that could be accessed by key words would be especially valuable to future designs. The database should include the design hypotheses and assumptions for each project, the specific measures used to test the hypothesis, pre and post photos of the space, brief summaries of the data, key lessons learned, connections to other studies, connections to the full research findings pre and post, and recommendations for future designs. The presentation of lessons learned should be as visual as possible to allow for maximum understanding and retention (Norman, 1993). Graphs, photos, and key words and concepts are much more likely to be useful than long verbal explanations that can be accessed if desired through links to full reports.
In addition, simple methods to display overall results would aid interpretation and lessons learned. For instance, results could be visualized using color-coded icons to provide an easy visual interpretation: green could be used to show strong support for the hypothesis and meeting or exceeding performance goals; yellow could be used to show minimal support or no change; and red could be used for measures that did not support the hypotheses or showed negative change.
SUMMARY AND CONCLUSIONS
This appendix has described an approach to post-occupancy evaluation that is more closely linked to business and workplace strategies than existing methodologies. Although the Balanced Scorecard approach does not present any new measurement techniques or breakthrough methodologies, it does provide a process for more effectively linking facilities to an organization’s overall mission and goals. An advantage to using the BSC approach for federal facilities is its close relationship to the comprehensive performance assessment required by GPRA. Traditional POEs provide an important source of input, but measures tend to be focused on a limited range of topics and on the occupants’ perspective, rather than on the broader, strategic focus of the BSC.
For large real estate portfolios, such as those in federal departments, the determinant of facility success is not only how well the overall building stock performs with respect to core POE measures used across facilities, but also how well each design fits its particular context and how well it meets the business objectives of the unit. The Balanced Scorecard was developed specifically for the purpose of providing data to assess overall performance and to identify areas that need attention.
ABOUT THE AUTHOR
Judith H. Heerwagen is an environmental psychologist whose research and writing have focused on the human factors of sustainable design and workplace ecology. Dr. Heerwagen currently has her own consulting and research practice in Seattle. Prior to starting her own business, Dr. Heerwagen was a principal with Space, LLC, a strategic planning and design firm, and a senior scientist at the Pacific Northwest National Laboratory. At Space Dr. Heerwagen was codirector of research and helped develop metrics for the Workplace Performance Diagnostic Tool. At the Pacific Northwest National Laboratory she was responsible for developing research methodologies to assess the human and organizational impacts of building design. Dr. Heerwagen has been an invited participant at a number of national meetings focused on workplace productivity. She was on the research faculty at the University of Washington in the College of Architecture and Urban Planning and at the College of Nursing. Dr. Heerwagen is a member of the American Psychological Association. She holds a bachelor of science in communications from the University of Illinois, Champaign-Urbana, and a Ph.D. in psychology from the University of Washington.
REFERENCES
Allen, T. (1977). Managing the Flow of Technology. Cambridge, Mass.: MIT Press.
Aronoff, S., and Kaplan, A. (1995). Total Workplace Performance: Rethinking the Office Environment. Ottawa: WDL Publications.
Becker, F., and Steele, F. (1995). Workplace by Design: Mapping the High Performance Workscape. San Francisco, Calif.: Jossey-Bass.
Brager, G., Heerwagen, J., Bauman, F., Huizenga, C., Powell, K., Ruland, A. and Ring, E. (2000). Team Spaces and Collaboration: Links to the Environment. Berkeley: University of California, Center for the Built Environment.
Brill, M., and Weidemann, S. (1999). Workshop presented at the Alt.Office99 Conference, San Francisco, Calif. December.
Fisk, W., and Rosenfeld, A.H. (1997). Estimates of improved productivity and health from better indoor environments. Indoor Air 7:158-172.
General Services Administration. (1999). The Integrated Workplace: A Comprehensive Approach to Developing Workspace. Washington, D.C.: Office of Governmentwide Policy and Office of Real Property.
Grantham, C. (2000). The Future of Work: The Promise of the New Digital Work Society. New York: McGraw-Hill, Commerce Net Press.
Heerwagen, J. (2000). Green buildings, organizational success and occupant productivity. Building Research and Information 28(5/6):353-367.
Horgen, T.H., Joroff, M.L., Porter, W.L., and Schon, D.A. (1999). Excellence by Design: Transforming Workplace and Work Practice. New York: Wiley.
Kaplan, R.S., and Norton, D.P. (1996). The Balanced Scorecard. Boston: Harvard Business School Press.
Norman, D. (1993). Things That Make Us Smart: Defending Human Attributes in the Age of the Machine. Reading, Mass.: Addison-Wesley.
Ouye, J.O. (1998). Measuring workplace performance: Or, yes, Virginia, you can measure workplace performance. Paper presented at the AIA Conference on Highly Effective Facilities, Cincinnati, Ohio, March 12-14.
Ouye, J.O., and Bellas, J. (1999). The Competitive Workplace. Tokyo: Kokuyo (fully translated in English and Japanese).
Sims, W.R., Joroff, M., and Becker, F. (1998). Teamspace Strategies: Creating and Managing Environments to Support High Performance Teamwork. Atlanta: IDRC Foundation.
Stewart, T.A. (1999). Intellectual Capital. New York: Doubleday.