Measurement and Analysis of Public Opinion: An Analytic Framework (2022)
Chapter: 3D Integrating Data Across Sources - Josh Pasek and Sunghee Lee
3D
Integrating Data Across Sources
LEARNING OBJECTIVES
This chapter will help analysts to
- Understand how integrating datasets can improve the conclusions of analyses, making them more precise and more robust;
- Recognize when different datasets may measure what analysts want to study in similar versus different ways and how data collection methods can contribute to those differences;
- Learn how to prepare data sources for integration including addressing sources of variability that may emerge across datasets; and
- Identify a series of methods that can be used for analyzing integrated data toward different research goals.
SECTION 1: COMBINING DATASETS
There is no such thing as perfect data. Any attempt to use information to understand the state of the world or to make predictions about what will happen is inherently incomplete. Official databases may contain recordkeeping errors; survey responses come from a sample (not the population) and may generate inaccuracies, as in cases where respondents misreport or lack introspection; social media data often reflect unusual groups of people and their posts are often designed for an imagined audience, rather than to yield personal insights; and all forms of data are limited by the circumstances under which they are collected and the groups of people, places, or
things they represent. These challenges place inherent limitations on what we can infer from any given source and the confidence we can have about our inferences. At the same time, though, throwing our hands up in resignation is not only counterproductive; it also fails to recognize that these flawed sources of information constitute some of the best knowledge we have about our social and political world.
One of the principal approaches for understanding the values and constraints of various data streams (or data sources) and expanding the limits of our knowledge comes through data integration. Data integration is the process of taking multiple diverse streams of information and finding ways to reconcile their differences, use them jointly to make conclusions, and/or determine where they provide complementary or conflicting understandings. There are many related terms describing aspects of this process: data aggregation, data combining, data blending, data pooling, data triangulation, data linkage, data merging, and more. In this chapter, we use the term “data integration” to denote the larger set of procedures that encompasses all terms (hence, the bolded definition above). Integrating across different data sources can provide critical information about the quality of the data we have gathered, the confidence we should have in a particular conclusion, and the mechanisms through which some process is operating, and sometimes data integration is necessary to measure the very phenomena we wish to study.
Integrating data takes a variety of forms, as shown in Figure 3D-1, often depending on what types of data are available as well as key aspects
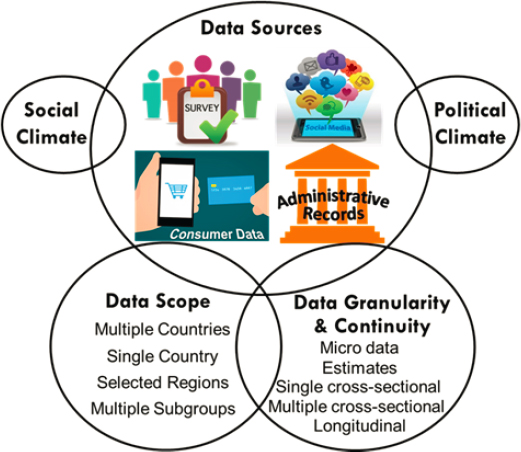
of the data. Differences in the source, scope, and granularity of data change the affordances of both individual datasets and data integrations for analysts. We discuss a series of key considerations in Section 2 related to understanding different types of data and how they relate to research objectives.
The benefits of successfully integrating data can be enormous for the intelligence community (IC) analyst. Evidence from connecting different kinds of data about the same phenomenon can allow analysts to examine whether their conclusions are robust to alternate forms of measurement (Section 3.5). When the results from a social media analysis echo those of a traditional sample survey, an analyst can have greater confidence that the findings were not a fluke arising from a single idiosyncratic dataset. Furthermore, datasets may be available spanning different time points. The integration of such datasets is often necessary to understand how things have changed in a particular location (Section 4.3). These sorts of data integrations may allow analysts to discern trends, which themselves might answer key questions such as whether and how protest events shape approval of political leaders. Integrations involving data streams collected from different communities or places are central to many comparative analyses, and they allow analysts to identify differences in attitudes and behaviors across locations that may flag emerging issues or the need for interventions (Section 4.2). Integrating multiple sources of data that contain information on particular individuals or organizations can also provide a clearer picture of key phenomena of interest (Section 4.1). Understanding how individual attributes relate to network characteristics can help explain why networks are structured the way they are and reveal important patterns, providing evidence, for instance, of how knowledge was shared among the 9/11 hijackers (Krebs, 2002). All these conclusions depend on connecting multiple sources of data.
When analysts integrate different data streams together, a variety of questions emerge about how the data should be understood, what factors need to be considered, and how we can use the full information from available data to reach the best possible conclusions. Answering these questions depends on the research goals as well as on the characteristics of the available data (for an example, see Schober et al., 2016). In general, attempts to integrate different sources of information begin with an assessment of the strengths and weaknesses of the individual datasets that are being used (see “Drawing Inferences from Public Opinion Surveys: Insights for Intelligence Reports” [“Drawing Inferences”] earlier in this Analytic Framework for examples). Determining what sources of error might exist within a given stream (Section 2.6) is critical for understanding the utility of the data as well as considering how those errors can be mitigated. At the same time, it is important to consider the requirements for a given project. Some intelligence projects need to achieve high levels of precision, must be accurate
on the individual level, or must thoroughly capture the distribution of attitudes or behaviors in society. Other goals are less sensitive to these sorts of considerations, but may need to carefully determine whether a proposed relationship is causal or mere coincidence. Whether a given method is “fit for purpose” (Baker et al., 2010) depends on how data quality, research questions, and inferential methods relate. Small errors in sample composition, for instance, can undermine conclusions about who is likely to win a close election but may be inconsequential when trying to understand how individuals in different groups are going to vote.
In the rest of this chapter, we outline some of the key considerations to think about when combining different data streams into a single analysis (Section 2), and discuss a number of technical procedures relevant to improving the quality of the data that are used (Section 3) and the inferences that are made from those data (Section 4).
SECTION 2: KEY CONSIDERATIONS FOR DATA INTEGRATION
Different types of data can be connected to one another and combined in a variety of ways as illustrated in Figure 3D-1. Decisions about what kinds of data to combine and to what ends raise a wide scope of possible considerations for data integration. In general, the factors that researchers need to think about or potentially worry about depend on what population(s) analysts hope to make conclusions about; the types of conclusions they aim to make; the reason they are conducting their analyses; the granularity of the available data; the similarities and differences between the methods of the different data streams that are being combined; and the temporal, social, political, and linguistic contexts across which data were collected. Accounting for these facets of the data allows analysts to see what kinds of insights each data stream can enable as well as recognize sources of variability in the answers that might be obtained. In turn, this helps highlight where the results of different streams may yield similar insights and where aspects of data collection methodology could induce differences. It also implies circumstances where various types of analytic approaches and data adjustment procedures may be warranted (discussed in Section 3).
Consider a case where an analyst is interested in comparing global opinions toward the United States from populations in several different countries. Multiple data collection methods might serve this goal, each with their own strengths and weaknesses (as illustrated in “Alternatives to Probability-Based Surveys Representative of the General Population for Measuring Attitudes” [“Alternatives to Probability-Based Surveys”] earlier in this Analytic Framework). One approach could rely on publicly available datasets such as those produced as part of the Pew Research Center’s Global Indicators, while another might involve designing and implementing a new
transnational survey, another alternate strategy could focus on extracting sentiment from social media posts about the United States, and yet another method might involve relying on country experts. Each of these strategies has a place in the analyst’s canon, though which approach is preferable will likely depend on a variety of factors and considerations (e.g., urgency, available financial resources, countries of interest, accessibility, and infrastructure in the target countries). Collecting novel survey data requires considerable lead time and large financial resources. Social media analytics may yield data much more quickly but may be distorted if large segments of a society lack sufficient internet access. Similar considerations exist across all types of data sources (see Table 3D-1). In all situations, how well the analyst is informed about the five components in Figure 3D-1 (data sources, data scope, data granularity and continuity, social climate, and political climate) in relation to the analytic goal is likely to determine the ability to meet this goal.
This section outlines a series of key considerations for thinking about how data can and should be combined. Throughout this section, we refer to Table 3D-1, which illustrates some of the challenges associated with various types of data that might be integrated, and Table 3D-2, which lays out a series of sources of inconsistency that can introduce errors into integrated analyses.
As the tables illustrate, myriad factors lead different data sources to yield somewhat different conclusions. This variation is to be expected, as social measurement is inherently somewhat imprecise. Integrating datasets may initially seem to only highlight the inconsistency or variability of estimates, but when we understand the sources of differences, we can account for them and generate converging estimates across approaches, which should induce confidence. Indeed, converging evidence that emerges without common sources of bias represents some of the most actionable social research (Campbell and Fiske, 1959). Hence, attention to biases that are likely to be present across the sources of data that are being integrated is critical for determining how confident we should be in the conclusions of analyses generated using those sources. By considering how various sources of data shown in Table 3D-1 relate to possible sources of variability shown in Table 3D-2, analysts can assess what level of convergence they should expect in their results.
2.1 Target Populations
One of the first steps for all human research involves determining the population of interest, that is, the group of people (or entities of any type, e.g., businesses) that an analyst would like to know something about and extrapolate the results to. Depending on the analytic goals of a project, this could consist of anything ranging from a small set of individuals in a critical network to entire populations at the national or regional level. As discussed
TABLE 3D-1 Data Types and Considerations
| Data Types | Description |
|---|---|
| Survey data | Data collected through planned interviews of respondents with preset questions |
| Digital trace data from devices | Data generated through the activities of individuals who are carrying around or using a particular device |
| Social media data | Posts, engagement, profiles, and follower information from social media sites |
| Online text and news | Data obtained through scraping or otherwise coding up textual information that is posted online, often from news websites, forums, or blogs |
| Official records | Data produced by organizations or governments |
| Marketing and corporate data | Estimates of individual-level attributes based on merging data from companies, addresses, and other sources of information |
| Geographic data | Information about local areas of some size, can be based on survey data, information about places (e.g. soil, weather), or voting. |
| Field observations | Field data collectors (e.g., interviewers) record their observations about the neighborhood (e.g., noise level), sample houses/establishments (e.g., presence of kids’ toys in the front yard), as well as neighboring houses/establishment. |
| In-depth interview data | Qualitative data obtained from informants familiar with the topics through less structured interviews. |
| Photographic data | E.g., Google street view |
| Satellite data | E.g., Google satellite |
| Geographic tracking | Data gathered by following objects in space |
| Inferred data | Data that is estimated based on other known features of an individual but appended to individuals as if it reflects a direct measurement about them |
| Proprietary data | Data that is obtained, but the methods used to derive it are unknown, which often occurs when data come from corporations |
| Network data | Data about how various actors, individuals, or institutions are related to one another |
| Behavioral coding data | Data that is collected through the coding of observed behaviors (whether coding is conducted manually or algorithmically) |
| Agent-based and computational modeling | Data that is simulated based on known and approximate parameters to simulate possible states of the world (one example being climate models) |
| Special Considerations |
|---|
| Question wording, sample coverage, unit and item nonresponse, costs, lead time |
| Privacy implications, variations in willingness to participate, variability in device capabilities, ethical concerns |
| Posts are behaviors and may not express attitudes. There are social motivations to participate. Sites may have different norms of usage generally and across subgroups. Messages may not be permanent or public. Data may be more timely than data from other sources. Site changes can change norms of use or complicate data collection. |
| Scraping methods need to be generated for each site, variability in updating of information. |
| Often only available in highly aggregated form Frequently slow in release High over-time consistency |
| Data quality may vary heavily across units. |
| Need to match data at each level of aggregation, aggregate statistics can paper over individual differences. |
| Observation procedures may vary by firms. Interviewers may vary in their ability to observe these contextual data and in their reporting. |
| Difficult to know how comparable the data are across individuals. |
| Timing and currency of data capture Machine learning tools can sometimes be used, but may be inconsistent in their accuracy depending on training data. |
| Timing and currency of data capture Machine learning tools can sometimes be used, but may be inconsistent in their accuracy depending on training data. |
| Permission is sometimes necessary. |
| Ability to conduct tracking can depend on things like device use. Accuracy of inferences is often unknown and may even be heterogeneous across individuals. Biases may be related to other variables of interest. |
| Unclear what data reflect inference versus measurement Challenges establishing certainty of observations Missingness may be systematic. |
| Ties may vary in their strength and whether or not they are directional. Presence of multiple platforms for interpersonal connections may mean that some relevant ties are omitted. |
| Ability to effectively observe behaviors when they happen. Awareness of observation. |
| These models are entirely driven by the structural model that underlies them. It is critical to think about and formally test the sensitivity of the data to variations in these assumptions. |
TABLE 3D-2 Sources of Inconsistency
| Source of Inconsistency | Description |
|---|---|
| Coverage differences | Different methods of collecting data have the potential to gather data from different sets of individuals based on who is present to be sampled. |
| Sampling error | Most data are derived from a sample of the population of interest, not from the entire population. Variability in who happens to be selected for the sample changes the results. |
| Unit nonresponse, non-participation or missing | Some individuals may not participate in the data collection activities. |
| Item non-response, non-participation or missing | Select pieces of data may be missing for some individuals. |
| Source effects | Data collected by different groups may generate different estimates. |
| Mode effects | Data collected using one method or another may produce results that differ in systematic ways. |
| Interviewer effects | When live interviewers are part of the data collection process, their identities can subtly shift study results or make responses nested. |
| Social norm effects | Individuals may tailor their responses due to social norms. |
| Familiarity effects, panel conditioning | Individuals may provide different data as they get more experienced with particular data collection methods. |
| Adjustment procedures | Sample data are often adjusted to address known differences between the sample obtained and the population of interest. These procedures can be conducted in many different ways. |
| Example(s) | Applicable Data Types | References to Learn More |
|---|---|---|
| Twitter data only provide direct information about the people who post on Twitter. Homeless people are typically not reached in household surveys. | All forms of data have varying levels of population coverage. | Weisberg, 2009 |
| Two identically-conducted studies of a politician’s job approval will often produce estimates that differ by a few percentage point just because of sampling error. This is often described as the margin of error. | Any form of data collection that uses samples | Weisberg, 2009 |
| No social media post data is available from people who lurk but do not post on social media. People are sometimes less likely to respond to political surveys if they think their preferred candidate is doing poorly. | All forms of data collection can have missing cases. | Little and Rubin, 2019 |
| Many people refuse to provide their income in surveys. | Most forms of data collection can have missing items. | Little and Rubin, 2019 |
| Election surveys conducted by some firms tend to estimate outcomes more favorable to conservatives. | Surveys (firm used), social media (platform) | Groves et al., 2012 |
| Individuals answering surveys online tend to select more extreme answers to attitude questions than those who answer on the phone. | Surveys | De Leeuw and Hox, 2014 |
| Survey respondents are less likely to answer in racially biased ways when interviewed by someone who is of the race in the question. | Studies with an identifiable data collector | Cotter, Cohen, and Coulter, 1982; Schuman and Converse, 1971 |
| People may engage in socially desirable behavior responding to look better for an interviewer. People who are providing data in front of a spouse may modify their answers to some questions. | Data collected in a social context (with interviewers or others present) | Aquilino, 1993; Krumpal, 2013 |
| Respondents in panels get faster at responding to questions over time. More frequent Twitter users may have learned different ways to craft their posts to get more likes. | Any time that data are provided through active behaviors where people can learn | Dennis, 2001; Warren and HalpernManners, 2012 |
| Many surveys provide weighted estimates to address undercounts of minority respondents. | Any data where adjustments are used to link the data to a target population | Little, 1988 |
| Source of Inconsistency | Description |
|---|---|
| Countries and cultural contexts | People who live in different places or groups may differ in how they understand what they are being asked to do when they provide data. |
| Linguistic contexts | Individuals may provide data based on different linguistic understandings. |
| Political contexts | There may be meaningful risks to firms asking particular questions or to respondents answering them depending on political context. These risks can change the ability to collect data as well as the accuracy of data collection across places or times. |
| Autocorrelation | Data from some units may be related to data from units that are geographically or temporally nearby. |
| Spillover effects | Sometimes things that happen to one individual influence the individuals around them. These sorts of spillover effects can lead to inaccurate estimates of interventions or the relevance of certain factors if the process by which they spread is not properly modeled. |
| Attrition | When we are interested in following particular individuals over time or tracking the impact of an intervention, it is important to know what kinds of individuals are no longer present as a study progresses. |
| Population changes | As the composition of a population changes, the results of data analyses will change. This can occur due to migration patterns or life cycle patterns (births, coming of age, deaths). |
| Example(s) | Applicable Data Types | References to Learn More |
|---|---|---|
| Certain questions may be more sensitive in some groups than in others. Posting behavior on social media is often very different for people in different communities. | Any cross-cultural data collection | Lee, Schwarz, and Goldstein, 2014 |
| Survey respondents in different Spanish-speaking countries may interpret the same words in different ways. Translations may change meanings in subtle but important ways. | Any data collection that crosses linguistic boundaries (within a single language or across multiple) | Lee and Schwarz, 2014 |
| Survey companies in Hong Kong that were happy to field certain questions in 2018 are no longer willing to do so. | All forms of data collection | Kalinin, 2016 |
| Places near polluting industries tend to have greater levels of air particulates even if they do not produce much pollution. | Studies across geographies or time | Havard et al., 2009 |
| When one member of a household receives a solicitation to vote, other members of the household may also become more likely to vote. | Intervention data and data that relies on networks | Aronow et al., 2021 |
| People who are suffering hardships are particularly likely to drop out of studies. | Panel data and intervention data | Das, Toepoel, and van Soest, 2011 |
| Sometimes shifts in preferences over time are due to new generations of individuals participating in the political process, and other times they are due to changes in individuals’ attitudes. | Temporal data | Abramson and Inglehart, 1992 |
in the “Drawing Inferences” paper, identifying the target population for an analysis is critical, because it helps analysts align the data collected with research goals, allows for an evaluation of the quality of the data obtained, and highlights any adjustments that may be needed for better harmonizing collected and available data with analytic goals. Any given data collection may diverge from the target population because some individuals are not covered in the data collection (e.g., homeless people), because some individuals are included in the data collection who are not part of the target population (e.g., nonresidents), and/or because some individuals are included more than once (e.g., people with multiple residences); these are all types of coverage differences, as presented in Table 3D-2. In some cases, it is possible to conduct specific adjustments to address these issues (see Section 3.2), but at other times imperfect coverage is simply baked in, meaning that their implications need to be considered post hoc.
Integrating data across multiple sources can often help analysts match the data obtained with the target population. This can happen in a few different ways. Sometimes, multiple data sources each purport to cover the full population but have differing errors (e.g., when combining geographic and survey data; see Table 3D-1). In these circumstances, the influence of any one error is reduced when datasets are combined. At other times, different data sources provide windows into different populations or population subgroups, meaning that the full target population can only be observed in the union of different streams (e.g., when comparing Weibo users in China with Facebook users in Taiwan). Integrations of data also tend to increase the precision of estimates, because they reflect the results of a larger sample of individuals. Notably, however, it is possible to rely too heavily on the integrations as an error reduction strategy and arrive at erroneous conclusions. Datasets often share sources of error that can lead to false precision in estimates (Pasek, 2015). This was the case, for instance, in models of the 2016 U.S. presidential election, where forecasts were constructed using state and national-level surveys that frequently had corresponding errors (and sometimes also using data from political betting markets, which were themselves highly reliant on the same survey data; Kennedy et al., 2018). When analysts treated the errors as if they were independent in integrating multiple data sources, they reported electoral expectations with unreasonable levels of confidence that were not warranted.
2.2 Research Goals: Point Estimates, Relationships, Trends, Causality, and Interventions
At the heart of any inquiry lies the question of what it is we want to know, implicating the type of inferences we would like to make. In the context of public opinion, there are typically a few different types of quantities
that analysts may be interested in estimating: (1) the proportion of a population that can be characterized in a particular way (point estimates), (2) changes in population attributes over time (trends), (3) the extent to which different population attributes relate to one another (relationships between characteristics), (4) the extent to which the relationship can be attributed to a causal link (causality), and (5) whether particular types of interventions can be applied to influence an attribute in a population (interventions). Going back to the example of the global assessment of opinions toward the United States, one may be interested in what proportion of the population in a particular country has a favorable opinion, how these fluctuate around the year a new U.S. president comes into office, whether the opinion differs between countries where the U.S. military is stationed versus not, whether changes in the U.S. foreign policy are lowering favorability toward the United States, and whether a media campaign may improve the pro-U.S. sentiment. These different goals alter the data that are needed to reach a particular conclusion, the set of potential factors that should be analytically addressed, and the sensitivity of the conclusions to violations of various assumptions.
Point Estimates
Point estimates provide a snapshot about a population such as the proportion of people who support a particular leader at a particular moment. For point estimates, it is important that the data accurately reflect the full population. Although it is often possible to derive population point estimates from a single data collection, integrating data across sources can be valuable for improving the accuracy of estimates (e.g., by allowing for adjustments to account for coverage errors, nonresponse, or population changes; see Table 3D-2). Any given survey assessing, for example, the prevalence of a particular immigrant group in a particular country might contend with variability that is due not only to sampling error but also to data collection methods, estimation strategies, sampling strategies, assumptions about appropriate data adjustments, and idiosyncratic sources of error (e.g., social climate toward immigrants). By either producing multiple estimates or combining data from different methods to generate a pooled estimate, analysts can do better. Different approaches to estimating the same parameters are likely to have differing errors, and because these errors are unlikely to yield identical biases, when aggregated they tend to reduce the expected error in the overall estimate. The reduction in error is expected because the strength and the weakness of each data stream are addressed in aggregation methods, not because errors from different data streams are merely cancelled out through the aggregation. It should be noted that disparate point estimates are indicative of difficulties of measuring the desired construct, in that there is no single way to operationalize such a
measurement. When a new construct is measured or when measuring a well-established construct in a new setting (e.g., measuring political efficacy in North Korea), disparate estimates may suggest measurement difficulties and aggregating them may not necessarily reduce the error.
Trends Over Time
Another common reason for integrating datasets involves assessing changes over time, such as whether support for a particular military operation is growing or shrinking. In general, trends can be identified with a few different strategies depending on analytic goals. Repeated cross-sectional studies of target populations can highlight points in time when attitudes and behaviors change and how that change is proceeding (Lebo and Weber, 2015). Cohort studies, which track specific groups of individuals over time, can identify whether observed changes are due to changes in the composition of a population or due to individuals changing their attitudes and behaviors (Samet and Muñoz, 1998). Panel studies, which follow specific individuals across multiple time points, can help identify the attributes of those individuals whose attitudes or behaviors change over time (Hsiao, 2014). All analyses carried out over time can be thought of as integrations of distinct data collections from different time points, requiring researchers to think about the comparability of the data collected across time points. Integrations across time must contend with things like changing norms that influence what people post on social media sites and how they refer to things (e.g., the term COVID-19 was not mentioned during the first month of the pandemic, because the name had not yet been designated) as well as changes in the underlying population.
Relationships Between Variables
In many cases, the central question for an analyst involves how things differ across different groups of people. When an analyst wants to compare people from different countries or people in one ethnic group with those in another group, combining datasets can be important for either generating inferences or testing the quality of those inferences. If no single study covers both areas adequately, then the compilation of multiple datasets constitutes a necessary step for generating a conclusion. Here, key questions revolve around the compatibility of the different data collections, as observed differences between regions may instead reflect differences relating to the respondents from whom data was collected, how that data was collected and processed, or the political, social, and linguistic contexts that may have led to these differences. In contrast, when relations between variables are measured using multiple datasets that cover the areas in question, the
benefits are more akin to those for point estimates: increasing precision and reducing sources of variance that may be unique to one dataset or another.
Causal Relationships
Analysts frequently want to know whether something that was done had a particular effect, such as whether a new program of the U.S. Agency for International Development improved attitudes toward the United States. Demonstrating that two factors are related to one another may sometimes mislead or tempt analysts to conclude that one factor affects the other, implying a causal link. Perhaps no statistical rule has received more attention than the truism that “correlation does not imply causation.” Understanding whether a particular relation exists with or without a causal link and identifying what can be done in one factor to effect changes in the other factor requires that analysts get beyond mere numeric associations. While challenging, causal inferences are likely to be among important analytic goals of the intelligence community (especially as they relate to questions like “What intervention strategies are effective in shifting Country A’s public opinion more favorably toward the United States?” and “Was Policy B successful?”). Formally, causal relationships can be identified with confidence only where the cause precedes the effect, the cause is related to the effect, and no other alternatives explain the effect (Mill, 1898). In most contexts, causal identification is only present where experimental manipulations are introduced either by a researcher or through some other randomized or quasi-randomized process (e.g. a policy that is rolled out to a random subset of housing voucher applicants).
Assessing the likelihood of a causal relationship where randomization is infeasible or otherwise has not been implemented can often be aided by a strong theoretical understanding of how such processes typically operate, effective elimination of other alternative explanations, and by a convergence of evidence (Shadish, Cook, and Campbell, 2002). Evidence that an association is stronger in regions of a country that share a particular history, for example, may help narrow the range of possible causes for that relation, and this sort of evidence both better explains the mechanism and rules out likely alternatives. A variety of sophisticated statistical techniques used in data analysis can also help isolate likely causal mechanisms when analyzing quasi-randomized experiments or observational data:
- Mediation and moderation analyses can reveal the extent to which proposed mechanisms explain how a relationship between variables actually operates (MacKinnon, Fairchild, and Fritz, 2007)
- The use of control variables and statistical matching approaches can help rule out alternative explanations (Rubin, 1973)
- Instrumental variable approaches can test the direction of a proposed causal relation (Angrist, Imbens, and Rubin, 1996)
- Regression discontinuity designs can help link changes in an outcome with particular events (Thistlethwaite and Campbell,1960)
- Marginal structure models can correct for time-dependent confounders (Robins, Hernan, and Brumback, 2000)
These strategies are discussed in section 4.3. All these approaches address specific confounder issues in causal inference and require certain data set-ups to improve conclusion robustness. Similar data collection methods yield more robust conclusions than differing ones and data collected from similar individuals (or even better, individuals who are part of a panel) is more causally robust than data collected from distinct segments of the public.
Interventions
An analyst’s goal may not be merely to understand the population but to directly influence it, such as when deciding how to combat a disinformation campaign. Here, the analysis question extends from seeking some understanding about whether one thing causes another to determining what kinds of initiatives successfully change a particular measure of interest in a targeted way. In the context of elections, there may be interest in shifting voter preferences, or when disinformation is widespread, the goal may be to encourage people to correct problematic misperceptions. Datasets may need to be merged to ascertain how the population targeted by a particular intervention relates to the population that was not targeted by that intervention or to allow researchers to match information on the targets of an intervention to data that might reveal evidence of efficacy.
2.3 The Focus of Measurement
Another critical aspect of data integration stems from considering exactly what it is we want to measure. This is often trickier than it may initially appear. Consider a situation where a large number of people are expected to attend a political protest on some issue. Analysts may want to know a variety of very different things related to such an event. In some cases, it may be valuable to reach conclusions about the profile of particular individuals who are likely to participate in the event. In other cases, it may be useful to understand the distributions of different types of people who are at the event. In yet other cases, the relevant parameter may be the number of people who can be expected to show up for the event. The differences between these goals can be important. Aggregations of the best
estimates of individual behavior can lead to biased assessments of collective behavior if the errors in individual estimates are not carefully mitigated through any models.
There are many additional research goals, of course. In an environment where we care about messaging, we might be interested in the factors that encourage a particular behavior or instead in what novel messages might encourage people to engage in it. These can differ if the effects of messages are cumulative or if the impact of one type of message has been exhausted. With respect to the popular support of a particular policy proposed, there are again multiple distinct ways of thinking about the question, and each requires different measurement approaches. The proportion of people that support a policy is often different from the proportion that would support it if they knew more about it, for instance. The former may best capture a contemporary political environment but may also distort if there are widespread misunderstandings that could be corrected. The latter can sometimes be estimated using statistical simulations (Althaus, 1998; Bartels, 1996), provision of information, or other techniques such as deliberative polling (Fishkin and Luskin, 2005).
Finally, the data we can gather about individuals might consist of various components of beliefs, attitudes, experiences, and behaviors. Different sources of data provide different windows into these components. Expressed attitudes on Twitter, for instance, are not the same as what people say when asked a question in a survey (see e.g., Pasek et al., 2020). For experiences, behaviors, and some factual beliefs, ancillary sources of data (e.g., official records or geographic tracking) can allow for validation of a survey measure. In other circumstances, there is little option but to take a measure at face value.
The links between the different kinds of things we want to measure and the data that are available can have myriad influences on conclusions that can be drawn. While it is impossible to be generally prescriptive about how data collection should work for a particular purpose, thinking about what is being measured, the quality with which it is being measured, potential biases in that measurement, and how these all relate to the research question is critical.
Measurement error models may prove helpful. In the language of psychometrics, criterion relevance, where the actual criterion of a measured construct reflects the conceptual criterion (Messick, 1989), may not be realized if the actual criterion is deficient in capturing the conceptual criterion and/or contaminated with something other than the conceptual criterion (for example, using smartphone data to assess crowd sizes may yield biased comparisons if some groups of people in a country are more likely to have smartphones than others). Unfortunately, measurement error models often focus on avoiding contamination but not on ensuring that measures fully
capture a concept (i.e., that there are no deficiencies). Approaches to considering measurement validity can be found in section 2.7.
2.4 Data Granularity: Toplines, Crosstabs, and Microdata
Before multiple data sources can be linked, it is important to take stock of the data that are available (or are being collected) to assess what can be done with them to answer the central questions of an inquiry. For example, as discussed in the “Drawing Inferences” paper, survey data can be used to answer all sorts of questions about a particular country or population. When researchers are designing a survey and collecting the data, the conclusions that can be reached depend on the limits of the data collection itself. In contrast, when currently available data are being used, analysts are limited by the forms those data can take. Sometimes the full original dataset is available and researchers can use this for their analyses. In this case, we say that the researcher has access to the microdata (microdata from a survey may have 1,000 rows, each reflecting the answers of a single individual to a set of survey questions). In other circumstances, however, only aggregates of the data are accessible. These typically come in two forms: topline results report on the overall proportion of a population that shares a certain characteristic (e.g., an analyst looking at topline reports may only know that in October, a country’s president had a 46 percent approval rate); crosstabs reveal how these proportions vary across particular population subgroups (e.g., approval was 35 percent in one ethnic group and 53 percent in another). For these latter types of data, researchers need to be aware that many components of the data collection and analytic process are baked in (i.e., their implications need to be considered post hoc). There may be no way for an analyst to exclude an irrelevant population (e.g., non-citizens) or to make different adjustments to the data. Approaches to integrating data differ depending on this question of data granularity.
When linking microlevel datasets, conclusions can be generated for individual units. This may not be the case when higher-level aggregates of the data are being used. Despite the inherent limitations that crosstabs and toplines have, they can nonetheless still be useful. For instance, the proportion of a population that shares some belief or that is planning to vote a particular way may be a primary outcome. Topline estimates of these quantities sometimes even include adjustments to better represent the population (e.g., using survey weights). Integrating this sort of data can allow analysts to track trends over time or to consider the similarities of results across data collection methods but cannot yield individual-level insights. It also encourages different analytical approaches (see Section 4).
2.5 Representativeness: Sampling Biases, Missingness, and Attrition
Except for special cases where census data are available, inference is made with sample data for a target population, requiring some assurance about representativeness. Imperfect representation may arise from various sources, all of which can be summarized as a missing data issue per Little and Rubin (2019), as the data do not include all for whom the inference is intended. A sampling frame may omit certain elements (e.g., a population that is difficult to reach), and this pattern may be systematic, resulting in coverage biases as noted in the “Drawing Inferences” paper. The sample may be drawn nonprobabilistically, meaning that the sampling mechanism (i.e., the probability at which a unit is sampled) is unknown (see “Alternatives to Probability-Based Surveys”). Nonrespondents who are sampled but do not participate in a survey or do not provide an answer to certain questions may systematically differ from respondents, hampering the representativeness of a study. In a longitudinal study, those who participate in earlier waves but drop out cause concerns about representativeness in subsequent waves, as well as about trend analysis. It should be noted that the representativeness should be assessed for a given analysis not for a dataset, because variables in a given dataset are subject to different types and magnitudes of biases.
2.6 Heterogeneity in the Data Generating Process
There are a variety of methodological and nonmethodological factors that may influence the results of different studies. For all studies, there are aspects of data collection that are idiosyncratic, either because of some particular component of the way data were assembled or because the time at which the data collection occurred may have shaped the results obtained. Distinguishing meaningful signals from data noise is therefore a constant challenge when considering multiple data collections, even if they come from the same basic source. In the survey world, the total survey error (TSE) framework lays out many of these potential sources of variability (Weisberg, 2009). These include coverage error, sampling error, nonresponse error, and measurement error (Groves, 2005) as explained in the “Drawing Inferences” paper. Of course, nonsurvey sources of data also introduce their own forms of idiosyncratic variability but their errors can also be understood under the TSE framework. We discuss these briefly below, and also describe a series of particular types of errors to consider in Table 3D-2.
While assessing comparability in coverage, sampling, and nonresponse may be straightforward if proper documentation is available, assessing measurement comparability is often more complicated. For example, two
identical questions may yield different results depending on their locations within a questionnaire (e.g., opinion toward allowing foreign communist newspaper reporters to report from the United States is more favorable when this question is asked after than before whether other countries, like Russia, should allow U.S. reporters; [Schuman and Presser, 1996]). Seemingly slight changes in question wording can distort trends, as happened when the Current Population Survey introduced a new wording for questions about health insurance in 2014 (Pascale, Boudreaux, and King, 2016). This change in wording improved the data in that the health insurance coverage estimates were in line with similar surveys (Medalia, O’Hara, and Smith, 2016), but the change also necessitated cautioning users who tracked characteristics over time (Hill et al., 2019). Other sources of variability can include the mode of a study (e.g., online versus face-to-face), the processes people are using to provide data (e.g., speaking with an interviewer or posting a message accessible to the world), what languages are made available for participation, or even the quality of official recordkeeping (which can vary across institutions within a single country; e.g., at hospitals or morgues), and the affordances of whatever medium they are using to communicate (e.g., when Twitter changed its character limit, different messages were possible). Even when these sorts of factors look comparable, there may be important differences (e.g., survey respondents might refuse to answer a question they think comes from the government even if the question is identical to one asked by a private firm; or expressed attitudes toward racial groups may depend on the presumed race of the interviewer [Schuman and Converse, 1971, Davis, 1997]).
Nonmethodological factors can also shape the data generating process. Different survey firms may be involved in a study using a single method (e.g., the European Social Survey, which employs different firms to collect data in different regions). Depending on firms’ capacity and capability to adhere to the specified method, the results may vary. Assessment of the results also depends on the transparency of methods and the thoroughness of the information that firms provide. When integrating data across social/political contexts, a question sensitive in one context may not necessarily be so in another context. In some countries, it has been common for third parties to be present during interviews, which may alter the responses people are willing to give (Diop, Le, and Traugott, 2015; Mneimneh et al., 2015). With societal and political changes, these contextual factors may also change over time. For example, one firm that was willing to field questions about the desire for political independence in Hong Kong in 2018 was no longer willing to do so in 2020. Data from an authoritarian society may suffer from survivorship biases, where only certain results are selectively made available. When such a scenario is likely, one may consider exploring such biases through qualitative research (e.g., interviewing key experts on the topic) or available data that may allow modeling of these data hand-picking processes.
2.7 Consistent Measurement across Contexts
Social inquiries often involve comparing groups of people. Differences in attitudes and behaviors across groups or regions can highlight emerging issues or interventions that may be necessary. One example is the Organisation for Economic Co-Operation and Development’s Better Life Index in which over 3 dozen countries are compared on dimensions such as life satisfaction, social support, and civic engagement. Another example is analysis of COVID-19 vaccine hesitancy by racial and ethnic groups in the United States (Savoia et al., 2021). Comparative research or data collection may take place from an etic approach where the researcher is an outsider to the groups in the analysis and assumes that the concept studied exists across groups. In contrast is the emic view, which focuses on intrinsic within-group understandings. Rich contextual information about each group is likely to be glossed over under the etic approach, but comparative studies may become extremely difficult (or almost impossible) using the emic approach to studying culture (Harkness, 2008). Ideally, the data collection will be designed for the goal of measurement comparability across comparison groups. However, this may not be possible unless comparison groups are fully and exhaustively known prior to data collection. As the sections that follow reveal, differences in measurement across contexts can confound data collected using identical methods, and the effects of these challenges may be particularly difficult to unpack when data integrations compare collected data across contexts.
2.7.1 Data Integration across Regions, Countries, Cultural Contexts, and Languages
Juxtaposing data streams collected from different communities or places is central to comparative analyses, thus the comparability of data streams becomes a prominent methodological issue. When multiple countries are involved, data collection methods are likely to differ, reflecting differences in their infrastructure (e.g., wi-fi availability), political climate (e.g., social media ban), or the religious context (e.g., necessity of matching interviewer’s and respondent’s gender).
Even when using the same method, challenges persist when multiple groups are considered in an analysis. In some cases, the general awareness about data collection may differ across groups, influencing data comparability. For data collection that involves multiple linguistic groups, translation obviously becomes an inherent step that may take various shapes. Instruments are often prepared in English and translated into target languages. Finding a term in target languages that preserves the meaning in English is often not a trivial task (Harkness and Schoua-Glusberg, 1998), and translation alone can be a source of measurement noncomparabil-
ity (e.g., Lee et al., 2019). For those who speak multiple languages, the language in which the data is collected brings cultural norms associated with that particular language to the interactions, such as survey interviews (Marian and Kaushanskaya, 2004; Ross, Xun, and Wilson, 2002), affecting measurement (Lee, Nguyen, and Tsui, 2011; Lee and Schwarz, 2014; Lee, Schwarz, and Goldstein, 2014). Linguistic differences in meaning and usage are also often present across dialects of the same language (Renschler and Kleiner, 2013).
Countries are frequently implicitly treated as a cultural unit, but this is not a correct approach. Two neighboring countries may share a similar cultural background, while a single country may be home to multiple racial and ethnic groups that do not share a unified cultural background or a single language (e.g., U.S. vs. U.S. Latinos vs. U.S. English-speaking Latinos). In fact, culture is knowledge learned and shared among a group of people through verbal and nonverbal communication (Goodenough, 1971; Hong, 2009). It is conceivable to designate comparison groups that share common experiences and knowledge rather than countries as “cultural” groups.
When analyzing data from social media, norms of site use can differ across populations. Individuals who participate in “Black Twitter,” for example, are less likely to use their real names or provide precise locations than individuals who are in other groups (Freelon, 2018). This can make it harder to generate all types of inferences about them (such as their gender) or render inferences less accurate. Name identification tools also may be more accurate for some populations than others, introducing systematic errors into analyses.
2.7.2 Measurement Equivalence
The link between cognitive psychology and survey measurement is well established (Schwarz, 2007) in that the processes of how people understand survey questions, gather relevant information, and form responses provide a framework to improve survey questions. With culture being an elementary construct of cognition, it provides a system to organize personal experiences (Nisbett et al., 2001). To illustrate: something as fundamental as time orientation, the temporal dimension of past, present, and future to which individuals assign coherent meanings to their personal experiences (Kluckhohn and Strodtbeck, 1961), covaries with culture (González and Zimbardo, 1985; Levine, 1997) and affects survey measurement (Lee, Liu, and Hu, 2017). What is required in comparative research data is measurement equivalence (Scheuch, 1968). This goes beyond surface-level considerations about cross-sections with culture (language and religion) and considers the comparability of the ways in which a given measure functions across cultures and contexts. Self-rated health, for example, is a simple survey ques-
tion proven to predict subsequent mortality in many Anglo cultures (Idler and Benyamini, 1997). Whether this predictive power holds for non-Anglo cultures is the key to the functional equivalence of the measure (McGee et al., 1999). This is a vital but difficult task that persistently burdens cross-cultural research. While measurement equivalence is an issue applicable for nonsurvey data, there is little room for researcher control in those sources, making its assessment difficult. Sometimes, known sources of inconsistency can be identified and accounted for, but at other times, sufficient information is simply not available.
2.7.3 Response Style and Reporting Heterogeneity
Even when the substantive meaning of a question is consistent across comparison groups, there can still be variations in how respondents are classified based on the way individual responses are assessed. In opinion and attitude research that analyzes subjective measures, Likert response scales that ask respondents to express their opinion and attitude on the scale of agreement (strongly agree, agree, neither, disagree, strongly disagree) are an indispensable tool particularly in public opinion research. While extremely popular, these scales are subject to biases associated with response style, a tendency to choose certain response points regardless of the question content (Van Vaerenbergh and Thomas, 2013). Response style is systematic and can be culturally distinct. Latinos in the United States, for example, are shown to acquiesce more than non-Latinos (Davis et al., 2019). Asians tend to choose middle response points more than non-Asians (Chen, Lee, and Stevenson, 1995). When comparing Latinos and non-Latinos on their life satisfaction measured with a Likert scale, it becomes difficult to ascertain whether the difference (or lack thereof) between the two groups comes from true life satisfaction or response style (Lee et al., 2020). Particularly for multi-item measures, reliability and validity may become erroneously inflated or deflated due to response style effects. There is some attempt to use item-specific response scales rather than Likert scales (Fowler, 1995; Saris et al., 2010), but the literature does not agree on its effectiveness (Liu, Lee, and Conrad, 2015; Ross, Steward, and Sinacore, 1995; Saris et al., 2010).
Reporting heterogeneity is a more general term describing variability in how individuals express their own states (Bago d’Uva et al., 2008). Response style is but one form of reporting heterogeneity. Another occurs when individuals are tempted to select verbally labeled scale points in an otherwise numerically labeled scale (Pasek and Krosnick, 2010) or when some individuals tend to select generally systematically higher values on certain scales (Wilcox, Sigelman, and Cook, 1989). When reporting heterogeneity arises at random, it is of little concern because it only introduces
noise into measurements. When it differs systematically, particularly across comparison groups, this heterogeneity confounds comparisons.
2.8 Political and Ethical Considerations
It is important to consider the implications of assembling the data that will be used for a project in all studies, but especially when combining datasets. These implications can influence the work that is being done and the potential costs and benefits associated with doing that work. These constitute important limits of data collection, either because the data desired cannot be collected, should not be collected, should not be integrated, or must be properly safeguarded if it is to be used.
One type of potential concern regards the feasibility of a particular data assemblage. Sometimes the work necessary to collect the data incurs prohibitive costs in money or time that negate the value of the data. Another involves the possibility that there will be political risks to individuals whose data is being used in a study. Some individuals may withhold attitudes that they think are politically risky or will get them in trouble if they do express those attitudes. Expectations of privacy and the risks of leaked information may differ across political contexts. There can also be social risks to individuals if the information they provide could be viewed negatively by others, leading them to provide information selectively or to experience harm if they are forthright. One notable context for social risk comes if others are present during the data collection process, which is often more common outside the U.S. context (Mneimneh et al., 2015).
Data collection and integration can also pose risks for data collectors and sponsors. Asking some questions in some contexts may be illegal, incur reputational risks, or elicit unwanted political oversight. Finally, it is important to note that there can be risks from data inferences that can be made by combining datasets that may not be present if data are not combined (Singh et al., 2020). One notable case of this occurred when a teenager’s pregnancy was outed to her parents through targeted advertisements (Hill, 2012). Recognizing these risks prior to data collection is critical for ensuring that analyses are ethical.
When ethical issues are apparent, the risks need to be weighed against the potential benefits. Researchers engaged in a particular data collection or integration project are often poorly situated to conduct these assessments. In academic and many corporate settings, outside evaluations are built into this process through the use of institutional review boards. Additionally, in many cases, it is important to gather informed consent from individuals about whom data are being collected (or integrated). These considerations
have a basis not only in ethics norms but also in international human rights laws (Constantin, 2018).
SECTION 3: EFFECTIVE MEASUREMENT WITHIN THE DATA STREAM
Before data can be meaningfully integrated across streams, measurements of key parameters within each of the individual streams need to be harmonized. In other words, the data need to be put into a format such that the conclusions reached from individual streams are comparable to one another, the measurements share meanings, and the populations the data describe are compatible. Typically, this process involves an attempt to conduct data cleaning processes, to appropriately link the population for whom data streams were available with the target population, and to address missingness in the data that were collected. In many cases, there may also be multiple components that will be used for any given measurement, requiring that analysts use one of a series of techniques to generate these measures. Collectively, it is important to understand and estimate the influence of any sources of error that may need to be accounted for in analyses across datasets. While the process of producing effective measures may use one or multiple datasets, the process serves to improve the measurement from the individual data streams rather than to generate conclusions across them, which we address in Section 4.
3.1 Data Cleaning
Social data are often messy. Cleaning may take different forms depending on the type and nature of the data that are being considered (see e.g., Ilyas and Chu, 2019). Furthermore, data cleaning should be approached with attention to the conclusions to be reached.
Official records can have all sorts of errors, ranging from outdated information to mistakes made when data were copied from one form to another (e.g., voting and health records). Survey interviewers transcribing verbatim responses are prone to shortening and omitting words, potentially distorting the meaning of open-ended responses. Social media data are rife with misspellings. And observers may sometimes guess at key pieces of information. These errors can distort conclusions if they are systematic. Hence, one central process for almost all data analyses involves cleaning the data to be used. Even when data cleaning is not strictly necessary, checking the plausibility of the observations obtained and spot-checking individual pieces of data to assess accuracy, the potential for bias, and the operational issues in the data collection activities is always worthwhile.
Analyses relying on textual, visual, and auditory data often require specialized forms of data cleaning (see Mneimneh et al., 2021) not found in handling numeric data. In the case of textual data, it is often impossible to extract meaning without excluding certain words such as so-called “stop words” from the analysis (e.g., “the,” “and,” “she,” etc.). Depending on the research goal, it may be helpful to use processes such as stemming (the elimination of word endings such as changing “eating” to “eat”) or lemmatization (a version of this same process that also accounts for words with varying forms such as “eat” and “ate”). In certain contexts, homogenizing cases or removing hashtags, hyperlinks, punctuation, and emojis may be important (cf., Kathuria, Gupta, and Singla, 2021). For images, grayscaling or object extraction algorithms might be an initial analytic step required for making sense of the data.
Identifying implausible individual-level data is often relatively straightforward. Individuals in voter files who appear to be between 1,000 and 1,100 years old (a surprisingly common occurrence) likely had their ages copied from a registration form without the proper leading digit. Also, documents purportedly written by the author “Arbor, Ann” were presumably mis-parsed by a computer. Correction of these sorts of errors depends on how well the source of the issue can be identified. This is easier for some cases than others. A voter file mistake including the birth year “983” (presumably: 1983) is much easier to reconcile than one with the birth year “193” (which could be 1973, 1983, 1993, etc.). Sometimes, implausible data is only apparent when generating summaries of distributions or point estimates. In situations where implausible data can be easily corrected, it is often a good idea to do so, although it can introduce errors when corrections are only possible for a biased subset of cases.
In some other cases, data cleaning involves removing entire irrelevant cases from a data source. For example, many analyses of social media data actively omit posts by nonpersonal accounts (such as bots or organizational accounts) when these are not relevant for the analyses at hand. Although algorithms exist to detect these sorts of accounts, these are far from perfect and may need to be honed to the specific question at hand (Cresci, 2020). Some survey researchers also remove respondents who behave poorly from the data (by, for instance, answering questions without reading them, speeding through a survey, or answering in ways that are statistically implausible [Chandler, Sisso, and Shapiro, 2020; Lopez and Hillygus, 2018]). Although some analysts drop these sorts of respondents, there is a considerable ongoing debate about whether the benefits of omitting data from inattentive respondents are worth the biases that may result (Alvarez et al., 2019; Kung, Kwok, and Brown, 2018).
3.2 Linking Sample Data with the Population
It is typically preferable to design data collection such that the data gathered will reflect the population of interest as close as possible. A good
survey will ideally include a broad range of population subgroups in the sample that serves as a microcosm of the larger group of interest. An effective official data source will be one that produces relatively equitable coverage of all relevant population subgroups. When the design of a data collection effectively approximates the population of interest, less work will be required to improve the accuracy of conclusions from that data, and there is less chance that analytical strategy will result in erroneous conclusions. Indeed, statisticians often consider the difference between inferences that can be made by design and those that are accomplished through modeling. While both approaches can be appropriate, it is possible to understate the errors introduced by a design or in the process of analysis fitting a model.
For gaps that remain after data collection, a variety of weighing and adjustment methods can be used to link any given dataset with a target population. Often, data that come from a study vendor already include some form of weights designed to accomplish this very feat. Understanding the methods used to generate those weights is often important as different strategies for weighting and adjusting datasets can yield somewhat different conclusions. Common methods for weighting data include post-stratification (discussed in the “Drawing Inferences” paper), raking (iterative proportional fitting), and calibration. These approaches require population benchmarks that a newly collected dataset can be pegged to. There are a number of textbooks and other how-to guides that lead researchers through the process of producing weights (e.g., Valliant, Dever, and Kreuter, 2019). An important note about using weights to adjust to a population is that the process of doing so may increase the overall variance in results obtained and therefore reduce the effective sample size (Kalton and Kasprzyk, 1986). This is particularly true as the variability of a set of weights increases. As the differences between a sampled population and the target population grow bigger, the weights assigned to different cases become more variable. Attempts to correct for bias by weighting can therefore increase overall error if the variance introduced through weighting is larger than the bias being corrected for. When this happens, it is sometimes preferable to forgo an attempt to formally weight the data to match the population and instead estimate the value of a particular parameter across multiple population subgroups and then assess whether those estimates are generally consistent with one another.
A series of alternate approaches to adjustment focus on generating inferences that match the population in other ways. They have been discussed in the context of nonprobability samples to which design-based inference does not apply. These methods can be classified into quasi-randomization versus superpopulation approaches (Elliott and Valliant, 2017). Quasi-randomization approaches attempt to model pseudo-inclusion probabilities using the available data (e.g., propensity score weighting in Lee and Val-
liant, 2009), and the weights are applied to all variables in the given dataset. Another approach involves thinking of any given sample as part of an arbitrarily large superpopulation with various subdivisions. When thinking about the sample in this manner, it becomes possible to use methods such as multilevel regression and poststratification (MRP [Wang et al., 2015]) or merging data with large official sources of data to generate inferences. Superpopulation approaches attempt to model conclusions specific to a given outcome rather than the dataset. Because these sorts of approaches use models to assess and estimate the links between sample and population, model misspecification becomes an important consideration in assessing the reliability of the conclusions reached. Overly precise models can mistakenly include random noise as a signal and lead to undue confidence in results, while insufficiently precise models can induce null results. Estimating precision accurately depends on understanding the sources of error in the data as well as how they should be parameterized.
One important note about linking data with the population is that the tools to conduct these links reduce bias at the expense of introducing additional variance into estimates. Because this is the case, it is important to consider the sensitivity of conclusions to both the reduction in bias and the increased variance. In many circumstances, the total errors in models that adjust data can be larger than the total errors in models that do not do so. For this reason, many analysts report population point estimates using weights but do not report weighted correlations or regressions (see Pasek, 2015).
3.3 Addressing Item Missingness (Imputation)
For missing data on some variables within individuals, a series of techniques have been developed to generate conclusions despite this missingness. These approaches are often referred to as imputation and are designed to identify values for data that might be missing. Imputing for missing data is important but can also be complicated. Disregarding cases with partial data, known as listwise deletion, is likely to produce estimates that are biased toward the kinds of individuals whose data is complete, meaning that this approach is distinctly suboptimal (even though it is the default behavior in statistical software packages [King et al., 2001]). Furthermore, doing so implicitly assumes mean imputation, as the missing cases are replaced with the mean of the observed cases at the inference stage. Providing each missing case with the most likely observation, however, introduces a different problem as estimates may become overly precise (as they are based on more data than they should be and that data has too little variability). Instead, proper imputation requires simultaneously estimating missing values and accounting for the errors in those estimates.
Two imputation approaches effectively fill in for missing data in ways that improve precision without overfitting. These are multiple imputation and maximum likelihood imputation. Multiple imputation conceptually applies to imputation methods allowing random errors associated with imputation (Rubin, 1987) and hence is based on regression models to estimate the value of individual pieces of missing data as a function of other available variables without missing. Uncertainty in the imputed values is addressed by imputing multiple times and considering variability among multiple estimates using the multiply imputed values (Allison, 2001). This method thus relies on the production of multiple datasets that are then pooled for final estimates. Maximum likelihood imputation uses the covariance matrix to achieve similar ends but is typically only available when using structural equation modeling software (Allison, 2003). For both imputation approaches, it is important to note that the set of covariates used for the imputations can shape the results. Nonetheless, these are the best ways to address missing data, as approaches like excluding missing data tend to increase error considerably (Peytchev, 2012).
While ostensibly suboptimal, there are occasions where other imputation approaches are used, especially when there is an active goal of generating only a single dataset. Hot deck imputation imputes values for missing variables based on selecting values that are present for other similar cases (Myers, 2011). Single-replicate model-based imputation strategies impute the most likely values for individuals based on a regression or other similar model but do not consider the error in that estimation as a parameter (Kim, Sugar, and Belin, 2015). Understanding these processes can be important because many sources of data include inferred or imputed values for individuals based on these methods. Hot deck imputation and single-replicate model-based imputation tend to generate overly precise estimates, so data generated using these methods should be employed with caution.
3.4 Generating Composite Measures
Whether within or across data streams, many key measures are estimated at the intersection of a series of other measures. Composite measurement strategies can help to better isolate key concepts, avoid overreliance on a potentially error-prone measure, and mitigate numerous sources of bias. They thus represent an important part of the measurement modeling process.
The simplest type of composite measure is an index, a measure based on an average or weighted average of some set of measures. These types of measures pool the variance across individual items, reducing the impact of each single one and thereby disregarding any idiosyncratic errors that may be present. Indexes can be calculated by hand when measures are averaged
or summed, or the proper weighted combination of measures can be estimated using a technique called principal component analysis (Dunteman, 1989). Errors from individual measures are still present using these techniques, but they are less important because they are discounted by other measures that do not share the same errors. Estimates of the similarity of the different items (typically coefficient alphas or correlation coefficients) help to reveal how well the measures used hang together.
More sophisticated types of composite measures focus instead on the shared variance across a series of items, generating what are called “latent traits” using techniques such as exploratory or confirmatory factor analysis (Harman, 1976) and item response theory (Embretson and Reise, 2013). These methods produce similar composites to averaging methods, but their focus on shared variance means that idiosyncratic errors are completely ignored. Factor analysis and item response theory approaches can also generate weights and yield important information about how well the eventual measure captures the underlying construct of interest.
3.5 Validation
Validating each data stream before integration adds to the confidence in the results drawn from the integrated data. Reliability and validity are two elements that can be considered when engaging in this process. Reliability is a concept applicable for multi-item measurement instruments (e.g., satisfaction with life scale by Diener et al., 1985) and indicates whether items intended to measure the same construct yield similar results. Cronbach’s alpha (Cronbach, 1951) is undoubtedly a popular tool, but its assumptions are easily violated (Sijtsma, 2009). When response style (discussed in Section 2.7.3) is a factor, Cronbach’s alpha-based reliability measures may be erroneously inflated or deflated. Alternative tools such as the greatest lower bound (Jackson and Agunwamba, 1977) as a reliability measure may be less susceptible to such issues.
Validity can be assessed to some extent. For example, it is well known that life satisfaction is related to health (Grant, Wardle, and Steptoe, 2009), so we should expect a significant and positive relationship between measures of these two variables. This sort of correlation would provide formal evidence of convergent validity. In contrast, analysts may be interested in establishing discriminant validity in some cases where it may be important to show that items are measuring things that are distinct (e.g., a prime minister’s approval should be distinguishable from party voting intentions). Face validity is another tool to exploit for results when analysts have qualitative information. Life satisfaction that is too high or too low may be a signal for unfit validity. Other critical types of validity for measures include content validity (evidence that a measure captures all key components of a
complex concept) and construct validity (evidence that a measure is indeed measuring the targeted concept) and should also be considered. Shadish, Cook, and Campbell (2002) outline some of these key types of validity and discuss ways to assess them.
When validation can be done within each data stream and the results are consistent across streams, one can be confident about discerning when errors from different streams are likely to compound or instead cancel each other out. Validation exercises may add to the defensibility of data comparability, especially when data streams are from different cultural groups.
3.6 Linking Data Streams Together
After within-dataset issues have been addressed, the process of actually combining data streams to produce a single dataset often involves methods to match cases to one another at either the individual or aggregate level. There are a number of approaches to these matches that depend inherently on the nature of the datasets being combined. Data can be linked based on individual identifiers, household identifiers, group identifiers, location-based metrics, networks, or sometimes content-based metrics. Each of these types of linking is coupled with a level of precision and some amount of error. Failures to recognize these sorts of issues can be pernicious, as was the case when mistaken identity linking following the 2020 election led to inaccurate perceptions of voter fraud (Sherman, 2020).
Because there are several ways to link datasets, the quality of links and the rate at which links can be made can vary considerably. Links made using individual-level identifiers depend on the shared accuracy of those identifiers and the tolerance for discrepancies. In linking survey data with state voter records, Berent, Krosnick, and Lupia (2016) found that linkage rates could vary between 45 and 77 percent depending on the stringency of the match required. Stringent matching techniques produce highly certain matches, but match fewer records overall whereas less stringent approaches may err by linking individuals who are not true matches (e.g. separate individuals who share the same name) but match more records overall. Both can be sources of bias in analyses, as records are more likely to be mismatched if they contain common names and less likely to produce a match at all for individuals who occupy less privileged groups in society, for which recordkeeping may be less accurate. As an example, studies by the U.S. Census Bureau that attempted to link administrative records, census data, survey data, and third-party data such as consumer data show a lower match rate for racial and ethnic minorities, particularly Hispanics (Ennis et al., 2015). Individuals who rent their homes are less likely to be found in matching consumer data (Pasek et al., 2014), presumably because they produce fewer other records that get picked up by data collectors (e.g.,
warranties, official records, etc.). When data are connected across sources, individuals whose data can easily be linked are more likely to register as complete cases in the final datasets. This should be treated as a potential observational bias.
Links between datasets that are made using geographical, behavioral, or other aggregate-level connections can prove valuable for including contextual information as well as other indicators that may not be observable at the individual level. Analysts using these kinds of data must take care, however, not to overgeneralize. Individuals whose attributes differ from the norm in their group or area can sometimes be characterized incorrectly with aggregate-level data. This can be a particularly pernicious problem when the real influence comes from relative, rather than absolute, positioning. For example, a middle-class individual living in a poor neighborhood may act in ways that differ from what might be expected from their income level as well as from their geographic location. Analyses that fail to consider these sorts of relative effects can use linked data to reach precisely the wrong conclusions or may reach correct conclusions for the wrong reasons.
Section 4. Analyzing Data Across Streams
There are many ways to conduct analyses of integrations of data, and no single approach is uniformly ideal. Once the issues within data sources have been addressed, analysts can work toward analyses that bridge across data streams. The approaches used depend on the goals of a particular project. If the principal goal is to come to an understanding of a phenomenon that is measured in multiple data streams, then ensemble approaches are typically used to generate estimates from the integrated data. A common example of an ensemble approach is the use of surveys, betting markets, and expert assessments to predict the winner of an election. These sorts of approaches can employ a variety of strategies to pool estimates and increase precision, both in aggregate and for subsets of the data. If the key question is answered by comparing different datasets, models that address multiple contexts (such as populations, cultures, times, or environments) may be ideal. Various approaches allow researchers to recognize the extent to which errors in some circumstances may be idiosyncratic versus part of a larger notable pattern. By accounting for variability due to consistent sources of error in subsets of the data (e.g., firms in survey data, temporal dynamics in time series data, proximity in geospatial data), analyses can distinguish signal from noise. Additionally, when the goal of a particular analysis is the identification of a causal relationship, processes that allow researchers to identify time-ordered effects and to rule out known sources of spuriousness can yield stronger conclusions. A series of methods for each of these goals is presented in Table 3D-3 (Parts 1, 2, and 3 respectively).
4.1 Ensemble Approaches
When the purpose of integrating data streams is to gain precision, analysts need to find ways to combine sources of data in producing an estimate. There are multiple strategies for doing this (outlined in Part 1 of Table 3D-3) One general approach involves producing corresponding estimates from a variety of different datasets. To the extent that different datasets yield similar results, researchers can have more confidence in their conclusions (as discussed in Section 3.5). When different datasets produce diverging or dissimilar results, there may be reasons to worry about some combination of the assumptions that are being made, the quality of the data, or the viability of estimates from the individual datasets themselves (here, it may help to consult Table 3D-2). This approach constitutes a multiple frame estimation (Lohr and Rao, 2006). Multiple frame estimation can be particularly helpful in revealing whether assumptions about the similarity of measures across data streams and the similarity of the populations to which inferences can be made. The estimates from multiple frame estimation underutilize the full scope of the data, however, generating estimates that are less precise than they could be.
An alternative approach involves assembling all of the data across streams into a single dataset (either at the individual or aggregate level) to produce a single estimand. The estimate yielded by this sort of pooled data approach should be more precise than a multiple frame estimate (Graefe, 2021). Notably, however, it relies on strong assumptions about the similarity of estimates across datasets. While it is possible to include covariates in analyses using pooled data that capture the differences between data streams, introducing these covariates simply turns a pooled data approach into a multiple frame estimation approach, thereby mitigating some of the benefits of the larger dataset.
Multilevel modeling effectively bridges the gap between multiple frame estimation and pooled data approaches by introducing into the analysis a recognition that some of the difference between estimates is due to sampling error and the other variance is due to measurement. By treating differences between datasets as reflecting a distribution of variance along with potential methodological effects, this approach splits the difference between the two. It does so by leveraging a concept called statistical shrinkage, whereby sources of variation are presumed to introduce variation between datasets that are approximately normally distributed using the sample size and variability estimates both within and across streams to estimate that distribution (Greenland, 2000). This technique is limited without access to microdata, however, and it takes considerably longer to estimate than either the multiple frame or pooled approaches.
At times, the reason to integrate datasets is to generate the capacity to report on populations too small to be measured within a single data stream.
TABLE 3D-3 Statistical Methods for Analyses
Part 1 Ensemble Models
| Statistical Methods for Analyses | Purpose |
|---|---|
| Multiple frame estimation | Replicate analyses across contexts to assess range of potential conclusions |
| Pooling estimates, microlevel data | Combine multiple different estimates of a key parameter to generate a single estimate |
| Pooling estimates, aggregated data | Combine multiple different estimates of a key parameter to generate a single estimate |
| Multilevel and hierarchical modeling | Use a combination of micro and macro level information to generate estimates |
| Small area estimation | When a given dataset lacks granularity to address finer geographic areas or small population subgroup, direct estimates are not reliable. Small area estimation introduces auxiliary datasets with greater granularity (but with lacking detail) through modeling to improve the estimate precision. |
| Data Set-up | Example | Reference |
|---|---|---|
| Build a similar model in each frame and run Compare models to assess overall relations | National Immunization Survey (NIS) by the CDC uses multiple frames for their household survey, requiring multiple frame estimation. | Lohr and Rao, 2006 |
| Produce similar measures across all data sources Merge the data Generate an estimate across the sources | As part of the International Social Survey Program, general social surveys of participating countries embed the same module that can be pooled across countries. | Pasek, 2015 |
| For each source of data, calculate the estimate and the precision of the estimate | CNN often reports the “poll of polls” as the pooled estimate of election surveys. | Pasek, 2015 |
| Data are combined into a single dataset along with indicators of which data source each particular observation comes from. Multilevel modeling software is then used to estimate the variance attributable to variations in data sources as well as individual data points. |
The Programme for International Student Assessment (PISA) evaluates students of the Organisation for Economic Co-Operation and Development (OECD) countries. Due to its school-based data collection, multilevel models are necessary to address this nature in the analysis (Goldstein, 2004). | Hayes, 2006 |
| The outcome variable should be explained by a model sufficiently well. Link national survey outcome variables to local-area predictors (e.g., county-level sociodemographic variables) and predict the outcomes for the small areas (“synthetic” estimates). Combine the direct estimate and the indirect, synthetic estimates | U.S. Census Bureau’s Small Area Income and Poverty Estimates (SAIPE) combines multiple data sources, including the American Community Survey (ACS), the Current Population Survey (CPS), the tax records and the Supplemental Nutrition Assistance Program (SNAP) participant counts to estimate the county-level counts of children in poverty. | Rao and Molina, 2015 |
TABLE 3D-3 Statistical Methods for Analyses
Part 2 Multiple Context Models
| Statistical Methods for Analyses | Purpose |
|---|---|
| Generalized additive models | Use splines or other smoothing approaches to assess how things change over time or across some key continuous variable |
| Random effects models | Identify features of similarity across aggregated datasets and cluster standard errors and sometimes slopes based on those similar features |
| Time series models | Account for recurring temporal properties (e.g. day of week and seasonal effects) to better isolate long-term trends |
| Autocorrelation models | Account for similarities of neighboring areas when generating estimates |
| Data Set-up | Example | Reference |
|---|---|---|
| Identify values of key smoothing variable across data streams as well as any covariates that need to be controlled that might account for differences between the streams | This can be a good way to evaluate how attitudes toward immigrants have been changing over long periods of time. | Wood, 2017 |
| Identify clustering variables across data streams to control for common exogenous sources of variation in a pooled dataset | Reported levels of governmental trust might be different in various regions of a country for reasons unrelated to the key variables being studied, clustering the data and running random effects models can help avoid contamination from these sources of variance. | DerSimonian and Kacker, 2007 |
| Identify temporal patterns across data streams to control for common exogenous sources of variation in a pooled dataset | People tend to be happier during times of the year when the weather is better. We may want to remove these effects from an analysis of the causes of happiness. | Hamilton, 2020; Hillmer and Tiao, 1982 |
| Identify spatial patterns across data streams to control for common exogenous sources of variation in a pooled dataset | Pollution does not respect population boundary lines and may have an effect on outcomes of interest that is different from the related effect of siting industrial production. Disentangling the two requires assessing potential spillover effects. | Dubin, 1998 |
TABLE 3D-3 Statistical Methods for Analyses
Part 3 Causal Identification Method
| Statistical Methods for Analyses | Purpose |
|---|---|
| Regressions with controls | Control variables in regressions are used to reduce the likelihood that a controlled measure might be confounding the results of an analysis. |
| Statistical matching | When random assignment isn’t possible, researchers can identify a series of adjustments that equalize covariates across proposed control and treatment groups. |
| Instrumental variables | When there is a variable whose only potential relation to an outcome is through a proposed causal variable, this can be used to identify causal effects. |
| Regression discontinuity | Identify particular moments that are associated with changes of interest and test whether what occurred immediately before and after those moments was significantly different from prior orsubsequent trends. |
| Data Set-up | Example | Reference |
|---|---|---|
| Data includes potential confounders as well as the outcome and main predictors. | When studying gender differences in the support of a new employment policy, we control for other characteristics associated with the support such as age, education, race and ethnicity. | Allison, 1999 |
| Data should allow modeling the membership to comparison groups as a function of confounders. | Continuous off-the-job training for East Germans after reunification was found to have no impact on their earnings and employment probabilities through matching (Lechner, 1999). | Dehejia and Wahba, 2002; Rubin, 1973 |
| The causal variable is endogenous, i.e., there is a third variable affecting the causal variable. | Effect of debate viewership on the support for Proposition 209 (California Civil Rights Initiative) during the 1996 presidential election—a study was conducted where survey respondents were randomly encouraged to watch the debate. With the support being the outcome, viewership was the causal variable influenced by the encouragement assignment, and the assignment was used as an instrumental variable in the analysis, which showed a substantively strong but statistically insignificant relationship (Albertson and Lawrence, 2009). | Angrist and Krueger, 2001; Baiocchi, Cheng, and Small, 2014 |
| Treatment assignment (i.e., causal variable) is not randomized but based on an analysis, which means that the treatment selection model is known. Comparison based on extrapolation (prediction) of a given treatment. | A study of financial support to incarcerated prison inmates in California on recidivism was designed where the financial support assignment was based on the working hours. The results showed that providing financial support through prison inmate insurance program reduced recidivism (Berk and Rauma, 1983). | Imbens and Lemieux, 2008; Thistlethwaite and Campbell, 1960 |
| Statistical Methods for Analyses | Purpose |
|---|---|
| Natural experiments | Identify circumstances where a proposed causal variable was influenced through a process unlikely to be associated with the proposed outcome, then test whether the outcome was later influenced by this change. Not really an experiment because the cause usually cannot be manipulated. |
| Quasi-experiments | Examine highly similar, but not truly identical populations through randomization before and after a change in some variable that is a presumed cause. Used when randomization is not feasible or ethical |
| Mediation analysis | Determine whether the influence of a proposed cause on a proposed effect occurs by way of another theorized variable |
| Moderation analysis | Determine whether the strength of relations between a proposed cause and a proposed effect depends on the value of some other theorized variable |
| Data Set-up | Example | Reference |
|---|---|---|
| In quasi-experiments, there should be reasonable evidence (whether through data or logic) that groups assigned to the experiment are comparable to the remainder groups. Can be combined with instrumental variable approach or regression discontinuity approach | During the 2000 presidential election, some individuals living in non-battleground states but in a media market adjoining a competitive state were accidentally treated with high levels of campaign advertisements. By using the media data and survey data, the study demonstrated a media effect on political persuasion (Huber and Arceneaux, 2007). | Leatherdale, 2019 |
| Causal variable is not randomized. Natural experiments and regression discontinuity design are examples. | When an intervention is attempted in some countries and not others, researchers often lack the ability to ensure that the intervention is conducted similarly across target countries, and it may be difficult to prevent nontargeted countries from employing similar interventions. | Shadish, Cook, and Campbell, 2002 |
| Data are combined into a single dataset, with variables accounting for the outcome, the proposed cause, and the value of the mediating variable. | Perceived terrorist threats result in support for drone strikes, but this process is mediated by the fact that perceived threat induces anger, which results in drone strike support. Where threats do not induce anger, this dynamic is not at play (Fisk et al., 2019). | Hayes, 2009 |
| Data are combined into a single dataset, with variables accounting for the outcome, proposed cause, and the value of the moderating variable. | Cultural differences appear to moderate the extent to which loneliness influences life satisfaction, with relations between the variables stronger in more individualistic cultures than in more collectivist cultures (Goodwin, Cook, and Yung, 2001). | Hayes, 2017 |
Combining datasets enables analysts not only to estimate the value of that smaller population but also to parameterize how that smaller population might relate to other observations in each of the data streams, further increasing precision. Collectively, this sort of small area estimation uses estimates of the structural relationships between different subpopulations to generate estimates for small group values that are more precise than what could be obtained otherwise. In fact, the U.S. Census Bureau relies greatly on this method to publish poverty-related statistics through its Small Area Income and Poverty Estimates (SAIPE) program. Various techniques can be used to this end, including calibration methods (Purcell and Kish, 1979), empirical best linear unbiased prediction (Rao and Molina, 2015), and hierarchical Bayes techniques (Ghosh and Lahiri, 1992).
4.2 Models Across Multiple Contexts
When the goal underlying data integration is to understand how things differ across contexts of geography, time, or population groups, an alternate set of modeling techniques can be helpful. These techniques recognize the similarity of proximal contexts and attempt to model the variability that may occur across those contexts in various ways. When trying to understand how public health policies relate to coronavirus infection rates, for instance, it may be useful to recognize that Iceland’s relatively low infection rates throughout much of the COVID-19 pandemic were likely partially due to its policies, partially to its relatively sparse population, and partially to the limited number of ways that people (and thus the virus) could enter the country. Simply attributing the success to policy may ignore other crucial sources of variance and thereby fail to explain why Luxembourg, which has a similarly sized population and similar restrictions, fared comparatively worse.
Although there are ways to account for temporal and spatial effects in the context of ordinary least squares regression models, more specialized approaches are designed for these sorts of problems. Random effect models can account for the similarities across different contexts in producing estimates (Jackman, 2005). Using tools like ARIMA (autoregressive integrated moving average), time series models can account for cyclical and seasonal processes that otherwise obscure important relations over time. Generalized additive models and other similar techniques allow for smoothed curves linking predictors and outcomes. These can be used to capture time trends or just to deal with situations where assumptions of linearity in relating variables are likely to be violated. Additionally, approaches that employ autocorrelation can capture the effects of temporal or geographical spillovers that might obfuscate the true value of a proposed relationship.
Much has been written about each of these kinds of models and what they can and cannot establish. Part 2 of Table 3D-3 provides a quick overview of the best uses of each of these kinds of models, how to prepare data in order to run each of these models, and references to books or articles that can help practitioners make use of the approaches.
Models that span multiple contexts can often examine in a relatively simple manner whether differing sources of data, rather than differences in the individuals the data are coming from, are partially driving observations. Specific ways to incorporate these considerations depend on the data that are being collected and the modeling strategy employed. In many cases, model coefficients need to include indicators of where the data came from. When researchers are running multiple context models, it is important to consider whether and how to address variabilities across data streams and to recognize the potential for bias where sources of variation are not considered.
4.3 Estimating Causal Relationships
In many cases, the goal of understanding a particular social phenomenon requires evidence of a causal relationship between two measured variables. Generally speaking, causal relationships can be established with evidence that a proposed cause and effect are empirically related, that the cause precedes the effect, and that there are no alternate mechanisms that might result in the correspondence between variables (cf. Shadish, 2010). Evidence that cause-and-effect relations behave in theoretically expected ways can also provide further evidence for causality.
For research focused on identifying causal factors, a number of methodological strategies can be used. The strongest case for a cause-and-effect relationship comes from experimental evidence in studies that randomize individuals or groups of individuals into different conditions. In these cases, differences between conditions constitute a direct test of the effect of the corresponding intervention. In practice, data integration is rarely necessary in the context of true experimental designs, with the sole exception of situations in which outcomes are measured in a different manner from the intervention. More frequently, integration becomes necessary when data collection deviates from the experimental paradigm either because the conditions of an experiment are not fully met (as happens, for example, in a natural or quasi-experiment where randomization was not controlled by the researcher), or because researchers hope to estimate causality where no manipulation was present. Techniques for inferring causality under such circumstances are outlined in Part 3 of Table 3D-3, and some different classes of strategy are discussed in the subsections that follow.
4.3.1 Methods for Ruling Out Alternate Causes
Analysts often hope to increase confidence in a causal relationship by ruling out other potential causal mechanisms as the source of a correlation that has been identified (i.e., by ruling out potential confounds and sources of spuriousness or suppression). For instance, an analyst may find evidence that people who are exposed to a certain message are more likely to hold antigovernment views, but if those people also happen to live in an area that is poorly served by infrastructure or to share membership in a certain ethnic group, these factors, rather than the proposed message itself, might be causally responsible for their antigovernment views. The use of multivariate regressions with control variables can help assuage some concerns about alternate causes because those other variables can be accounted for when estimating a model. By controlling for ethnicity and geographic location, the aforementioned analyst can be more confident of the possibility that messaging is indeed the source of antigovernment sentiment.
Other strategies for isolating the likely impact of a purported cause include statistical matching, which balances out potential confounders in estimating causal effects. Instrumental variable modeling is another approach and uses measures that are known to be related only to the purported causal variable and not to the purported effect on estimating causal relations. By showing that a correlation remains between variables when other explanations of the relationship have been ruled out as potential explanations, the case for causality becomes stronger.
4.3.2 Causal Evidence for Temporal Relationships
Because the order in which things happen is a key component of causality, an argument for causality can be bolstered by showing that relations between variables are time-ordered in a way that comports with the causal claim. Furthermore, evidence that a proposed cause and effect follow closely on the heels of one another can make such a claim stronger. Methods such as regression discontinuity, natural experiments, quasi-experiments, and differences-in-differences provide less control than a true experimental design, but they still establish whether a purported cause follows the purported effect. In each of these cases, evidence of changes in an outcome measure are assessed following a known change in the supposed causal variable. Correlations under these circumstances thus provide evidence of two of the three key components of causality. With these methods, evidence becomes stronger if less time elapses between cause and effect because that means that there are fewer other factors likely to influence the outcome measure.
An example of this sort of evidence might emerge if analysts want to know whether a particular policy change resulted in greater willingness to
protest. Evidence of causality would be stronger if willingness to protest increased shortly after the policy shift. Such a link would also be evidenced if willingness to protest changed across multiple locations after the policy rollout in each of those areas.
4.3.3 Causal Evidence Through Theory Confirmation
Finally, many claims about causal relations include not only an assertion that some cause leads to some effect, but also a theoretical set of mechanisms whereby that link occurs. For instance, there may be an expectation that protests will result in greater support for an insurgency when protests are reported on by media outlets and when protesters are met with repression. Evidence of these sorts of conditional effects (often referred to as mediators and moderators) can bolster a causal claim because observations suggest not only that the key variables are correlated but also that the relation between those variables corresponds with other expectations that are unlikely, absent such a causal process. There are ways to formally test for mediation and moderation that can help confirm causal assertions, though these formal tests (particularly for mediation) often depend on assumptions that are difficult to test (Hayes, 2009).
REFERENCES
Abramson, P.R., and R. Inglehart. 1992. “Generational Replacement and Value Change in Eight West European Societies.” British Journal of Political Science 22(2):183–228.
Albertson, B., and A. Lawrence. 2009. “After the Credits Roll: The Long-Term Effects of Educational Television on Public Knowledge and Attitudes.” American Politics Research 37(2):275–300.
Allison, P.D. 1999. Multiple Regression: A Primer. Thousand Oaks, CA: Pine Forge Press.
Allison, P.D. 2001. Missing Data. Thousand Oaks, CA: Sage Publications.
Allison, P.D. 2003. “Missing Data Techniques for Structural Equation Modeling.” Journal of Abnormal Psychology 112(4):545.
Althaus, S.L. 1998. “Information Effects in Collective Preferences.” American Political Science Review 92(3):545–558.
Alvarez, R.M., L.R. Atkeson, I. Levin, and Y. Li. 2019. “Paying Attention to Inattentive Survey Respondents.” Political Analysis 27(2):145–162.
Angrist, J.D., G.W. Imbens, and D.B. Rubin. 1996. “Identification of Causal Effects Using Instrumental Variables.” Journal of the American Statistical Association 91(434):444–455.
Angrist, J.D., and A.B. Krueger. 2001. “Instrumental Variables and the Search for Identification: From Supply and Demand to Natural Experiments.” Journal of Economic Perspectives 15(4):69–85.
Aquilino, W.S. 1993. “Effects of Spouse Presence during the Interview on Survey Responses Concerning Marriage.” Public Opinion Quarterly 57(3):358–376.
Aronow, P.M., D. Eckles, C. Samii, and S. Zonszein. 2021. “Spillover Effects in Experimental Data.” In Advances in Experimental Political Science edited by J.N. Druckman, 289, Cambridge, United Kingdom: Cambridge University Press.
Bago d’Uva, T., E. Van Doorslaer, M. Lindeboom, and O. O’Donnell. 2008. “Does Reporting Heterogeneity Bias the Measurement of Health Disparities?” Health Economics 17(3):351–375.
Baiocchi, M., J. Cheng, and D.S. Small. 2014. “Instrumental Variable Methods for Causal Inference.” Statistics in Medicine 33(13):2297–2340.
Baker, R., S.J. Blumberg, J.M. Brick, M.P. Couper, M. Courtright, J.M. Dennis, D. Dillman, M.R. Frankel, P. Garland, R.M. Groves, C. Kennedy, J. Krosnick, P.J. Lavrakas, S. Lee, M. Link, L. Piekarski, K. Rao, R.K. Thomas, and D. Zahs. 2010. “Research Synthesis: AAPOR Report on Online Panels.” Public Opinion Quarterly 74(4):711–781.
Bartels, L.M. 1996. “Uninformed Votes: Information Effects in Presidential Elections.” American Journal of Political Science 40(1):194–230.
Berent, M.K., J.A. Krosnick, and A. Lupia. 2016. “Measuring Voter Registration and Turnout in Surveys: Do Official Government Records Yield More Accurate Assessments?” Public Opinion Quarterly 80(3):597–621.
Berk, R.A., and D. Rauma. 1983. “Capitalizing on Nonrandom Assignment to Treatments: A Regression-Discontinuity Evaluation of a Crime-Control Program.” Journal of the American Statistical Association 78(381):21–27.
Campbell, D.T., and D.W Fiske. 1959. “Convergent and Discriminant Validation by the Multitrait-Multimethod Matrix.” Psychological Bulletin 56(2):81.
Chandler, J., I. Sisso, and D. Shapiro. 2020. “Participant Carelessness and Fraud: Consequences for Clinical Research and Potential Solutions.” Journal of Abnormal Psychology 129(1):49.
Chen, C., S.Y. Lee, and H.W. Stevenson. 1995. “Response Style and Cross-Cultural Comparisons of Rating Scales among East Asian and North American Students.” Psychological Science 6(3):170–175.
Constantin, A. 2018. “Human Subject Research: International and Regional Human Rights Standards.” Health and Human Rights 20(2):137.
Cotter, P.R., J. Cohen, and P.B. Coulter. 1982. “Race-of-Interviewer Effects in Telephone Interviews.” Public Opinion Quarterly 46(2):278–284.
Cresci, S. 2020. “A Decade of Social Bot Detection.” Communications of the ACM 63(10):72–83.
Cronbach, L.J. 1951. “Coefficient Alpha and the Internal Structure of Tests.” Psychometrika 16(3):297–334.
Das, M., V. Toepoel, and A. van Soest. 2011. “Nonparametric Tests of Panel Conditioning and Attrition Bias in Panel Surveys.” Sociological Methods & Research 40(1):32–56.
Davis, D.W. 1997. “Nonrandom Measurement Error and Race of Interviewer Effects among African Americans.” The Public Opinion Quarterly 61(1):183–207.
Davis, R.E., T.P. Johnson, S. Lee, and C. Werner. 2019. “Why Do Latino Survey Respondents Acquiesce? Respondent and Interviewer Characteristics As Determinants of Cultural Patterns of Acquiescence among Latino Survey Respondents.” Cross Cultural Research 53(1):87–115.
De Leeuw, E.D., and J.J. Hox. 2014. “Survey Mode and Mode Effects.” In Improving Survey Methods edited by U. Engel, B. Jann, P. Lynn, A. Scherpenzeel, and P. Sturgis, 44–56. Abingdon-on-Thames, United Kingdom: Routledge.
Dehejia, R.H., and S. Wahba. 2002. “Propensity Score-Matching Methods for Nonexperimental Causal Studies.” Review of Economics and Statistics 84(1):151–161.
Dennis, J.M. 2001. “Are Internet Panels Creating Professional Respondents?” Marketing Research 13(2):34–38.
DerSimonian, R., and R. Kacker. 2007. “Random-Effects Model for Meta-Analysis of Clinical Trials: An Update.” Contemporary Clinical Trials 28(2):105–114.
Diener, E., R.A. Emmons, R.J. Larsen, and S. Griffin. 1985. “The Satisfaction with Life Scale.” Journal of Personality Assessment 49(1):71–75.
Diop, K., T. Le, and M. Traugott. 2015. “Third-Party Presence Effect with Propensity Score Matching.” Journal of Survey Statistics and Methodology 3(2):193–215.
Dubin, R.A. 1998. “Spatial Autocorrelation: A Primer.” Journal of Housing Economics 7(4):304–327.
Dunteman, G.H. 1989. Principal Components Analysis (Quantitative Applications in the Social Sciences, vol. 69). Thousand Oaks, CA: Sage Publications.
Elliott, M.R., and R. Valliant. 2017. “Inference for Nonprobability Samples.” Statistical Science 32(2):249–264.
Embretson, S.E., and S.P. Reise. 2013. Item Response Theory. East Sussex, United Kingdom: Psychology Press.
Ennis, S.R., S.R. Porter, J.M. Noon, and E. Zapata. 2015. “When Race and Hispanic Origin Reporting Are Discrepant Across Administrative Records and Third Party Sources: Exploring Methods to Assign Responses.” Working paper, Center for Economic Studies, Washington, DC. https://www.census.gov/content/dam/Census/library/workingpapers/2015/adrm/carra-wp-2015-08.pdf.
Fishkin, J.S., and R.C. Luskin. 2005. “Experimenting with a Democratic Ideal: Deliberative Polling and Public Opinion.” Acta Politica 40(3):284–298.
Fisk, K., J.L. Merolla, and J.M. Ramos. 2019. “Emotions, Terrorist Threat, and Drones: Anger Drives Support for Drone Strikes.” Journal of Conflict Resolution 63(4):976–1000.
Fowler, F.J. 1995. Improving Survey Questions: Design and Evaluation (Applied Social Research Methods, vol. 38). Thousand Oaks, CA: Sage Publications.
Freelon, D. 2018. “Inferring Individual-Level Characteristics from Digital Trace Data: Issues and Recommendations.” In Digital Discussions edited by N.J. Stroud and N.C. Mc-Gregor, 96–110, Abingdon-on-Thames, United Kingdom: Routledge.
Ghosh, M., and P. Lahiri. 1992. “A Hierarchical Bayes Approach to Small Area Estimation with Auxiliary Information.” In Bayesian Analysis in Statistics and Econometrics edited by P.K. Goel and I.S. Iyengar, 107–125. New York: Springer.
Goldstein, H. 2004. “International Comparisons of Student Attainment: Some Issues Arising from the PISA Study.” Assessment in Education: Principles, Policy, and Practice 11(3):319–330.
González, A., and P.G. Zimbardo. 1985. “Time in Perspective: A Psychology Today Survey Report.” Psychology Today 19:21–26.
Goodenough, W.H. 1971. Culture, Language, and Society (McCaleb Module in Anthropology). Reading, MA: Addison-Wesley.
Goodwin, R., O. Cook, and Y. Yung. 2001. “Loneliness and Life Satisfaction among Three Cultural Groups.” Personal Relationships 8(2):225–230.
Graefe, A. 2021. “Embrace the Differences: Revisiting the PollyVote Method of Combining Forecasts for U.S. Presidential Elections (2004 to 2020).” International Journal of Forecasting (online). https://doi.org/10.1016/j.ijforecast.2021.09.010.
Grant, N., J. Wardle, and A. Steptoe. 2009. “The Relationship between Life Satisfaction and Health Behavior: A Cross-Cultural Analysis of Young Adults.” International Journal of Behavioral Medicine 16(3):259–268.
Greenland, S. 2000. “Principles of Multilevel Modeling.” International Journal of Epidemiology 29(1):158–167.
Groves, R.M. 2005. Survey Errors and Survey Costs (Wiley Series in Survey Methodology, vol. 581). Hoboken, NJ: John Wiley & Sons.
Groves, R.M., S. Presser, R. Tourangeau, B.T. West, M.P. Couper, E. Singer, and C. Toppe. 2012. “Support for the Survey Sponsor and Nonresponse Bias.” Public Opinion Quarterly 76(3):512–524.
Hamilton, J. D. 2020. Time Series Analysis. Princeton, NJ: Princeton University Press.
Harkness, J.A. 2008. “Comparative Survey Research: Goals and Challenges.” In International Handbook of Survey Methodology, 1st edition, edited by E. de Leeuw, J.J. Hox, and D.A. Dillman, 56–77, Abingdon-on-Thames, United Kingdom: Routledge.
Harkness, J., and A. Schoua-Glusberg. 1998. “Questionnaires in Translation.” In Cross-Cultural Survey Equivalence edited by J. Harkness, 87–126. Mannheim, Germany: Zentrum für Umfragen, Methoden, und Analysen.
Harman, H.H. 1976. Modern Factor Analysis. Chicago: University of Chicago Press.
Havard, S., S. Deguen, D. Zmirou-Navier, C. Schillinger, and D. Bard. 2009. “Traffic-Related Air Pollution and Socioeconomic Status: A Spatial Autocorrelation Study to Assess Environmental Equity on a Small-Area Scale.” Epidemiology 20(3):223–230.
Hayes, A.F. 2006. “A Primer on Multilevel Modeling.” Human Communication Research 32(4):385–410.
Hayes, A.F. 2009. “Beyond Baron and Kenny: Statistical Mediation Analysis in the New Millennium.” Communication Monographs 76(4):408–420.
Hayes, A.F. 2017. Introduction to Mediation, Moderation, and Conditional Process Analysis: A Regression-Based Approach. New York: Guilford Publications.
Hill, K. 2012. “How Target Figured Out A Teen Girl Was Pregnant Before Her Father Did.” Forbes, February 16, 2012. https://www.forbes.com/sites/kashmirhill/2012/02/16/howtarget-figured-out-a-teen-girl-was-pregnant-before-her-father-did/?sh=3a107edd6668.
Hill, S.C., K.T. Solomon, J.C. Maclean, and M.F. Pesko. 2019. “Effects of Improvements in the CPS on the Estimated Prevalence of Medical Financial Burdens.” Health Services Research 54(4):920–929.
Hillmer, S.C., and G.C. Tiao. 1982. “An ARIMA-Model-Based Approach to Seasonal Adjustment.” Journal of the American Statistical Association 77(377):63–70.
Hong, Y. 2009. “A Dynamic Constructivist Approach to Culture: Moving from Describing Culture to Explaining Culture.” In Understanding Culture: Theory, Research, and Application edited by R.S. Wyer, C. Chiu, and Y. Hong, 3–24. New York: Psychology Press.
Hsiao, C. 2014. Analysis of Panel Data. Cambridge, United Kingdom: Cambridge University Press.
Huber, G.A., and K. Arceneaux. 2007. “Identifying the Persuasive Effects of Presidential Advertising.” American Journal of Political Science 51(4):957–977.
Idler, E.L., and Y. Benyamini. 1997. Self-Rated Health and Mortality: A Review of Twenty-Seven Community Studies.” Journal of Health and Social Behavior 38(1):21–37.
Imbens, G.W., and T. Lemieux. 2008. “Regression Discontinuity Designs: A Guide to Practice.” Journal of Econometrics 142(2):615–635.
Ilyas, I.F., and X. Chu. 2019. Data Cleaning. San Rafael, CA: Morgan & Claypool.
Jackman, S. 2005. “Pooling the Polls over an Election Campaign.” Australian Journal of Political Science 40(4):499–517.
Jackson, P.H., and C.C. Agunwamba. 1977. “Lower Bounds for the Reliability of the Total Score on a Test Composed of Nonhomogeneous Items. I: Algebraic Lower Bounds.” Psychometrika 42(4):567–578.
Kalinin, K. 2016. “The Social Desirability Bias in Autocrat’s Electoral Ratings: Evidence from the 2012 Russian Presidential Elections.” Journal of Elections, Public Opinion, and Parties 26(2):191–211.
Kalton, G., and D. Kasprzyk. 1986. “The Treatment of Missing Survey Data.” Survey Methodology 12:1–16.
Kathuria, A., A. Gupta, and R.K. Singla. 2021. “A Review of Tools and Techniques for Preprocessing of Textual Data.” Computational Methods and Data Engineering, 1227: 407–422.
Kennedy, C., M. Blumenthal, S. Clement, J.D. Clinton, C. Durand, C. Franklin, K. McGeeney, L. Miringoff, K.M. Olson, D. Rivers, L. Saad, G.E. Witt, and C. Wlezien. 2018. “An Evaluation of the 2016 Election Polls in the United States.” Public Opinion Quarterly 82(1):1–33.
Kim, S., C.A. Sugar, and T.R. Belin. 2015. “Evaluating Model Based Imputation Methods for Missing Covariates in Regression Models with Interactions.” Statistics in Medicine 34(11):1876–1888.
King, G., J. Honaker, A. Joseph, and K. Scheve. 2001. “Analyzing Incomplete Political Science Data: An Alternative Algorithm for Multiple Imputation.” American Political Science Review 95(1):49–69.
Kluckhohn, F.R. and F.L. Strodtbeck 1961. Variations in Value Orientations. Evanston, IL: Row, Peterson.
Krebs, V. 2002. “Uncloaking Terrorist Networks.” First Monday 7(4). https://firstmonday.org/ojs/index.php/fm/article/view/941/863.
Krumpal, I. 2013. “Determinants of Social Desirability Bias in Sensitive Surveys: A Literature Review.” Quality & Quantity 47(4):2025–2047.
Kung, F.Y., N. Kwok, and D.J. Brown. 2018. “Are Attention Check Questions a Threat to Scale Validity? Applied Psychology 67(2):264–283.
Leatherdale, S.T. 2019. “Natural Experiment Methodology for Research: A Review of How Different Methods Can Support Real-World Research.” International Journal of Social Research Methodology 22(1):19–35.
Lebo, M.J., and C. Weber. 2015. “An Effective Approach to the Repeated Cross-Sectional Design.” American Journal of Political Science 59(1):242–258.
Lechner, M. 1999. “Earnings and Employment Effects of Continuous Off-the-Job Training in East Germany after Unification.” Journal of Business & Economic Statistics 17(1):74–90.
Lee, S., and R. Valliant. 2009. “Estimation for Volunteer Panel Web Surveys Using Propensity Score Adjustment and Calibration Adjustment.” Sociological Methods Research 37:319–343.
Lee, S., and N. Schwarz. 2014. “Question Context and Priming Meaning of Health: Effect on Differences in Self-Rated Health between Hispanics and Non-Hispanic Whites.” American Journal of Public Health 104(1):179–185.
Lee, S., H.A. Nguyen, and J. Tsui. 2011. “Interview Language: A Proxy Measure for Acculturation among Asian Americans in a Population-Based Survey.” Journal of Immigrant and Minority Health 13:244–252.
Lee, S., N. Schwarz, and L.S. Goldstein. 2014. Culture-Sensitive Question Order Effects of Self-Rated Health between Older Hispanic and Non-Hispanic Adults in the United States.” Journal of Aging and Health 26:860–883.
Lee, S., M. Liu, and M. Hu. 2017. “Relationship between Future Time Orientation and Item Nonresponse on Subjective Probability Questions: A Cross-Cultural Analysis.” Journal of Cross-Cultural Psychology 48(5):698–717.
Lee, S., F. Alvarado-Leiton, E. Vasquez, and R.E. Davis. 2019. “Impact of the Terms ‘Regular’ or ‘Pasable’ as Spanish Translation for ‘Fair’ of the Self-Rated Health Question among U.S. Latinos: A Randomized Experiment.” American Journal of Public Health 109(12):1789–1796.
Lee, S., E. Vasquez, L. Ryan, and J. Smith. 2020. “Measurement Equivalence of Subjective Well-Being Scales under the Presence of Acquiescent Response Style for the Racially and Ethnically Diverse Older Population in the United States.” Survey Research Methods 14(4):417–437.
Levine, R. 1997. A Geography of Time. New York: Basic Books.
Little, R.J. 1988. “Missing-Data Adjustments in Large Surveys.” Journal of Business & Economic Statistics 6(3):287–296.
Little, R.J.A., and D.B. Rubin. 2019. Statistical Analysis with Missing Data, 3rd edition. New York: John Wiley.
Liu, M., S. Lee, and F.G. Conrad. 2015. “Comparing Extreme Response Styles between Agree-Disagree and Item-Specific Scales.” Public Opinion Quarterly 79(4):952–975.
Lohr, S., and J.K. Rao. 2006. “Estimation in Multiple-Frame Surveys.” Journal of the American Statistical Association 101(475):1019–1030.
Lopez, J., and D.S. Hillygus. 2018. “Why So Serious?: Survey Trolls and Misinformation.” Academic paper, Duke University, Durham, NC. https://papers.ssrn.com/sol3/papers.cfm?abstract_id=3131087.
MacKinnon, D.P., A.J. Fairchild, and M.S. Fritz. 2007. “Mediation Analysis.” Annual Review of Psychology 58:593–614.
Marian, V., and M. Kaushanskaya. 2004. “Self-Construal and Emotion in Bicultural Bilinguals.” Journal of Memory and Language 51:190–201.
McGee, D.L., Y. Liao, G. Cao, and R.S.Cooper, 1999. “Self-Reported Health Status and Mortality in a Multiethnic U.S. Cohort.” American Journal of Epidemiology 149(1):41–46.
Medalia, C., B. O’Hara, and J.C. Smith. 2016. “How Did the Questionnaire Change in the CPS ASEC Affect Health Insurance Estimates?” Conference paper, Federal Committee on Statistical Methodology meeting, December 3, 2015, Washington, DC.
Messick, S. 1989. “Meaning and Values in Test Validation: The Science and Ethics of Assessment.” Educational Researcher 18(2):5–11.
Mill, J.S. 1898. A System of Logic, Ratiocinative, and Inductive: Being a Connected View of the Principles of Evidence and the Methods of Scientific Investigation. London: Long-mans, Green, and Company.
Mneimneh, Z.M., R. Tourangeau, B.E. Pennell, S.G. Heeringa, and M.R. Elliott. 2015. Cultural Variations in the Effect of Interview Privacy and the Need for Social Conformity on Reporting Sensitive Information.” Journal of Official Statistics 31(4):673.
Mneimneh, Z., J. Pasek, L. Singh, R. Best, L. Bode, E. Bruch, C. Budak, P. Davis-Kean, K. Donato, N. Ellison, A. Gelman, E. Groshen, L. Hemphill, W. Hobbs, B. Jensen, G. Karypis, J. Ladd, A. O’Hara, T. Raghunathan, P. Resnik, R. Ryan, S. Soroka, M. Traugott, B.T. West, and S. Wojcik. 2021. “Data Acquisition, Sampling, and Data Preparation Considerations for Quantitative Social Science Research Using Social Media Data.” Ann Arbor, MI and Washington, DC: University of Michigan and Georgetown University. https://www.researchgate.net/publication/350120161_Data_Acquisition_Sampling_and_Data_Preparation_Considerations_for_Quantitative_Social_Science_Research_Using_Social_Media_Data.
Myers, T.A. 2011. “Goodbye, Listwise Deletion: Presenting Hot Deck Imputation As an Easy and Effective Tool for Handling Missing Data.” Communication Methods and Measures 5(4):297–310.
Nisbett, R.E., K. Peng, I. Choi, and A. Norenzayan. 2001. “Culture and Systems of Thought: Holistic Versus Analytic Cognition.” Psychological Review 108:291–310.
Pascale, J., M. Boudreaux, and R. King. 2016. “Understanding the New Current Population Survey Health Insurance Questions.” Health Services Research 51(1):240–261.
Pasek, J. 2015. “Predicting Elections: Considering Tools to Pool the Polls.” Public Opinion Quarterly 79(2):594–619.
Pasek, J., and J.A. Krosnick. 2010. “Optimizing Survey Questionnaire Design in Political Science.” In The Oxford Handbook of American Elections and Political Behavior edited by J.E. Leighley. https://www.oxfordhandbooks.com/view/10.1093/oxfordhb/9780199235476.001.0001/oxfordhb-9780199235476.
Pasek, J., S.M. Jang, C.L. Cobb III, J.M. Dennis, and C. DiSogra. 2014. “Can Marketing Data Aid Survey Research? Examining Accuracy and Completeness in Consumer-File Data.” Public Opinion Quarterly 78(4):889–916.
Pasek, J., C.A. McClain, F. Newport, and S. Marken. 2020. “Who’s Tweeting about the President? What Big Survey Data Can Tell Us about Digital Traces?” Social Science Computer Review 38(5):633–650.
Peytchev, A. 2012. “Multiple Imputation for Unit Nonresponse and Measurement Error.” Public Opinion Quarterly 76(2):214–237.
Purcell, N.J., and L. Kish. 1979. “Estimation for Small Domains.” Biometrics 35(48):3–18.
Rao, J.N., and I. Molina. 2015. Small Area Estimation. Hoboken, NJ: John Wiley & Sons.
Renschler, I. and B. Kleiner. 2013. “Considering Dialect in Survey Research.” Bulletin of Sociological Methodology/Bulletin de Méthodologie Sociologique 118(1):51–59.
Robins, J.M., M.A. Hernan, and B. Brumback. 2000. “Marginal Structural Models and Causal Inference in Epidemiology.” Epidemiology 11(5):550–560.
Ross, C.K., C.A. Steward, and J.M. Sinacore. 1995. “A Comparative Study of Seven Measures of Patient Satisfaction.” Medical Care 33:392–406.
Ross, M., W.Q.E. Xun, and A.E. Wilson. 2002. “Language and the Bicultural Self.” Personality and Social Psychology Bulletin 28:1040–1050.
Rubin, D.B. 1973. “Matching to Remove Bias in Observational Studies.” Biometrics 29:159–183.
Rubin, D.B. 1987. Multiple Imputation for Nonresponse in Surveys. Hoboken, NJ: John Wiley & Sons.
Samet, J.M., and A. Muñoz. 1998. “Evolution of the Cohort Study.” Epidemiologic Reviews 20(1):1–14.
Saris, W.E., M. Revilla, J.A. Krosnick, and E.M. Shaeffer. 2010. “Comparing Questions with Agree/Disagree Response Options to Questions with Item-Specific Response Options.” Survey Research Methods 4:61–79.
Savoia, E., R. Piltch-Loeb, B. Goldberg, C. Miller-Idriss, B. Hughes, A. Montrond, J. Kayyem, and M.A. Testa. 2021. “Predictors of COVID-19 Vaccine Hesitancy: Socio-Demographics, Comorbidity, and Past Experience of Racial Discrimination.” Vaccines 9(7):767.
Scheuch, E.K. 1968. “The Cross-Cultural Use of Sample Surveys: Problems of Comparability.” In Comparative Research across Cultures and Nations edited by S. Rokkan, 176–209. The Hague, The Netherlands: Mouton.
Schober, M.F., J. Pasek, L. Guggenheim, C. Lampe, and F.G. Conrad. 2016. “Social Media Analyses for Social Measurement.” Public Opinion Quarterly 80(1):180–211.
Schuman, H., and J.M. Converse. 1971. “The Effects of Black and White Interviewers on Black Responses in 1968.” Public Opinion Quarterly 35(1):44–68.
Schuman, H., and S. Presser. 1996. Questions and Answers in Attitude Surveys: Experiments on Question Form, Wording, and Context. Thousand Oaks, CA: Sage Publications.
Schwarz, N. 2007. “Cognitive Aspects of Survey Methodology.” Applied Cognitive Psychology 21:277–287.
Shadish, W.R. 2010. “Campbell and Rubin: A Primer and Comparison of Their Approaches to Causal Inference in Field Settings.” Psychological Methods 15(1):3.
Shadish, W., T.D. Cook, and D.T. Campbell. 2002. Experimental and Quasi-Experimental Designs for Generalized Causal Inference. Boston: Houghton Mifflin.
Sherman, A. 2020. “No, a Dead Voter Named William Bradley Didn’t Vote in Detroit.” Politifact, November 5. https://www.politifact.com/factchecks/2020/nov/05/facebook-posts/no-dead-voter-named-william-bradley-didnt-vote-det/.
Sijtsma, K. 2009. “On the Use, the Misuse, and the Very Limited Usefulness of Cronbach’s Alpha.” Psychometrika 74(1):107–120.
Singh, L., M. Traugott, L. Bode, C. Budak, P.E. Davis-Kean, R. Guha, J. Ladd, Z. Mneimneh, Q. Nguyen, J. Pasek, T. Raghunathan, R. Ryan, S. Soroka, and L. Wahedi. 2020. “Data Blending: Haven’t We Been Doing This for Years?” Working paper, Massive Data Institute, Washington, DC. https://www.jonathanmladd.com/uploads/5/3/6/6/5366295/mdi_data_blending_white_paper_-_april2020.pdf.
Thistlethwaite, D.L., and D.T. Campbell. 1960. “Regression-Discontinuity Analysis: An Alternative to the Ex Post Facto Experiment.” Journal of Educational Psychology 51(6):309.
Valliant, R., J.A. Dever, F. Kreuter. 2019. Practical Tools for Designing and Weighting Survey Samples (Statistics for Social and Behavioral Sciences, vol. 2). New York: Springer.
Van Vaerenbergh, Y., and T.D. Thomas, 2013. “Response Styles in Survey Research: A Literature Review of Antecedents, Consequences, and Remedies.” International Journal of Public Opinion Research 25(2):195–217.
Wang, W., D. Rothschild, S. Goel, and A. Gelman. 2015. “Forecasting Elections with Nonrepresentative Polls.” International Journal of Forecasting 31(3):980–991.
Warren, J.R., and A. Halpern-Manners. 2012. “Panel Conditioning in Longitudinal Social Science Surveys.” Sociological Methods & Research 41(4):491–534.
Weisberg, H.F. 2009. The Total Survey Error Approach. Chicago: University of Chicago Press.
Wilcox, C., L. Sigelman, and E. Cook. 1989. “Some Like It Hot: Individual Differences in Responses to Group Feeling Thermometers.” Public Opinion Quarterly 53(2):246–257.
Wood, S.N. 2017. Generalized Additive Models: An Introduction with R. Boca Raton, FL: CRC Press.


