Measurement and Analysis of Public Opinion: An Analytic Framework (2022)
Chapter: Synthesis: Using Public Opinion Research to Answer an Intelligence Question - Rona Briere
Synthesis
Using Public Opinion Research to Answer an Intelligence Question
KEY MESSAGES
CROSS-CUTTING THEMES
- The analysis of public opinion data will never be perfect, and barriers to valid inference can seem numerous and daunting. However, it is important not to let the best be the enemy of the good. Over successive analyses, analysts can work on describing their degree of uncertainty and on learning new techniques for reducing uncertainty, remaining transparent about the limitations of the analyses in the meantime. The goal is to improve the quality of analyses over the long term, not to perfect any one analysis in the short term.
- When drawing an inference about a population’s attitudes from data, it is essential to ensure the use of appropriate sampling, measurement, and inferential techniques.
- Public opinion data are not without flaws. Attitudes can be “slippery” and complex to measure, and some surveys lack credibility or technical soundness. Yet despite these challenges, public opinion data are critical for intelligence analysis because they illuminate relevant attitudes and behaviors. Researchers have several tools with which to harness the analytic power of public opinion data despite the data’s shortcomings, including (a) exercising care in the design and interpretation of attitude data, (b) adjusting inferences to convey likely bias and uncertainty, (c) using alternative data
- sources other than national probability samples, and (d) combining insights from different data sources (triangulation).
DRAWING INFERENCES FROM PUBLIC OPINION SURVEYS (RENÉ BAUTISTA)
- When assessing the credibility of a survey, the analyst should examine both background or contextual information, including the survey purpose, authenticity, integrity, sponsor, personnel, and reporting and dissemination; and technical information, including the nature of the sample (how it was taken and its coverage) and the nature of the measures (nonresponse and questionnaire design).
- The analyst should consider multiple factors when determining how much confidence to place in a survey’s results. Survey features warranting greater confidence include a reputable, trustworthy sponsor; use of a probability-based approach; a sample drawn from a database or frame comprising nearly the entire target population; interviewing done at least partially offline (unless the country’s internet penetration is greater than 90 percent); clear, nonleading questions; the availability of corollary information on nonresponse rates, order and exact wording of questions, and mode of study; and data that are weighted. Features warranting lower confidence include an unknown or untrustworthy sponsor, data collected in 48 hours or less, biased questions, online opt-in data collection, and unweighted data.
- Intelligence analysts often must try to draw value from imperfect data—data of variable quality or data that are ill suited to the question they are addressing. In these situations, analysts should seek to understand the credibility and soundness of the data—a process that can benefit from use of a structured rating system—and adjust their inferences accordingly to account for bias and uncertainty.
- The validity of inferences drawn from survey data can depend as much on how a survey was conducted as on how one analyzes the data. Accordingly, the designers and implementers of surveys should partner with analysts to ensure quality analysis downstream.
ALTERNATIVES TO PROBABILITY-BASED GENERAL POPULATION SURVEYS FOR MEASURING ATTITUDES (ASHLEY AMAYA)
- National simple random sample surveys may not be the best option for addressing some research objectives. Potential alternatives include complex sample surveys; nonprobability surveys; qualitative
- research; or found data, such as social media. All of these methods have both strengths and weaknesses.
- Researchers must evaluate their priorities and needs when identifying the type of data best suited to meeting them. There is no one-size-fits-all data source, and all sources will have error.
ASCERTAINING TRUE ATTITUDES IN SURVEY RESEARCH (KANISHA BOND)
- In analyzing survey data, the analyst should consider not just whether respondents might be giving untruthful responses, but also why. Sometimes, untruthful responding reflects fairly innocuous and universal tendencies, such as cognitive limits on one’s ability to express complex motivations and preferences. At other times, respondents are trying to preserve their physical or psychological safety by withholding sensitive information. The ethical risks of eliciting honest answers are higher in the second scenario than in the first.
- In survey design, administration, and analysis, ethical and technical/quality issues are intertwined. Ethical violations can, for example, compromise quality by affecting the answers provided by respondents such that they do not reflect true attitudes. Therefore, the analyst needs to consider the ethical aspects of a survey dataset before deciding whether it should be used to inform the analysis.
INTEGRATING DATA ACROSS SOURCES (JOSH PASEK AND SUNGHEE LEE)
- Data integration—defined as the use of multiple data sources to increase the precision of and confidence in the data and inferences drawn from them—is a means for analysts to determine the appropriate level of confidence in a given assessment. Analysts can employ data integration to assess the robustness of a point estimate, to make comparisons over time, to consider relationships among variables contained in different datasets, and to improve the capacity to draw causal inferences from analyses of correlational data. Before carrying out data integration, analysts need to understand the nature of the data (e.g., micro versus macro, potential sources of survey and measurement error, and ethical considerations), as well as harmonize the data to ensure their capacity for integration and comparison.
- A range of techniques are available for integrating and analyzing multiple data streams.
INTRODUCTION
Purpose and Scope of This Synthesis
The purpose of this synthesis is to serve as a tool for the Intelligence Community (IC) analyst seeking to apply data from public opinion research to answer an intelligence question—whether self-generated or posed by a policy maker—by reviewing the various methods used to collect such data; detailing their advantages, best uses, and limitations; and providing guidance on how to correct or compensate for potential errors in the datasets they generate. The synthesis lays out the general steps of such an analysis and then focuses on:
- How the analyst can check the available datasets relevant to the question at hand both for quality and for ethical data collection methods;
- What the analyst can do given that all of the available datasets can be expected to be limited in some way(s); and
- How the analyst can understand the extent to which the data ultimately utilized reflect the true attitudes of those from whom the data were collected.
This synthesis is targeted primarily to the analyst with expertise in a particular area or country, but not necessarily in public opinion research methods. Analysts interested in greater technical detail on the methods discussed here can find it in the respective white papers on which this synthesis is based.
Organization of This Synthesis
This synthesis brings together four white papers written by academic experts in public opinion research:
- “Drawing Inferences from Public Opinion Surveys: Insights for Intelligence Reports,” René Bautista, NORC at the University of Chicago
- “Alternatives to Probability-Based Surveys Representative of the General Population for Measuring Attitudes,” Ashley Amaya, Pew Research Center
- “Integrating Data Across Sources,” Josh Pasek and Sunghee Lee, University of Michigan
- “Ascertaining True Attitudes in Survey Research,” Kanisha D. Bond, Binghamton University (SUNY)
The first section below provides an overview of the sequence of steps an analyst would typically follow in applying data collected through public opinion research to answer an intelligence question. This overview starts with a graphic (Figure S-1) depicting the flow of those steps, the decisions that need to be made along the way, and the factors to be considered in making those decisions. A narrative description of this graphic follows. Embedded in brackets within the graphic are indicators for a set of notes that are included in the narrative. Also embedded in the graphic in parentheses and the narrative description of the graphic are the last names of the authors whose papers are relevant at each point in the analytic process. Following this overview are summaries of the four white papers.
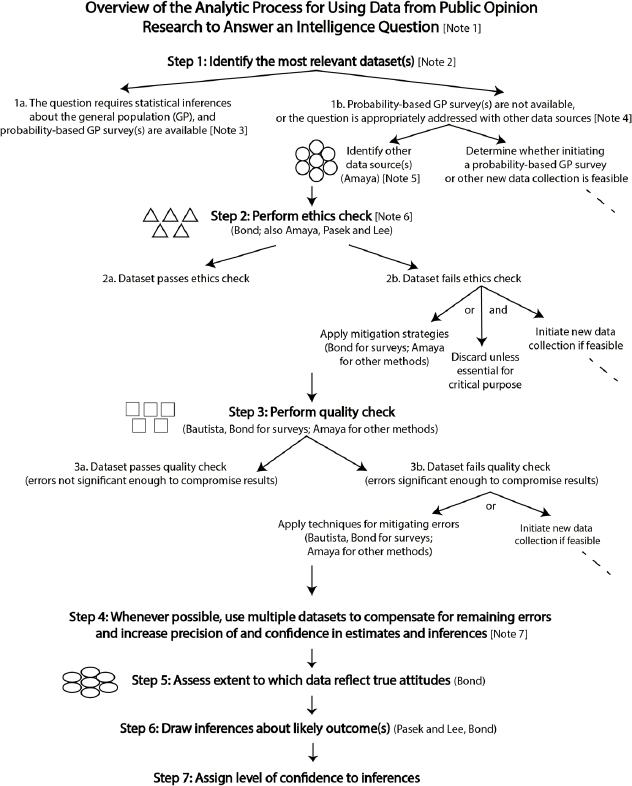
APPLYING DATA FROM PUBLIC OPINION RESEARCH: OVERVIEW
[Note 1]: This overview graphic is a conceptual, simplified depiction of the analytic process for using public opinion research data to answer an intelligence question. It must be emphasized that each of the elements of the analytic process depicted in this graphic is complex in its own right, and that complexity grows exponentially when the elements are arranged so as to conceptualize the overall process. Moreover, countless variations are introduced in real-world applications of the process. This synthesis highlights some of the most important of these variations, but the analyst should keep in mind that the analytic process as presented here makes no claim to covering all of these permutations.
It should be emphasized as well that the process depicted in this graphic does not take place in a vacuum. In practice, public opinion data will be considered together with other intelligence in addressing the question of interest.
Finally, note that this synthesis focuses on steps 2 through 6 of this conceptual process. It does not cover step 1, identifying a list of data sources most relevant to the question at hand, or step 7, assigning a level of confidence to the inferences drawn from the datasets selected for use, nor does it address the process of initiating a new data collection. In addition, with respect to step 6, drawing inferences about likely outcome(s), this synthesis and the white papers on which it is based focus on the extent to which public opinion data can support drawing such inferences, not on the actual process of doing so, on the assumption that the analyst does not need to be told how to do analysis.
Step 1: Identify the Most Relevant Dataset(s)
In step 1 of this conceptual analytic process, the analyst identifies those dataset(s) most relevant to the question at hand.
[Note 2]: Relevance is a function primarily of whether the dataset addresses the question. But it is also based on other factors, such as geography, population/subpopulation, and time period.
[Note 3]: If the question calls for drawing quantitative, statistical inferences about the general population, the analyst looks first for relevant data from probability-based surveys in which the sample to be surveyed is selected randomly from the general population on the basis of probability theory.
[Note 4]: Such surveys may not be available, however, and if statistical inferences about the general population are not required, may not be ap-
propriate. Other types of surveys exist as well (as detailed by Amaya), and while not useful for drawing quantitative inferences about the general population, can be useful for other purposes. An example is probability-based surveys not employing a random sample of the general population, which are useful when a survey of the general population is too costly, when a complete sample frame of the general population is not available, when the objective is to compare subgroups, or when the question to be answered focuses on a single subpopulation. Other data sources, such as those based on qualitative methods, may be appropriate to the question at hand as well. Alternatives to probability-based surveys of the general population are indicated by the circles on the graphic (and detailed by Amaya).
[Note 5]: Purposes for which these other sources may be useful include, for example, obtaining qualitative information about people’s attitudes, information about a population subgroup (especially one that is hard to reach or rare) or area of a country, and information about changes over time, as well as providing a means of triangulating survey or other data to increase confidence in those data and the inferences drawn from them (see step 4 below). In some cases, moreover, the analyst may wish to begin the analytic process with multiple datasets from various sources to, for example, answer a question for which data from multiple geographic areas, from multiple populations, or at multiple levels of granularity are relevant.
It must be emphasized that, although probability-based surveys of the general population on average have less error than other methods, no public opinion data collection method—and hence no public opinion dataset—is without error. Errors may be due to limitations inherent in the data collection method itself or introduced in its implementation. The inevitable presence of flaws in a dataset does not, however, render the data useless. Rather, the analyst should be aware of the potential limitations of each public opinion data collection method and the techniques that can be used to remedy them, as detailed in the white papers and summarized in this synthesis (see steps 3 and 4).
Step 2: Perform Ethics Check
[Note 6]: The collection and use of data require adherence to ethical guidelines. Ethical guidelines are important because unethical research can produce poor analysis in the short term, as well as have longer-term consequences for the reputation of both the U.S. government and the larger research community. These guidelines encompass the deployment of data collection methods and the treatment of research participants.
In general, the analyst should aspire to adhere to a “do no harm” principle in relation to the participants involved in the research, their
larger community, U.S. policy objectives, and the scholarly community. There should be transparency in how the data were collected, who paid for the data, who collected the data, what measures were included, how the sample was generated, how many people participated, how and when the data were collected, how the data were analyzed, and where the data can be found (unless there is a rationale for restricting their use). Lack of any of this information runs counter to the American Association for Public Opinion Research’s (AAPOR’s) Code of Professional Ethics and Practices.1 More important is that any data collection should be designed to ensure that it does not endanger research participants, confidentiality is preserved (unless consent is provided otherwise), and prospective consent is obtained. Public opinion data may often be drawn from sources that were not subject to institutional review board (IRB) review (e.g., sources using social network data), but when a source was subject to IRB review, the analyst should verify documentation of the IRB ruling.
Factors to be considered in the ethics check are indicated by the triangles on the graphic (and detailed by Bond, discussed more generally by Amaya, and laid out by Pasek and Lee for use of multiple datasets). In some cases, it may be possible to mitigate ethical flaws. In the vast majority of cases in which such mitigation is not possible, the dataset should be discarded, and if feasible, a new data collection can be initiated.
Step 3: Perform Quality Check
Step 3 is a quality check aimed at identifying the limitations of and errors in the dataset(s) selected for use. The analyst needs to consider a wide range of factors—both contextual (e.g., the purpose, authenticity, and integrity of the data collection) and technical (e.g., errors of sampling and measurement)—indicated by the squares on the graphic (and detailed by Bautista, Bond, and Amaya for surveys and by Amaya for other methods).
As noted above, no dataset is without errors. In some cases, errors will not be significant enough to compromise the value of the data, in which case the process proceeds directly to step 4. When errors are significant enough to compromise the value of the data, techniques for mitigating those errors can be applied (see Bautista for surveys; Amaya for other methods), or if feasible, a new data collection can be initiated. The process will then proceed to step 4.
___________________
1https://www.aapor.org/standards-ethics/aapor-code-of-ethics.aspx.
Step 4: Whenever Possible, Use Multiple Datasets to Compensate for Remaining Errors and Increase Precision of and Confidence in Estimates and Inferences
[Note 7]: Given that even the highest-quality dataset can be expected to contain errors, the use of multiple datasets is always a best practice to enhance the precision of the data and confidence in the estimates and inferences they are used to support. The use of multiple datasets to understand a phenomenon of interest may entail either (a) analyzing data across sources or (b) actually combining multiple sources into a single dataset (see Pasek and Lee; also Amaya).
Step 5: Assess Extent to Which Data Reflect True Attitudes
Even the most well-designed, well-implemented collection of public opinion data can present an unreliable or false picture of the true attitudes of the research subjects. Survey respondents, for example, may tell the researcher what they think the researcher wants to hear or what they think society would find acceptable, or respondents may not really know how they feel about an issue. Assessing the extent to which public opinion research data reflect true attitudes involves applying the considerations indicated by the ovals on the graphic (and detailed by Bond).
Step 6: Draw Inferences about Likely Outcome(s) and Step 7: Assign Level of Confidence to Inferences
As noted above, this synthesis does not cover the actual process of drawing inferences from public opinion data or assigning levels of confidence to those inferences.
DRAWING INFERENCES FROM PUBLIC OPINION SURVEYS: INSIGHTS FOR INTELLIGENCE REPORTS
René Bautista, PhD
Bautista presents a framework for assessing the quality of a survey dataset. This framework is based on two categories of information about a survey: contextual (background metadata) and technical (survey design elements), which can be used, respectively, to assess the credibility and soundness of a survey and its results. The three steps in this framework are
- Collect and briefly assess information on contextual survey elements.
- Collect and perform a focused analysis of information on technical survey elements (termed total survey error [TSE] assessment).
- Establish the credibility (based on background elements) and soundness (based on technical elements) of the survey and its results.
STEP 1: COLLECT AND ASSESS INFORMATION ON BACKGROUND SURVEY ELEMENTS
Information about the following contextual survey elements enables assessment of the credibility of a survey and its results:
- Survey purpose. The clarity—or lack thereof—of a survey’s purpose is an important determinant of its credibility. A survey’s purpose—e.g., academic research, market research—is important context for interpreting its results and determining what type of inferences they can support.
- Survey authenticity. Factors that can impair the authenticity and thus the credibility of a survey, compromising the accuracy and thus the analytical utility of its results, include its being conducted by an unknown agency or illegitimate group or individual.
- Professional integrity. A survey’s credibility is eroded by use of practices that are condemned by the research community (see the AAPOR Code of Professional Ethics and Practices referenced above), such as soliciting contributions or donations, serving sales purposes, or violating promised anonymity of respondents (e.g., by selling the information collected).
- Survey sponsorship. Interpretation of a survey’s results is affected by knowing who has a vested interest in commissioning the survey and disseminating its results. A survey commissioned by an individual, for example, may be designed to answer a question of interest to that person (e.g., whether the political landscape is favorable to running for office), or a survey may be designed to promote an agenda through distribution of the results without disclosure of the sponsor’s identity. A survey’s sponsor can have a bearing on its quality. High-quality surveys, for example, are costly to design and administer, requiring a commitment of resources that a sponsor may be unable or unwilling to make. Or perceived partisanship of a survey among respondents may affect their responses.
- Survey research team. The availability, or lack thereof, of information on the research team—whether the survey was carried out
- by a team with the necessary range of specialized knowledge and training—affects the credibility of a survey. Some essential functions may have been contracted to vendors, in which case the quality of those contractors is also of interest. In some cases, a survey branded as having been conducted by a university may have been carried out by graduate students, and the analyst needs to approach such a survey with caution.
- Background of survey firm. The analyst should consider the professional credentials and relevant experience of those responsible for a survey. Good indicators include relevant academic credentials, a public record of survey publications, and membership in major professional organizations in the field.
- Reporting and dissemination. Credible survey reports disclose minimal information necessary to assess the results. One tool for determining whether this information is provided is CNN’s Transparency Questionnaire.2 If a survey’s authors do not produce an article to discuss its results, the analyst can contact the survey agency to learn more about the results and how to interpret them. The analyst also can consult with public opinion experts on interpretation of the results; if a majority of these experts concur on the quality of inferences drawn from the results, the analyst may feel comfortable with the survey’s value.
STEP 2: COLLECT AND PERFORM A FOCUSED ANALYSIS OF INFORMATION ON TECHNICAL SURVEY ELEMENTS: TOTAL SURVEY ERROR (TSE) ASSESSMENT
The technical elements of a survey comprise four potential sources of survey error: (a) sampling, (b) nonresponse, (c) coverage, and (d) measurement. The TSE framework enables the analyst to examine these categories of error for a survey, consider the trade-offs among them, and assess their implications for the quality of the survey results and analytical inferences drawn from them. Note that each of these error components has aspects of both bias (defined as systematic departure of a survey estimate from the “true” population value) and variance (defined as the random uncertainty of the survey estimate’s representation of that value).
Sampling Error
There are two broad categories of sampling methods—probability and nonprobability:
___________________
2https://www.cnn.com/2019/07/09/politics/read-cnn-transparency-questionnaire-polling/index.html.
- In probability sampling, the sample to be surveyed is drawn randomly from the population of interest—most commonly the general population but sometimes a subset or a specific subpopulation (see Amaya)—on the basis of statistical theory. Probability methods allow drawing statistical/quantitative inferences about the population from which the sample is drawn.
- Nonprobability sampling is useful when a probability-based survey is too costly for the survey sponsor or the purpose is not to enable drawing statistical inferences about the population of interest but, for example, to gain insights that enrich contextual information or to survey rare or hard-to-reach populations. (See Amaya for detail.)
Because probability sampling is based on statistical theory, it permits more precise estimation of sampling error than is possible with nonprobability approaches, including the theoretical margin of error in the survey results, conventionally determined by the number of cases (the higher the sample size, the lower the margin of error, though this relationship is not linear). Note that the gains in margin of error with increased sample size quickly decrease to the point that the additional cost and logistical challenges of a larger survey, as well as the attendant increased potential for things to go wrong, may not be warranted.
Coverage Error
An ideal sample frame covers the target population entirely, which in practice may not happen. Systematic exclusion of some members of a target population may result in coverage bias, which may take the form of over-coverage (when the sample frame includes units not of interest) or undercoverage (when the frame misses important parts of the target population). Undercoverage is more challenging, and is often addressed by combining sample frames; however, that approach may result in selecting the same unit multiple times, thereby increasing the survey’s theoretical variance.
Sample frames are often based not just on theoretical considerations but also on practical field conditions and costs. In determining what statistical inferences are warranted from a survey, the analyst needs to identify the trade-offs made by the researchers.
Nonresponse Error
Nonresponse on a survey can take three forms:
- Noncontacts (respondents cannot be located);
- Refusals (respondents refused to participate); and
- Other reasons (e.g., language barriers, illness or death).
Bias results when there is a systematic relationship between the statistic of interest and nonresponse.
The rate of nonresponse does not always correlate with survey quality. Indeed, the reasons for nonresponse may be of greater interest than the rate. Noncontacts are related to practical issues of locating selected individuals (e.g., lack of technology needed to make contact). Refusals to participate are due to such issues as a sensitive topic or privacy concerns, and can take two forms:
- Unit nonresponse occurs when selected individuals choose not to participate. In such cases, researchers may employ such strategies as distributing recruitment materials explaining the survey’s purpose, or offering gifts or monetary incentives. Generally, however, it is necessary to correct for the nonresponse through statistical weighting—giving more weight to those who participated such that they represent those who did not.
- Item nonresponse can be either systematic (bias) or random (variance). Systematic item nonresponse may indicate the need to revise the item(s) in question. Researchers commonly address this form of nonresponse through statistical methods.
Measurement Error
Measurement error denotes the difference between a true and an estimated value, and occurs, for example, when a survey contains a leading question (producing bias) or when a question is so ambiguous that how respondents interpreted it is unclear (increasing variance). There are three typical sources of measurement error:
- Questionnaire design (type and phrasing of questions, response options, survey instructions, order of questions);
- Administration format (self- or interviewer-administered); and
- Method of administration (e.g., face to face, mail, phone).
STEP 3: ESTABLISH THE CREDIBILITY AND SOUNDNESS OF THE SURVEY AND ITS RESULTS
Tables 2-1 and 2-2, respectively, provide a summary of questions the analyst can ask in seeking to establish the credibility (based on contextual elements) and soundness (based on technical elements) of a survey and its results.
TABLE 2-1. A Rating Tool for Survey Quality: Credibility of Contextual Information
| ★ | ★★ | ||
|---|---|---|---|
| Credibility of contextual information | |||
| Survey purpose | Is the survey purpose clear? | No, it is not clear at all what the objective of the survey is. | No, there are not enough elements to identify the purpose. |
| Survey authenticity | Is the survey authentic (not fake)? | No. The survey is clearly a fake. | No, there is not enough to assert its authenticity. |
| Professional integrity | Does the survey avoid condemned practices? | No. The study did not avoid condemned practices relating to collecting survey data. | No. There are not many details, but one can see that the survey did not avoid condemned practices. |
| Survey sponsorship | Is it clear who paid for the study? | No, it is totally unclear who paid for the study. | No. There are just a few clues, but it’s unclear who may have contributed the money. |
| Survey research team | Is the team a known group of researchers? | No. There is no information about who designed and implemented the survey. | No. There is contradicting information on who conducted the study. |
| Background of survey firm | Is the reputation of the survey agency known? | No. No one seems to know anything about the survey organization. | No clear record, but based on the few known elements, they don’t seem to have the right competencies. |
| Reporting and dissemination | Is the description of how the study was conducted clear? | No. The survey methodology is completely unavailable. | No. There is no confidence that the methodology can be acquired. |
| ★★★ | ★★★★ | ★★★★★ |
|---|---|---|
| Maybe. There are some elements with which to infer the purpose. | Yes, with some modest effort, one can tell what the purpose is. | Yes, it is clear what the study aims to do. |
| Maybe. The information is not entirely clear. | Yes. With a careful reading, one can tell is authentic. | Yes. The survey is clearly authentic. |
| Maybe. There is doubt as to whether the study used condemned practices. | Yes. While there is not a lot of details, one can tell there were not condemned practices. | Yes. It is obvious that the survey was not collected using condemned practices. |
| Maybe. There are a few names of individuals or organizations linked to the study. | Yes, based on what other people are saying or indirect knowledge. | Yes. The source of financing is quite clear and publicly known. |
| Maybe. There are enough elements to speculate who the team might be. | Yes, but contact information was gathered with some effort. | Yes. The survey research team is known and easily contactable. |
| Maybe. The organization is not specialized in public opinion, or it is new. | Yes. The survey organization is affiliated to professional associations, and the organization is not new. | Yes. They are well known, they have a good reputation in general, and they publicly report results. |
| Maybe. The reporting is ambiguous, and the description is obscure. | Yes. The reporting of methods is limited. | Yes. The documentation and write-up of results are very clear. |
TABLE 2-2. A Rating Tool for Survey Quality – Soundness of Technical Information
| ★ | ★★ | ||
|---|---|---|---|
| Soundness of technical information | |||
| Sampling properties | Was the survey conducted based on probability sampling? | No. The study is clearly based on nonprobability methods. | No, but it mimics probability sampling (quota sampling), or the sample looks too good to be true (unrealistic large sample size). |
| Coverage properties | Did the study use an adequate sample frame? | No. The study was not based on a clear sample frame. | No, but the study attempted to develop an ad hoc sample frame, and there aren’t a lot of details. |
| Nonresponse properties | Does the study discuss issues of nonresponse? | No. Nothing is known about issues of nonresponse. | No, but the study provides some elements to get a sense on nonresponse. |
| Measurement properties | Did the survey use unloaded questions? | No. The study does not provide information on the questionnaire. | No, but from the brief description of results and frequencies, the question wording doesn’t look good. |
| ★★★ | ★★★★ | ★★★★★ |
|---|---|---|
| Maybe. The study combines probability and nonprobability data. Possibly for hard-to-reach populations. | Yes. It is clear that probability sampling was used but it’s unclear on statistical weighting. Too much uncertainty. | Yes. The study was clearly based on probability sampling and reasonable statistical weighting (based on relevant variables). |
| Maybe. The frame is incomplete or dated and likely to be biased or too uncertain. | Yes. The sample frame looks good and clearly reports its limits. | Yes. The sample frame is very reasonable for covering the target population. |
| Maybe. The study reports response rates but nothing else. | Yes. The study offers some insights on potential nonresponse issues. | Yes. The study offers an analysis on potential limitations due to nonresponse. |
| Maybe. The questionnaire is partially available and there is no clear presentation of question wording. | Yes. The questionnaire is available, but there is no discussion of measurement properties (that is, it is unclear whether directionality in the wording of some questions is intentionally). | Yes. The study offers an analysis of measurement properties of survey questions (that is, there is an explicit discussion on question wording). |
ALTERNATIVES TO PROBABILITY-BASED SURVEYS REPRESENTATIVE OF THE GENERAL POPULATION FOR MEASURING ATTITUDES
Ashley Amaya
Amaya points out that probability-based surveys of the general population (GP) (discussed in detail by Bautista and Bond) are not always feasible, available, or—while on average less subject to error than other methods and able to support statistical inferences about the GP—most relevant for the analytic purpose at hand. This paper focuses on alternative methods for collecting public opinion data, their strengths and limitations, and techniques for correcting or compensating for their potential errors. The paper begins by briefly reviewing some of the reasons the analyst might have for using datasets generated by these alternative methods, and it ends by describing approaches for triangulating or integrating data from different sources (covered in greater detail by Pasek and Lee) and providing an overview of ethical considerations for using any type of data (covered in greater detail by Bond).
ALTERNATIVES TO PROBABILITY-BASED GENERAL POPULATION SURVEYS
Amaya classifies datasets derived from alternative methods along two dimensions:
- Primary (collected by the researcher and thus well suited to answering the question they were designed to address) versus secondary (collected by others)
- Designed (considered systematically by the researcher to answer a specific question) versus organic (collected from a source not intended to answer a research question—e.g., credit card transactions, tweets)
The paper then reviews in turn the principal alternatives to probability-based GP surveys that the analyst may wish to consider, including their advantages and limitations, ways to address the limitations, and best use cases.
Designed Sources
Designed data sources may be either primary (collected by and thus transparent to the analyst) or secondary (not collected by the analyst and thus with varying degrees of transparency, depending on the source).
Probability-based Surveys Other Than Those Meant to Represent the General Population
In a probability-based GP survey, the sample frame is the entire population of interest, from which a simple random sample to survey is selected and about which statistical inferences can then be drawn. In some cases, even when a probability-based GP survey is feasible or available, the survey sample cannot or should not be representative of the GP, and alternative designs may be appropriate, as in the following use cases:
Use Case 1. The analyst wishes to draw inferences about the GP, but the sampling frame is missing certain units (e.g., region, minority group, age cohort). The analyst can address the resulting coverage bias by considering whether there is a theoretical reason why the opinions of the excluded group(s) should differ from those of the included groups such that overall estimates would be affected. An example is exclusion of residents of the Galapagos Islands because of their remoteness, which should not affect national estimates given that this group represents just 0.2 percent of the total population of Ecuador. If the coverage bias is deemed to pose a risk to the soundness of the analysis,
- The analyst can consider use of a secondary sampling frame, mode, or survey;
- Various weighting methods can be employed; or
- A frame of the missing unit(s) can be created.
Use Case 2. The analyst wants to make comparisons among certain subgroups, some of which are rare, so that a representative sample of the GP would not yield enough respondents from those groups.
Use Case 3. The analyst wants to study a rare population.
In both use cases 2 and 3, a stratified or clustered sample can be drawn. In stratification, samples are drawn independently for each group of interest. Clustering entails sampling units (e.g., neighborhoods, households) that contain multiple eligible individuals.
Nonprobability Surveys
In nonprobability surveys, the probabilities of selection into a sample to be surveyed are unknown. These surveys generally suffer from coverage and sampling errors that introduce sizable biases, especially in point estimates, and the inability to produce probabilities of selection limits the use of statistical models. On the other hand, nonprobability surveys are typically less resource-intensive than probability surveys, and facilitate the collection of sufficient sample sizes of rare populations. Use cases include:
- Use Case 1. A sampling frame is unavailable or too costly.
- Use Case 2. The analysis focuses on a rare population for which stratification cannot sufficiently improve the incidence rate.
- Use Case 3. The analysis requires a larger sample that is cost-prohibitive to obtain with probability-based methods.
- Use Case 4. Analyses will focus on correlations and models, not point estimates.
Multiple types of nonprobability surveys are suitable for the above use cases.
Nonprobability panels are formed by invitation (e.g., via internet pop-ups or loyalty programs). These panels generally incur lower costs than probability-based designs, and if the survey is administered online, produce more timely results. A panel vendor’s collection of information about the panelists (e.g., demographics, health attributes) makes it possible to target particular subgroups (e.g., veterans). On the other hand, nonprobability panels typically suffer from coverage bias and other coverage issues that often cannot be corrected with weighting and modeling approaches. These issues generally skew point estimates, but may not affect correlations, models, and causal analyses. Tools for judging the quality and utility of nonprobability panels include a list of questions published by ESOMAR3 and a framework4 developed by researchers.
___________________
3 ESOMAR (European Society for Opinion and Marketing Research). 2021. “Questions to Help Buyers of Online Samples” (online question and answer sheet). https://esomar.org/uploads/attachments/ckqqecpst00gw9dtrl32xetli-questions-to-help-buyers-of-online-samples-2021.pdf.
4 Mercer, A.W., F. Kreuter, S. Keeter, and E.A. Stuart. 2017. “Theory and Practice in Nonprobability Surveys.” Public Opinion Quarterly 81(S1):250–271. https://doi.org/10.1093/poq/nfw060.
Intercept surveys are conducted by “standing” in a particular location and interviewing individuals who pass by. The classic example is exit polls taken at voting sites; such surveys can also be conducted online. Like nonprobability panels, intercept surveys are less costly and yield results more rapidly compared with probability-based designs, and they can produce relatively accurate estimates if interviewers are placed so as to facilitate random selection of respondents and receive guidance on whom to sample. Intercept surveys may also be conducted online using what is termed river sampling, in which an ad or banner is published on a website and individuals who click on it (like fish in a river that bite on a line) are asked to complete a survey. While intercept surveys have their advantages, they also share the disadvantages of other nonprobability-based methods, such as coverage bias and limitations on statistical analysis. They also may suffer from differential nonresponse, as when early and election-day voters differ.
Finally, chain referral methods, such as snowball sampling and respondent-driven sampling (RDS) (see Bautista), are useful for studying networks and rare populations whose members are likely to know each other. The samples start with individuals often called “seeds,” who are interviewed and then asked to refer other eligible individuals (“sprouts”), who are then asked to refer still others, and so on. These methods are useful when the population is at risk, likely to be distrusting of outsiders (including the researcher), or likely to find the topic sensitive. On the other hand, these methods can be resource-intensive to implement; some seeds may not spawn enough sprouts, limiting sample size; and RDS may not eliminate bias and/or may increase variance in estimates, further limiting statistical efficiency.
Qualitative Data Collection
Qualitative methods may be especially useful for conducting foundational or exploratory research to understand cultural norms and societal practice and for taking deep dives into “why” questions. The two forms of qualitative research most salient to intelligence analysis are
- One-on-one in-depth interviews, in which questions are much more open-ended relative to survey questions, and the interviewer is able to follow up with the respondent; and
- Focus groups, in which multiple respondents can build on or negate the views of others in the group. They are less time-consuming than one-on-one interviews but less appropriate for sensitive topics.
Although these methods require fewer cases than traditional surveys and so are less resource-intensive, they do not facilitate quantitative analyses or point estimates. They are also more prone to subjective interpreta-
tion, and it is important to avoid bias by achieving a sample representative of the population of interest by, for example, using a series of screening questions.
Organic Sources
For the most part, organic data are from secondary sources (e.g., social media, transactions, health records). However, some organic data are from primary sources (e.g., metadata collected in a survey).
The organic data used most commonly to study attitudes are derived from social media (text, video, and images) and associated metadata. Use cases for these data include the following:
- Use Case 1. Providing an immediate reaction to a sudden event such as a coup or natural disaster;
- Use Case 2. Estimating turnout for an upcoming rally or protest; and
- Use Case 3. Understanding some types of networks.
The greatest benefit of social media data is their real-time nature. Because these data are stored, moreover, they may offer a historical record, enabling analysis of data leading up to an event. On the other hand, access to the data may be difficult for some platforms, and analysis of the data may require advanced programming or analytic skills with attendant time demands that offset the data’s real-time nature. Social media data also suffer from bias (e.g., users skew younger, more educated, and wealthier than the general population) and measurement error (e.g., people want to present their “best self” and so may not provide an accurate picture of their views). Social media data raise other issues of bias and error for which Amaya refers the analyst to various frameworks addressing these issues.5 Given these issues, she suggests that use of these data be limited to drawing inferences about active social media users or assessing social networks, or to situations in which data are needed immediately and no other source is available.
Other secondary sources include, for example, images, sensors, specimen collections, and administrative data. These sources may offer important insights into a nation’s economic, social, environmental, and cultural aspects, but are not used to measure public opinion.
___________________
5 For example, see Wojcik, S., and A. Hughes. 2019. “Sizing Up Twitter Users.” Pew Research Center, April 24, 2019. https://www.pewresearch.org/internet/2019/04/24/sizingup-twitter-users/.
USING DATA FROM MULTIPLE SOURCES
Amaya briefly reviews three common approaches for using data from multiple sources to leverage the advantages and mitigate the limitations of each.
Different Frames or Different Modes, Same People, Different Variables
Collecting variables for the same individual from different sources can help minimize measurement error, as when respondents provide inaccurate responses on a survey because they don’t know or don’t want to provide the correct answer, or when interview questions are considered sensitive. An example of this approach is supplementing face-to-face interviews with an audio computer-assisted self-interview for sensitive questions. On the other hand, this approach may incur costs (e.g., to program a mode); require consent, generating potential bias if those who do and do not give consent differ; and necessitate matching of sources, which may be complicated by, for example, different spellings of the same name in different sources.
Different Frames or Different Modes, Different People, Same Variables
To save costs, researchers may, for example, supplement a (more costly) probability-based sample with a (less costly) nonprobability-based sample, and combine the two sets of interviews into a single dataset. In general, using a single sampling frame but multiple modes is straightforward, whereas using a dataset blended from multiple probability-based frames may introduce challenges and risks. The frames, for example, must be deduplicated prior to data collection so the same person does not have a probability of selection in both frames.
Different Frames, Different People, Same Variables (Triangulating the Data)
This method might involve the use of variables from different sources that are meant to measure the same thing. The analysis is done on each variable or data source individually, but the results from all sources are considered in answering the question of interest (the approach used by the Federal Reserve in considering multiple economic indicators to determine the state of the economy). Alternatively, an analysis may be conducted in multiple ways to assess its sensitivity, minimizing the threat of statistical error due to the weaknesses of a given analytic test. (See Pasek and Lee for greater detail.)
ETHICAL CONSIDERATIONS
Ethical considerations are similar for probability-based GP surveys and the alternative methods discussed by Amaya (see Bond for greater detail). As noted also by Bond, adhering to ethical principles in data collection also improves data quality. Respondents who do not trust the researcher, for example, are prone to providing inaccurate answers.
How were the data collected, including what data were collected? In collecting data, it is essential to adhere to both U.S. law and the laws of the countries of interest. For survey data, the researcher must obtain informed consent from adults and consent or assent from minors. Participants should understand what they are being asked to do, what their rights are, and how their data will be used. It may also be possible to obtain informed consent for some types of organic data. Beyond informed consent, researchers asking sensitive questions should ensure that resources are available for cases of adverse reactions. Cultural norms must also be adhered to, and interviewers should be trained to avoid any type of coercion, including leading responses.
How were/are the data stored? Regardless of source, data should be stored on secure servers. The U.S. federal government has established rules for storage of various types of data; the requirements generally are more stringent the more sensitive the data are. Datasets containing data from multiple sources may require especially secure storage since identifying individuals is facilitated by the ability to triangulate the data.
How are the data being used? Before using a dataset, the analyst should consider the informed consent obtained. Most informed consent statements, for example, specify that the data will be used only for research purposes, and data from these sources must not be used for nonresearch purposes, such as identifying individuals’ legal status to determine their access to programs. Doing so not only is unethical, but also makes gathering accurate information from marginalized groups more difficult for future researchers.
INTEGRATING DATA ACROSS SOURCES
Josh Pasek and Sunghee Lee
Pasek and Lee begin by stressing that while all forms of data are subject to flaws that limit what can be learned, and with what confidence, from any data source, these information sources represent some of the best knowledge available about our social and political world. As noted in the overview section of this synthesis, then, the challenge for the analyst is to understand the flaws typically associated with various data sources and apply methods for correcting or compensating for those flaws. Pasek and
Lee discuss in detail methods that can be applied in using multiple datasets to increase the precision of and confidence in the data from individual sources—step 4a in the overview graphic used to frame this synthesis—which can always be considered a best practice in data analysis.
Pasek and Lee use the term “data integration” to refer to all such methods, defining it as follows: “Data integration is the process of taking multiple diverse streams of information and finding ways to use them jointly to make conclusions, reconcile their differences, and/or determine where they provide complementary or conflicting understandings.” Their generalized use of this term encompasses a wide range of more specific terms used in the field, and, in the context of this synthesis, is used to denote both methods for analyzing data across different data streams and methods for actually combining data streams to produce a single dataset. The paper cites four benefits of data integration thus defined:
- Enabling analysts to examine whether their conclusions about a phenomenon are robust to alternative forms of measurement;
- Providing data on different time points to indicate trends over time;
- Allowing comparative analyses by providing data streams from different communities or places; and
- Integrating multiple sources of data on particular individuals or organizations to provide a more precise understanding of the phenomenon of interest.
CONSIDERATIONS FOR DATA INTEGRATION
Pasek and Lee outline two broad sets of considerations for analysts seeking to integrate different data sources.
First is the strengths and weaknesses of the individual datasets being used, including the many factors that lead different datasets to yield different conclusions. Understanding the sources of these differences makes it possible to account for them and generate converging estimates across datasets, increasing confidence in the conclusions drawn.
The second set of considerations relates to the requirements of a particular analysis—for example, a high degree of precision at the individual level versus an accurate picture of the distribution of attitudes or behaviors in society. The paper reviews eight such considerations in detail.
Target Population(s)
The target population of interest to the analyst may range from a small set of individuals in a critical network to an entire population at the regional or national level. Clearly identifying the population of interest makes
it possible to align the collected data with the goals of the analysis and determine whether any adjustments are needed to improve that alignment.
What the Analyst Wants to Measure
In the context of public opinion, the analyst may be interested in estimating
- Point estimates—the proportion of a population that can be characterized in a particular way at a particular point in time;
- Trends—changes in population attributes over time;
- Relationships between characteristics—the extent to which different population attributes relate to one another;
- Causality—the extent to which a relationship can be attributed to a causal link; and
- Interventions—whether a particular type of intervention can be applied to influence an attribute in a population.
The Focus of Measurement
To illustrate this consideration, Pasek and Lee use the example of a political protest that a large number of people are expected to attend. In this case, the analyst might want to draw inferences about the profile of particular individuals likely to attend (beliefs, attitudes, experiences, behaviors); the distributions of different types of people at the event; or the number of people who can be expected to show up.
Data Granularity
Analysts using existing datasets may encounter limitations on the form of the data available to them. In some cases, the full original dataset is available, providing access to the microdata. In other cases, only aggregates of the data are accessible in the form of either topline results (the overall proportion of a population that shares a certain characteristic) or crosstabs (which show how these proportions vary across particular population subgroups). Integrating aggregate-level datasets can allow the analyst to trace trends over time or consider similarities in results across data collection methods, but cannot yield individual-level insights.
Representativeness
Pasek and Lee briefly summarize issues of representativeness addressed at length by Bautista. See the summary of that paper above for detail.
Heterogeneity in the Data-Generating Process
Pasek and Lee point to the range of methodological and nonmethodological factors that may influence study results and pose a challenge for any effort to integrate data from different sources. For methodological issues in surveys, they refer to the TSE framework (discussed in detail by Bautista) as a means of understanding and assessing the four major types of survey error—coverage, sampling, nonresponse, and measurement—and suggest that this framework can be applied to nonsurvey data sources as well. The paper highlights measurement error as particularly challenging to assess, pointing to such issues as the effects on responses of the location of a question within a questionnaire and seemingly slight variations in question wording. With respect to nonmethodolocial issues, the paper gives the examples of the involvement of different survey firms in a study using a single method and contextual factors that may influence the sensitivity of a question, factors that also can change over time.
Consistency of Measurement across Contexts
In the case of analyses aimed at assessing differences in attitudes and behaviors across groups or regions, Pasek and Lee note that the data collection may not be designed to achieve measurement comparability. They discuss three sets of challenges that can arise in such cases.
Data Integration across Regions, Countries, Cultural Contexts, and Languages
In integrating such data, differences in data collection methods are likely be salient, reflecting, for example, differences in infrastructure, political climate, or religious context. Even absent differences in methods, translation can be a major source of error for data collection from multiple linguistic groups. Pasek and Lee also point out that countries cannot be treated as cultural units. Indeed, two neighboring countries may share a similar cultural background, whereas a single country may comprise multiple subgroups with differing cultures and languages.
Measurement Equivalence
The link between cognitive psychology and survey measurement is well established. As an elementary construct of cognition, culture serves as a system for organizing personal experiences. An example is time orientation—the temporal dimension of past, present, and future used by
individuals in assigning coherent meanings to their experiences—which covaries with culture. Comparative research requires data with measurement equivalence, a requirement that goes beyond more superficial issues of such cross-sections with culture as language and religion to encompass the comparability of the way a given measure functions across cultures and contexts.
Response Style and Reporting Heterogeneity
Even when the substantive meaning of a question is consistent across comparison groups, the way respondents are classified may vary based on how their responses are assessed. For example, Likert response scales (in which respondents are asked to indicate their level of agreement with a series of statements) can yield biased estimates due to the tendency of some respondents to choose certain responses regardless of the question content; for example, Latinx respondents in the United States, for instance, have shown a greater tendency to acquiesce relative to their non-Latinx counterparts.
Political and Ethical Considerations
Pasek and Lee outline five political and ethical considerations that they suggest are of particular concern in integrating datasets (see Bond for greater detail):
- Feasibility in terms of both financial costs and time;
- Political risks to participating individuals, which may cause them to withhold information or experience harm if they provide it;
- Social risks to individuals if the information they provide could cause them to be viewed negatively by others, causing them to provide information selectively or experience harm if they respond;
- Risks for data collectors and sponsors in contexts where asking certain questions may be illegal or risky, or incur political oversight; and
- Risks from data inferences that would not occur unless datasets were integrated.
According to Pasek and Lee, “When ethical issues are apparent, the risks need to be weighed against the potential benefits” of using and integrating the datasets in question.
THE NEED TO HARMONIZE MEASUREMENTS WITHIN DATA STREAMS
Before datasets can be integrated, measurements of key parameters within each of the data streams must be harmonized so that the inferences drawn from the individual streams are comparable, the measurements share meanings, and the populations described by the data are comparable. Pasek and Lee describe five elements of this process.
Data Cleaning
Data cleaning involves dealing with the multiple sorts of errors that can make social data “messy.” Official records, for example, can contain outdated information, errors made when data were copied from one form to another, and misspellings, among others. Textual, visual, and auditory data often require specialized forms of data cleaning not needed for numeric data. The paper gives several detailed examples.
Linking Sample Data with the Population
When the design of a data collection does not adequately ensure that the data approximate the population of interest, confidence in inferences drawn from the data is reduced. In such cases, a variety of weighting and adjustment methods can be used to better link the dataset with the population it is intended to represent. Methods commonly used for this purpose include poststratification, raking (also termed iterative proportional fitting) and calibration.
With respect to weighting, Pasek and Lee caution that this process can increase the overall variance of results derived from the data, and increase total error if the variance thus introduced is larger than the bias accounted for. Alternative methods for generating inferences that match the population, discussed in the literature in the context of nonprobability samples, are classified as quasi-randomization and superpopulation approaches.
Addressing Data Missingness (Imputation)
Attempts to identify values for missing data (imputation) are complicated, requiring simultaneously estimating the missing values and accounting for the errors in those estimates. Pasek and Lee describe two effective imputation approaches: multiple imputation (methods allowing random errors associated with imputation, based on use of regression models to estimate the value of individual pieces of missing data as a function of other variables without missing data); and maximum likelihood imputation
(methods using the covariance matrix to achieve similar ends, but typically requiring the use of structural equation modeling software).
Generating Composite Measures
Composite measurement—estimation of key measures at the intersection of a series of other measures—can be applied within or across data streams. These strategies can help isolate key concepts, avoid overreliance on a potentially error-prone measure, and mitigate numerous sources of bias. They include
- Calculation of an index (a measure based on an average or weighted average of some set of measures); and
- Generation of latent traits representing shared variance across a series of items.
Validation
Validating each data stream prior to integration can increase confidence in the inferences drawn from the integrated data. Both reliability and validity can be considered. Reliability denotes whether items intended to measure the same construct yield similar results. Validity encompasses convergent, discriminant, face, content, and construct validity. When the results of validation within each data stream are consistent across streams, one can be confident about when errors from different streams are likely to compound versus cancel out one another. Especially when data streams are from different cultural groups, validation may make data comparability more defensible.
COMBINING DATA STREAMS TO PRODUCE A SINGLE DATASET
The process of combining data streams involves various methods for matching cases to one another at either the individual or aggregate level. Data can be linked based on:
- Individual identifiers,
- Household identifiers,
- Group identifiers,
- Location-based metrics,
- Networks, and
- Content-based metrics.
Each of these types of linking is associated with a level of precision and some amount of error. Links made on the basis of individual-level identifiers, for example, depend on the shared accuracy of those identifiers
and the tolerance for discrepancies. Stringent matching techniques produce highly certain matches but match fewer records overall, while less stringent techniques may match individuals who are not true matches (e.g., simply sharing a name) but match more records overall.
Links based on geographical, behavioral, or other aggregate-level connections may provide valuable contextual information and other indicators not observable at the individual level. But it is important to avoid overgeneralization, as individuals within such an aggregate may deviate from the norm in that group.
ANALYZING DATA ACROSS STREAMS
Once issues within data streams have been addressed, analysts can undertake analyses that bridge across the different streams. The approach used for this purpose will depend on the goal of the analysis.
If the main goal is to understand a phenomenon that is measured in multiple data streams, ensemble approaches are typically used. They include: (a) multiple frame estimation, (b) the pooled data approach, (c) multilevel modeling, and (d) small area estimation.
If the main goal is to understand how phenomena differ across contexts of geography, time, or population groups, techniques can be used that recognize the similarity of proximal contexts and attempt to model the variability that may occur across those contexts. More sophisticated than least squares regression models, the models used for this purpose include random effects, time-series, and generalized additive models. Models that span multiple contexts can often, relatively simply, be used to examine whether differing sources of data, rather than differences among the individuals who are the source of the data, are partially driving observations.
Finally, the main goal may be to understand a social phenomenon through evidence of a causal relationship between two measured variables. In general, such a relationship can be established with evidence that a proposed cause and effect are empirically related, that the cause precedes the effect, and that no alternative mechanisms might result in the correspondence between the variables. Evidence establishing causality can also include observation that proposed cause-and-effect relations behave in theoretically expected ways.
The strongest evidence for causal relationships comes from studies in which individuals or groups of individuals are randomized into different conditions. Data integration is rarely necessary in the context of such designs, but more often becomes necessary when data collection deviates from this experimental paradigm. Techniques for inferring causality in such cases include (a) ruling out alternative causes, (b) deriving causal evidence for temporal relationships, and (c) bolstering causal claims through theory confirmation.
ASCERTAINING TRUE ATTITUDES IN SURVEY RESEARCH: ETHICS AND METHODS
Kanisha D. Bond, PhD, MPP
Bond examines technical and ethical issues in gathering and analyzing survey data to ascertain the “true attitudes” of respondents, particularly in fragile, volatile, or conflict-prone settings. An important emphasis of the paper is that these two sets of issues are intertwined, and both separately and in their interaction affect the quality of such research and the inferences it can support. The paper also outlines strategies the analyst can use to mitigate these issues.
DEFINITION
Bond defines political attitudes as “cognitive frameworks that individuals use to locate themselves and others in deliberations over matters of community affairs”—“the ‘why’ underpinning an individual’s political opinions, positions, or behaviors.” She emphasizes that these attitudes are deeply contextual and contingent, and subject to change with exposure to new information, experiences, and environmental circumstances.
METHODS FOR GATHERING DATA ON POLITICAL ATTITUDES
Bond stresses the limited observability of data on political attitudes and the inherent inability to measure them in any fully objective way.
Methods of observation include the use of structured questionnaires, as well as interviews and focus groups. Some researchers use artificial intelligence and big data to infer attitudes from behavior, but Bond points out that these methods can introduce measurement error—for example, through confirmation bias (the tendency to use new information as confirmation of one’s existing beliefs or theories).
Attitude data may be collected by both academic and nonacademic sources. The observation and measurement processes of the former sources tend to be relatively transparent, while responsibility for addressing issues of consent, privacy, confidentiality, or harm lies with the researchers. Nonacademic sources—such as foundations and think tanks—impose varying restrictions on public access to such background information as data collection and measurement schemes, and may also limit the availability of raw data, providing only the research results.
Finally, special-interest and media sources offer limited transparency. But the data are often gathered by individuals with a close relationship to the surveyed population, and their reports can include valuable contextual information.
OBSERVING TRUE ATTITUDES
Bond next takes a deeper dive into what it means to observe “true attitudes,” defined as reflecting a survey respondent’s actual sense-making framework. She points out, however, that responses not reflecting true attitudes are not necessarily “false.”
There is a distinction, for example, between implicit and explicit attitudes: The former are “visceral” associations that, through higher-order psychological processes, are shaped into and expressed as the explicit attitudes likely to be observed and measured through survey research. The two are usually correlated, but also may diverge.
Nonattitudes denote the absence of a predisposition about a topic, reflected in responses ranging from “no opinion” to random responses offered just for the sake of responding. Bond cautions that survey questions designed to stimulate formulation of an opinion or judgment will not uncover truth, but serve to (co)create it.
With respect to lies and strategic responses, Bond suggests that while respondents tend to provide the best answer they can given their circumstances, even a purposely misleading response can reveal how the respondent views the question, the survey, the surveyor, or the circumstances. Nonetheless, such a response can be assumed to be untrue.
Finally, incomplete, partial, and nonresponses (e.g., skipped questions, “don’t know” or “prefer not to say” responses) can be informative—for example, regarding the sensitivity of the topic, the possible dangers of openly stating an opinion, or the volatility of opinions on the topic.
ETHICS AND THE INTELLIGENCE COMMUNITY
Bond stresses that “ethically questionable or otherwise harmful survey research is rarely, if ever, scientifically or societally defensible.” At a minimum, research to gather or analyze attitude data should endeavor to do no harm, treating the safety and well-being of all research participants with reverence. With regard to using data that were generated unethically or cannot be analyzed in accordance with the Belmont Code6 of human subject treatment, the analyst should keep in mind that ethical violations produce “bad” data (see also Amaya), as it is unwise to trust the veracity
___________________
6 The Belmont Code is a philosophical statement issued in a report (The Belmont Report: Ethical Principles and Guidelines for the Protection of Human Subjects of Research) in 1979 by the National Commission for the Protection of Human Subjects of Biomedical and Behavioral Research. In that report, the Commission identified three ethical principles that should govern research involving human subjects: respect for persons, beneficence, and justice. The human subjects research system is supposed to align with the spirit of the principles, but the “letter” of these principles resides in the federal regulations that implement those principles (e.g., the “Common Rule” concerning prior review and consent across all agencies, and certain specific regulations, such as 45CFR46 in the U.S. Department of Health and Human Services).
and completeness of data provided by respondents who have been harmed in the data collection process. Moreover, such respondents may lobby others against future participation in research, which will damage the research enterprise.
With the above considerations in mind, Bond argues for detailed institutional guidance within the IC regarding ethical norms and practices in survey research. She also suggests that if the analyst detects any systematic ethical (or technical) irregularity in data collection, best practice is to incorporate models of the bias into any analysis of the data.
EIGHT CHALLENGES IN OBSERVATION AND MEASUREMENT OF TRUE ATTITUDES
Bond discusses eight ethical and technical challenges—structural, situational, and instrumental—faced in attempting to observe and measure true attitudes, along with associated empirical indicators of potential flaws in the data. She also outlines strategies that can help the analyst address these challenges to enhance the data’s credibility. She emphasizes that the various challenges interact and that when they cannot be mitigated at all, it may be advisable to abandon a survey project or exclude the data from analysis.
Structural Challenges
Misrepresentation and the Demands of Surveillance
Purposeful misrepresentation of the scope of or justification for survey participation or the intended uses of an individual’s responses is coercive in that it robs participants of their essential right to make an informed choice. Survey designers, enumerators, and end users of the data share responsibility for ensuring that all participants fully understand the costs and risks of their participation.
Power Dynamics
Power dynamics at the level of a particular survey may distort survey responses: If participants have esteem for the survey commissioner, they may provide answers they think will help achieve the survey’s perceived goals; conversely, participants may try to “sabotage” a survey by purposely providing untrue or misleading answers. And respondents who feel disempowered relative to their questioner may provide distorted information to enhance their perceived safety or security.
One approach used to address the challenge of power sensitivities,
especially in fragile and low-resource settings, is using local rather than American enumerators. However, this approach can potentially subject these more vulnerable research partners to the risks and costs associated with the work.
Situational Challenges
Fragile and Volatile Survey Contexts
Extant research is unclear on how unstable or rapidly shifting risk conditions affect the stability or strength of individual attitudes. Nonetheless, it is generally accepted that the quality of field data is unpredictable in contexts of active conflict or contestation or rapidly shifting security conditions. Indeed, survey research that aims to uncover what people think and fails to take into account the precariousness of satisfying basic needs in resource-poor settings or the scope of threats to physical security in socially fragmented communities may do more harm than good for both respondents and analysts.
Potential for Direct Harm
Participation in survey research can result in psychological, physical, social, and emotional harm—the potential for which has increased as a result of the challenges to privacy posed by the growing use of artificial intelligence, big data, and imputation methods for extracting attitude information from social media and other networks. Bond points out that individuals can be (re)traumatized through requests for information that may jeopardize their security, or may experience undue negative consequences for their responses or the lack thereof.
Sensitive Topics
When respondents perceive survey topics to be taboo, stigmatized, or highly emotional, the social desirability of certain attitudes toward those topics can influence their willingness and ability to provide truthful responses. In such cases, it is helpful for the analyst to have extensive knowledge of community norms around such topics. Relational interviewing (where the interview is more like a dialogue than a one-way interrogation) can be used as a complement or alternative to quantitative survey administration to understand how respondents perceive the form and content of a survey, as well as their relationship to the questioner (which itself may be a point of sensitivity).
Time
Because attitudes can shift over time, they are better understood through longitudinal data collections than through cross-sectional snapshots. In particular, analysts should be cautious about extrapolating the results of a cross-sectional survey to a different time period, especially during periods of unrest or heightened uncertainty.
Instrumental Challenges
Sampling and Exposure
In some survey contexts, respondents in a random sample may have a history of exposure to the survey instrument, the surveyors, or the overall process of survey research. As a result of that exposure, they may have formulated “scripts” for commonly posed questions, or they may have developed research fatigue. Those who find they do not have the option of refusing to participate may be prone to providing low-quality responses. In addition, heavy research exposure can produce both observation and measurement bias in attitude data by influencing the attentiveness and care respondents apply to the questions they are asked.
Bond also acknowledges that convenience samples are often the most ethical, politically feasible, and practical sampling option. Yet she stresses the vital importance of context and cautions the analyst against applying data from one context to another—for example, using data from migrants or expats to infer public opinion in their home country.
To address such sampling challenges, purposive stratification of a nonrandom survey sample—dividing it into subgroups (strata) to ensure that all subgroups are adequately represented—can maximize the sample’s representativeness. This approach becomes more useful as the size of the reachable set of respondents grows.
Question Type, Question Form, and Intercultural Literacy
Several approaches can be used to address this set of challenges:
- To address the need for maximum cultural sensitivity and avoid confusion and misunderstanding, it is best practice to offer respondents a survey questionnaire in the language with which they feel most comfortable.
- Including a “no opinion”/“don’t care” or a “not at all” option for scale responses can aid in gathering data on nonattitudes.
- Open-ended questions prioritize the respondent’s viewpoint over the researcher’s and can yield attitude information unanticipated
- by the survey administrator, although it does give the researcher less control over the speed and tone of the engagement.
- Focus groups and consultation with area experts can aid in question development by providing insights into cultural nuances and connotative implications that might otherwise not be apparent to the survey designer or administrator.
- Post facto focus groups can be helpful in providing such insights for those seeking to analyze survey data already collected.
A final challenge in this area is encountered with remote/online survey administration: verifying that respondents are who they say they are. Bots, fake social media accounts, and organized schemes paying individuals to answer surveys all are proliferating, and can contribute significantly to measurement error. Respondents’ limited comprehension of and/or access to online surveys, as well as limited computer literacy, can be an issue as well, while on the other hand, some respondents may hesitate to provide full and truthful responses to hand-written surveys that leave a paper trail.
SUMMARY OF MITIGATION STRATEGIES
Bond outlines a four-pronged approach for the analyst to apply in assessing the level of confidence warranted in the accuracy and ethical propriety of attitude data:
- Best practice in survey design, implementation, and analysis is to investigate the data—generating process to the extent possible.
- The analyst should aim to maximize contextual knowledge of both the respondents and the data. This includes gathering information about the survey methodology and conduct to enable assessment of the extent to which the challenges discussed above were addressed. Doing so will, among other things, allow for credible hypotheses about the direction or strength of (potential) biases in the data.
- The analyst should minimize reliance on opaque sources. Responses that cannot be solicited without deception, subterfuge, or secrecy are inherently vulnerable to the above challenges and others as well. Source opacity will also impede the gathering of background information on the data and how they were collected. A fourth strategy is to prioritize analysis of survey and question metadata—attributes of the data that provide background information about the survey conduct, content, and/or responses.
- In the qualitative context, survey metadata often include such attributes as tone and unasked questions.
- In the quantitative context, metadata may include such variables as the number of unanswered questions and how long it took a
- respondent to complete specific items. Even purposeful deception can illuminate the underlying political value of answering a given question or participating in a given survey.
- Enumerator training can include guidance on taking detailed notes about any difficulties observed or experienced before, during, or after administering a survey.


