Measurement and Analysis of Public Opinion: An Analytic Framework (2022)
Chapter: 3A Drawing Inferences fromPublic Opinion Surveys: Insights for Intelligence Reports - Ren Bautista
3A
Drawing Inferences from Public Opinion Surveys: Insights for Intelligence Reports
INTRODUCTION: ASSESSING QUALITY IN PUBLIC OPINION SURVEYS
This paper aims to provide members of the United States intelligence community a fundamental framework for analyzing and drawing conclusions based on existing public opinion data. The manuscript is motivated by the needs of analysts in the intelligence community to navigate theoretical and practical elements in determining the soundness of available public opinion surveys. The paper focuses on describing contextual and technical information for conducting a holistic assessment of key quality aspects of public opinion surveys that may support inference of survey results to populations of interest. The tools presented in this paper are informed from scientific knowledge as well as practical experience and can help analysts to acquire technical skills to evaluate the strengths and limits of survey data. The framework is based on practical as well as theoretical aspects that can be employed to assess the quality of available information (this includes informal as well as formal concepts from the field of statistics and survey methodology). Throughout this paper, there are guiding intelligence questions that the analysts can use to gather and assess a study. Lastly, the paper provides an intuitive rating system that can be used to classify survey elements and qualify a public opinion survey as (a) “credible and sound,” (b) “partially credible, partially sound,” or (c) “not credible, not sound.” Ultimately, the goal of this paper is to help analysts generate credible insights based on the assessment of whether public opinion data are trustworthy enough to capture a moment in time for a society.
PUBLIC OPINION SURVEYS AS INTELLIGENCE
The importance of devoting attention to indicators that may explain changes in societies is critical to the mission of the intelligence community. Developing scientifically-sound, valid, and evidence-based intelligence is vital for developing understanding of the social, political, and economic forces active in any nation. The relationship between the public, people in power, and public institutions is of interest to people in academia, business, and media, as well as to industrial, military, and civilian leaders around the world. The process of collecting data, analyzing it, and drawing conclusions nonetheless differs across all these spheres of activity. While most data users rely on existing public opinion data, they each interpret the data from a unique perspective. This is also true for the intelligence community, whose needs may bring up special issues and challenges.
To help illustrate the array of different possible perspectives, let’s briefly contrast how some groups approach the consumption of public opinion data. Consider, for instance, a hypothetical journalist trying to cover a relevant story such as issues relating to policing racial and ethnic minorities in a particular country. The journalist may be reacting to other news stories associated with the salience of a particular event. The journalist may be pressed to gather elements that support a narrative relevant to their story, and thus, the motivation to gather survey data could be to swiftly uncover “the truth” on what the public thinks. Under these conditions, a journalist might draw on the results of a public opinion survey without fully scrutinizing the survey methodology as the speed of the ever-churning news cycle may not allow sufficient time for a detailed assessment of the data.
A university researcher sits at the other end of the spectrum. They do not face the demands of the news cycle, and despite having interest in the same topic as the journalist, they may follow a different approach. An academic researcher may express skepticism about the results of a survey or may want to assess it through the lens of sociological or political theory to explain the particular attitudes and behaviors being explored. A university researcher may thus formulate a theoretical explanation and try to determine whether existing data (most likely using specialized statistical tools) offer empirical support for their theory. The academic researcher may even try to develop their own data to further investigate the same topic over a longer time frame. In the end, the academic’s main concern may lie with uncovering the theoretical sociological or psychological forces driving a public event.
Intelligence analysts are likely to fall between the two end points described above. They may not have as much time as scholarly scientists to fully prepare a report, but they also do not entirely face the demands of the news cycle. The intelligence analyst’s pressing need may be to establish whether a society is experiencing change and they must do this in a timely,
credible, and reliable manner. In trying to respond quickly, however, an intelligence analyst may overlook some key methodological aspects that determine the quality of survey results, which varies depending on chosen methods. It is thus relevant for intelligence analysts to take the time to ask the right questions to assess the key survey quality elements.
Intelligence analysts may consider their research approach as an activity to fill gaps in their knowledge, the purpose of which is to conduct a well-rounded study of a public opinion survey. It is thus recommended that intelligence analysts gather and study both contextual information (the survey background) and technical information (the survey design and results) to establish both the credibility and soundness of the survey. Definitions of these concepts are provided as follows and summarized in Figure 3A-1. Also, Figure 3A-1 introduces key questions that can help guide analysts in their research inquiry.
Contextual Information: Key Questions
- Survey purpose. Is the survey purpose clear?
- Survey authenticity. Is the survey authentic (i.e., not a fake survey)?
- Professional integrity. Does the survey avoid condemned practices?
- Survey sponsorship. Is it clear who paid for the study?
- Survey research team. Is the team a known group of researchers?
- Background of survey firm. Is the reputation of the survey firm (or group) known?
- Reporting and dissemination. Is the description of how the study was conducted clear?
Technical Information: Key Questions (Total Survey Error)
- Sampling properties. Was the survey conducted based on probability sampling?
- Coverage properties. Did the study use an adequate sample frame?
- Nonresponse properties. Does the study discuss issues of nonresponse?
- Measurement properties. Did the survey use unloaded questions? (that is, survey questions that neutral, clear and provide a balanced representation of response options).
Contextual information is the “metadata” or background information that helps situate the survey in place. It essentially includes descriptive information about the study (not the content of the survey design or the survey data themselves) that can help intelligence analysts learn about the study. Contextual information alone is not enough to accept survey results, but it helps the analyst discover the foundation of the survey. A survey’s context can be categorized into seven analyzable elements:
- Survey purpose
- Survey authenticity
- Professional integrity
- Survey sponsorship
- Survey research team
- Background of survey firm
- Reporting and dissemination
Technical information can be thought of as the properties of the study that delineate the planning, scope, adequacy, and limitations of the survey to represent a population of interest. Technical information is typically what is discussed by survey methodologists and sampling statisticians when creating, assessing, and interpreting high-quality surveys. Technical information can be categorized into four elements:
- Sampling properties
- Coverage properties
- Nonresponse properties
- Measurement properties
Survey credibility refers to the perceived quality of contextual information that makes the survey worthy of belief (i.e., the “believability” of the study). The analysis of contextual information can help to better assess whether the survey results are likely to be “believable,” broadly defined. The importance of contextual information cannot be overstated as this information can tell us a great deal about the credibility of a study.
Survey soundness refers to the quality assessment of technical and scientific elements from a survey methodology perspective. This information helps to determine whether a survey is technically viable for intelligence analysis (the scientific “defensibility” of the study). The assessment of technical features can help the analyst to assess whether the results are likely to be “representative.” It is important to note that there is a distinction between whether the survey is of sufficient quality (“defensible”) to make a statistical inference as opposed to the inference itself. The soundness of a statistical inference is also an important consideration and depends on the combined quality of all technical information. Typically, this technical information is analyzed through a survey methodology paradigm known as “total survey error” (discussed below in “Technical Information: Total Survey Error Assessment”).
A five-star quality rating tool is recommended to help intelligence analysts to quickly assess contextual and technical information of a survey. A rating system can help analysts determine the extent to which contextual information indicates the study is credible and the extent to which technical information indicates the survey data sound. Each of the elements introduced in Figure 3A-1 can be rated and enable more holistic assessment.
CONTEXTUAL INFORMATION (SURVEY BACKGROUND INFORMATION)
The journey begins by gathering as much background information as possible on the survey and then rating the information. The intelligence analyst will encounter many kinds of survey topics (for example, public health, crime victimization, education, labor statistics, government spending, economic assessment, education assessment). Obviously, some surveys are more visible and influential than others, such as studies of hot-button topics like election campaigns, evaluation of government leadership, public views on abortion rights, death penalty, gun control, immigration, vaccinations, religiosity, among many others, which tend to gain more attention from the public. Regardless of their level of visibility, intelligence gathering that uses surveys can be approached in the same way (by asking relevant questions).
Survey Purpose
Surveys are conducted for many different purposes, such as academic research, assessing support for candidate selection, market research, public policy, government assessment, and journalism, among many others. A major international retail company, for example, may want to gather strategic information for financial decisions related to expanding its presence in a particular region of the world. In a situation like that, most of the survey questions would be aimed at understanding effectiveness in advertisement strategies and product offerings, and perhaps just a few questions focused on the evaluation of local authorities or attitudes toward the rule of law. Understanding the survey motivation is helpful because the topical context in which survey questions are asked matters when interpreting results.
Sociological or academic surveys that aim to identify social indicators are also another example of surveys that may yield different insights, and their intention is more for long-term research. Frequently, surveys conducted aimed to measure sociological constructs subject to societal norms (such as attitudes toward extramarital sex or spanking as a way of disciplining a child) are more likely to reflect trends that change slowly over time. Surveys designed to fit events driven by the news media cycle, such as studies aimed at measuring perceptions of candidates or party preferences during an election campaign, tend to focus on viewpoints that may evolve more quickly, leading to greater uncertainty about interpretation of the survey results.
Understanding the purpose can help assess the type of inferences that can be made about the study. When the purpose of the survey is not clear (unavailable), the perceived credibility of the survey is low. When the purpose of the survey is clear, the survey can be judged more credibly (Figure 3A-2).
Is the survey purpose clear? (five-star rating)
★
No, it is not clear at all what the objective of the survey is.
★★
No, there are not enough elements to identify the purpose.
★★★
Maybe. There are some elements that infer the purpose.
★★★★
Yes, with some modest effort, one can tell what the purpose is.
★★★★★
Yes, it is clear what the study aims to do.
Survey Authenticity
It is important to establish the veracity of a survey, especially in places where public opinion information is quite scarce. In countries where not many surveys are conducted, the few survey results that may exist are treated as precious and “marketable” information, and it may not be possible to discern who created the survey. This may lead to having partially available information, and the few surveys that are made known to certain individuals (usually high-profile) are repeated quickly, incompletely, and uncritically to the point that sometimes either the source is not verified or the information has been distorted despite best intentions (just like the telephone game). These “telephone game” results could lead to spreading unrealistic, unverified, and sometimes false expectations about survey results. The bottom line is that just because a high-profile individual men-
tions a survey result does not mean that the survey is true or valid. If the intelligence analyst cannot easily identify the original source of the survey, it is better to treat the survey result as not credible.
In other situations, the source can be traced back but the group or individual who created the survey is not legitimate or credible. This is particularly problematic during election campaigns. The intelligence analyst needs to be aware of inconsistencies in the field. Sometimes a verified, authentic survey may provide results that are deemed inaccurate and get quickly dismissed, while a fake survey could be perceived as accurate and end up being frequently cited. Illegitimate results can enter the political debate and be cited by high-profile individuals in persuasive arguments designed to swing public opinion in a particular direction.
While it is tempting to use surveys of dubious credibility (especially if many others are citing the results), it is preferable that intelligence analysts differentiate between verified and unverified surveys and assign lower value or no value to unverified surveys (Figure 3A-3).
Is the survey authentic, that is, not fake? (five-star rating)
★
No. The survey is clearly a fake.
★★
No, there is not enough to assert its authenticity.
★★★
Maybe. Information is not entirely clear.
★★★★
Yes. With a careful reading, one can tell is authentic.
★★★★★
Yes. The survey is clearly authentic.
To illustrate, in the early months of the 2018 U.S. Senate race in the state of Michigan, the three-term Democratic incumbent Senator Debbie Stabenow was expected to lead the race, but an election survey emerged indicating that American singer Robert James Ritchie (known professionally as Kid Rock, who identified as a Republican at the time) had taken the lead. The striking survey result quickly gained attention, in part due to recent increases in popularity of Republican candidates across the United States after the 2016 presidential election victory of Donald Trump. The numbers suggesting Kid Rock’s significant lead started showing up in public pronouncements on political websites and was even mentioned on social media by Texas Governor Greg Abbott. Unfortunately, the survey was conducted by an unknown agency that essentially appeared overnight on the internet and did not measure up to standard when public opinion experts inquired about the study’s details (Enten, 2017). In the end, the Senate election was won by the incumbent, and the American singer did not even appear on the final ballot, let alone gain substantial votes.
Professional Integrity
Conducting a study based on condemned professional practices is clearly a sign of erosion of survey credibility (Figure 3A-4). The American Association for Public Opinion Research has compiled and created useful definitions of practices that the survey research community condemns.1,2 While these condemned practices were put together by an American organization, the principles apply universally to survey research. These condemned practices are (a) soliciting financial payment, contributions, or donations as part of the survey taking process, a practice known as “frugging”; (b) attempting to engage survey respondents in sales (using the pretense of scientific research for sales purposes) are questionable, a practice is known as “sugging”; (c) failing to protect the anonymity of survey respondents (such as surveys conducted by commercial entities to collect information to be sold later for commercial purposes); (d) allowing individuals from the public to self-select into the study through call-in or write-in participation (an increasingly popular practice used on social media platforms and self-promoted web portals); and (e) conducting political telemarketing efforts under the pretense of survey research to spread or “push” political information in order to influence opinion and manipulate the respondents in a particular direction, known as “push polling”).
___________________
1https://www.aapor.org/Standards-Ethics/Survey-Practices-that-AAPOR-Condemns/SourcesCited-in-Best-Practices-Survey-Practices-t.aspx.
2https://www.aapor.org/Standards-Ethics/Survey-Practices-that-AAPOR-Condemns.aspx.
Does the survey avoid condemned practices? (five-star rating)
★
No. The study did not avoid condemned practices to collect survey data.
★★
No. There are not many details, but one can see that the survey did not avoid condemned practices.
★★★
Maybe. There is doubt on whether the study used condemned practices.
★★★★
Yes. While there are not a lot of details, one can tell there were not condemned practices involved during data collection.
★★★★★
Yes. It is obvious that the survey was not collected using condemned practices.
Survey Sponsorship
Intelligence analysts using survey results must gain an understanding of who has a vested interest in commissioning and disseminating a particular survey. High-quality surveys based on a valid and representative sample of the population are expensive, and not everybody can afford such a scientific survey. Surveys are typically commissioned by universities, think tanks, international institutions, political parties, political campaigns, international banks, the media, or financial investors. Some sponsors may provide private funds for the research (for example, a private bank to conduct a survey on saving habits or financial preparedness). Other sponsors could be international organizations financing strategic studies (for instance, the European Commission, which funded the studies
“Horizon 2020” and “Horizon Europe”), government agencies that fund national strategic studies (such as the Academy of Finland), or ministries in countries proving direct public funding for contractual work guided by concrete objectives (like Taiwan’s Ministry of Science and Technology). Other groups such as nonprofit organizations may partially or completely fund research that aims to inform strategies for improving the future of local or national communities. Public entities can provide financing for public opinion research on behalf of political parties (Mexico’s National Electoral Institute, for instance, provides financing to political parties to conduct their own research).
There are other types of informal funding organizations that may operate with greater discretion in how they award the work and distribute data. A business, for example, may want to quickly assess the political and electoral landscape in a country during an election campaign before committing support to a particular candidate, so it may commission its own survey. When results of such surveys become known to intelligence analysts, they represent a challenge to interpretation since sometimes the survey is designed with a limited scope in mind (e.g., trying to answer a particular question based on narrow, private interests). Sometimes the sponsor may be seeking the data to inform personal decisions, but at other times they may be seeking to disseminate the results anonymously in order to promote an agenda. Those with an agenda in mind may use different tactics to achieve their purpose. They may, for example, partner with a news organization that may not have enough financial resources to conduct its own surveys and is willing to engage in a friendly agreement to work with the sponsor and publish the survey results if they are granted the exclusive rights for publication of the results. Surveys published using these tactics are difficult to identify, but they do exist. When the identity of the sponsors is unclear, the credibility of the study becomes questionable.
Beyond financial disclosure, there are other methodological concerns related to perceived sponsorship. The survey methodology literature shows that the stated or perceived survey sponsor may make a difference in survey quality. A survey conducted, for example, during the highly polarized 1990 Nicaragua general election in which Violeta Chamorro unexpectedly defeated incumbent Daniel Ortega demonstrated that respondent perceptions of partisanship on the part of survey researchers may have influenced the respondents’ answers. Many such surveys failed to correctly predict the election outcome. An experiment led by academic researchers from the University of Michigan during the Nicaraguan campaign shed some light on the issue. Academic researchers experimentally manipulated the color and design of pens used during the interviewing process in a face-to-face survey. One experimental condition used colored red and
black pens with the legend “Daniel Presidente.” A second condition used white and blue pens with Chamorro’s party acronym. A third condition used a red and white pen with no markings (suggesting neutrality). The survey protocol of the experiment did not call the respondents’ attention to the color of the pen being used by interviewers. Instead, interpretation was left up to the participant. The experiment yielded results suggesting that respondents may have derived meaning of the perceived sponsor of the study based on the visual cues (Bischoping and Schuman, 1992). Perceived or stated sponsorship of a survey can impact results, and the analyst needs to search for even minimal clues that can help establish limitations of a study (Figure 3A-5).
Is it clear who paid for the study? (five-star rating)
★
No. It is totally unclear who paid for the study.
★★
No. There are just a few clues but uncertain who may have contributed the money.
★★★
Maybe. There are a few names of individuals or organizations being linked to the study.
★★★★
Yes, based on what other people are saying, or indirect knowledge.
★★★★★
Yes. Source of financing is quite clear and publicly known.
Survey Research Team
High-quality surveys require specialized knowledge and training. Typically, a professional statistician is needed to determine an adequate sampling approach and to verify basic assumptions to determine whether a sample is likely to be representative of a population. Additionally, a survey methodologist (typically a professional with a social science background) is also needed to convert research questions into survey questions, organize the survey questions into a questionnaire, adapt the questionnaire to an adequate mode of data collection, and to make sure that the survey instrument works as intended in the planned mode of data collection (for instance, face to face, on the web, or by phone) or if language translation is needed. Also, survey methodologists typically test the questionnaire’s rigor before launching the survey through conducting small tests like cognitive testing or usability testing or a pilot effort using a small sample.
A survey plan along with a manager is needed to coordinate the field work, develop recruitment materials, hire field interviewers, software programmers, and field supervisors. After finalizing the data collection work, a team is needed to feed data into a statistical program (if the survey was conducted on paper-based instruments) or check for possible logic programming errors in the data (if the data were collected using some form of programming). A robust quality assurance plan is also needed to minimize potential human error throughout the process. Once a dataset has been created, a survey analyst (usually someone with statistical knowledge) needs to develop statistical adjustments necessary to prepare the data for analysis (one approach is to prepare weights to account for potential nonresponses or discrepancies in demographic characteristics relative to external benchmarks). Survey analysts are also needed to provide a basic review, create documentation of the dataset, and provide a minimal interpretation of results.
The described activities can be centralized and conducted by one survey firm, or they can be contracted out across various groups. Just a few large organizations can unify all activities under one roof (for example, in the United States, organizations like NORC at the University of Chicago, Westat, RTI International, among others, can centralize all the work). Most survey organizations around the world, however, are smaller teams and have to outsource several of the activities mentioned above, especially the field work needed to conduct the actual data collection. As each activity requires specialized knowledge, it is helpful for intelligence analysts to have a minimal sense on whether just one large group is entirely responsible for all the work, or if multiple groups (like vendors) were needed to do the job, as well as the quality of such contactors. Quality control procedures are typically standardized across units in larger organizations,
while several groups (for instance vendors) may have different standards for quality.
Sometimes when there is high demand for data collection services (for instance, during election season or when major events are happening such as decennial censuses), the number of available companies capable of offering manpower services decreases, and so the quality of contractors varies. In other words, the few companies that can carry data collection operations may already be busy, opening the door to the use of less experienced vendors (such as local groups or university students) available to more established social researchers to conduct surveys.
Lack of information about who the research team is makes it harder to establish credibility for the study, thus making the rating score lower. On the opposite end, when the identity of the survey research team is known, the score on credibility can be higher (Figure 3A-6).
Is the team a known group of researchers? (five-star rating)
★
No idea who designed and implemented the survey.
★★
No. There is contradicting information on who conducted the study.
★★★
Maybe. There are enough elements to speculate who the team might be.
★★★★
Yes, but contact information was gathered only with some effort.
★★★★★
Yes. Survey research team is known and easily contactable.
Background of Survey Research Firm
The professional background of the firm or individual who ultimately takes responsibility for the design and analysis of the survey may serve as a resource to the intelligence analyst for measuring survey credibility. The intelligence analyst may want to check what is known about the survey firm. While many of the intricacies about the financing of a survey are harder to establish (at least based on publicly available information), a simple check on the professional credentials of those responsible for the survey may be a good start. Individuals with an academic or training background that is not consistent with public opinion research are likely to raise concerns.
Obviously, there are individuals with longer professional trajectories and individuals who are less established, but individuals with experience in the field of public opinion research are usually known to their peers, have university degrees consistent with social or statistical science, have been practicing survey research for a long time, and may have a public record of survey publications.
Survey researchers committed to data quality tend to share experiences, lessons learned, and maintain a dialogue about methods with other survey research colleagues in various forms, ranging from informal exchanges to professional conferences. Regardless of their level of seniority or experience, a survey researcher who is seriously committed to high-quality data is usually part of major professional organizations (local, regional, national, or international).
Individual membership in professional organizations dedicated to survey methodology are a good gauge of a commitment to survey quality. Examples of major professional international organizations are the World Association for Public Opinion Research, the International Statistical Institute, the International Association of Survey Statisticians, the International Sociological Association, the European Survey Research Association, and ESOMAR (formerly the European Society for Opinion and Marketing Research), just to name a few. There are international survey research programs that can also help to understand the landscape of transnational public opinion research: the World Values Survey, the Latinobarometer, Eurobarometer, Asiabarometer, Afrobarometer, the European Social Survey, the European Values Survey, and the International Social Survey Programme, among others (Smith, 2014). Lastly, there are regional or national organizations with missions similar to those of the organizations mentioned here. To the extent that those local organization are consistent with the mission and scope or larger organizations, they can also serve as local scouts that can gauge the professionalism and commitment of other survey agencies or researchers. Those individuals or organizations with a known and respectable background may score higher in the five-star rating tool, making a survey more likely to be credible (Figure 3A-7).
Is the reputation of the survey agency known? (five-star rating)
★
No, no one seems to know anything about the survey organization.
★★
No clear record exists, but based on the few known elements, they don’t seem to have the right competencies.
★★★
Maybe. The organization is neither specialized in public opinion nor new.
★★★★
Yes. The survey organization is affiliated with professional associations and is not new.
★★★★★
Yes. They are well known, they have good reputation in general, and they publicly report results.
Reporting and Dissemination
The character and form of a dissemination outlet also provide informal cues about the sufficiency of survey quality for the type of statistical inference the survey intends to support, and this can increase the perceived credibility of a survey (Figure 3A-8). Commonly, survey research groups distribute periodic reports in the form of electronic newsletters, self-published reports on their website or news articles. Survey researchers who author newspaper articles may offer a good description of the survey methods, results, and their limitations. The more credible reports are those disclosing enough information to assess the results. There is no set of standard points universally accepted on what media outlets should check on before accepting an article based on survey results. Typically, news articles rely on what the survey researcher may want to discuss.
Is the description of how the study was conducted clear? (five-star rating)
★
No one seems to know anything about the survey organization.
★★
No clear record exists, but based on the few known elements, they don’t seem to have the right competencies.
★★★
Maybe. The organization does not specialize in public opinion, nor is it new.
★★★★
Yes. Survey organization is affiliated to professional associations and is not new.
★★★★★
Yes. They are well known, they have good reputation in general, and they publicly report results.
In 2019, a major news organization in the United States, CNN, promulgated a list of minimal requirements that need to be met before a story is accepted for publication: CNN’s Transparency Questionnaire, a list of 16 questions to be used in assessing a survey’s quality.3 While the list was developed for reporting in the United States, it provides helpful points for evaluating the quality of surveys presented in media reports that apply transnationally. Several of those points have been already covered in the present document. Not all media outlets around the world will have or care about standards, but at least the CNN list gives intelligence analysts a sense of common quality standards for reporting used by journalists.
___________________
3https://www.cnn.com/2019/07/09/politics/read-cnn-transparency-questionnaire-polling/index.html.
In situations where survey authors do not produce an article to discuss results, the analyst may consider contacting a survey agency to learn more about the results. In fact, it is quite common that survey researchers are contacted by various groups—undergraduate and graduate students, college instructors, elected officials, people in Congress, reporters—wanting to learn more about the study. Unlike the questions that these groups typically ask, the intelligence analyst may be better served by asking the survey agency how to interpret the results and understand the limits of the conclusions. In other words, it is helpful when those who created the survey discuss their own limits and offer a more realistic and pragmatic view of the results. While legitimate survey researchers may not publish exhaustive lists of every single survey shortcoming in their reports, they are willing to help understand the survey limits when asked. Intelligence analysts are encouraged to approach survey researchers and obtain their direct reading and interpretation on their own survey results. It is also advisable to consult with a few other public opinion experts on the interpretation and limits of the results. When at least two out of three survey specialists concur on the quality of an inference from a study, then the intelligence analyst may consider giving credibility to the survey.
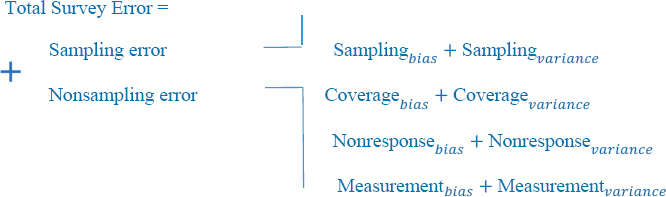
TECHNICAL INFORMATION: A TOTAL SURVEY ERROR ASSESSMENT
Technical and scientific survey aspects can help the intelligence analyst to assess the soundness of the data. It is important to remember, then, that survey research is guided by statistical and methodological principles, conceptual notions, and theoretical knowledge as well as practical and subjective experiences. Since the goal for any informed analyst is to understand the science behind surveys, they need to equip themselves with concepts that are used by survey methodologists. Such theoretical framework is known as total survey error (TSE).
Survey methodologists who strive to minimize survey error in their studies as comprehensively as possible tend to organize their sampling strategies and data collection rationale around TSE. The TSE concept is a theoretical framework that aims to identify and describe the sum of possible errors and provides a way to discuss trade-offs in survey research. Some of the TSE elements are more quantifiable than others, but the overall conceptual notion is very helpful. Unfortunately, public opinion studies (including high-quality surveys) do not always document such sources of error to make them immediately obvious, so the intelligence analyst needs to make sure they ask the right questions.
The Total Survey Error Paradigm
TSE has four fundamental components: sampling, coverage, nonresponse, and measurement error. Each of these elements is composed of two aspects that help to further understand sources of error: bias and variance. Bias is defined as a systematic departure of our survey estimate from the ‘‘true’’ population value, and such departure can occur in a particular direction. Variance is defined as the uncertainty introduced in our survey estimate to represent the ‘‘true’’ population value (Bautista, 2012; Groves and Lyberg, 2010; Weisberg, 2009). Examples of bias and variance are described throughout this section.
Typically, public opinion studies report only one source of error: the “sampling error” associated with the study commonly presented in percentage points also known as the margin of error. Nonsampling error sources, by contrast, are often neglected and underreported. While the sampling error provides helpful information to understand the limitation of a survey for inferential purposes, it may be limiting to fully assess survey results, as the sampling error is just one of several other sources of error. In other words, even when a study’s margin of error may be relatively small, it does not mean that the survey error is small. Thus, TSE needs to be understood by an explanation of each and all of its parts: bias, variance of sampling, and nonsampling sources of error (Figure 3A-9).
Sampling Error
The sampling error stems from the fact that a survey is not based on an entire census of the population of interest. It instead focuses on a fraction of a population (a sample). Sampling approaches are typically divided
into probability and nonprobability methods for sampling. The probability approach supports statistical inferences about the population based on parametric statistical theory and allows calculation of a theoretical margin of error. Nonprobability approaches allow more flexibility in some situations but do not directly support statistical inferences about a population (some theoretical assumptions are not testable). In this section on sampling error, we first review the probability approach and then we briefly discuss the nonprobability approach.
Probability Sampling
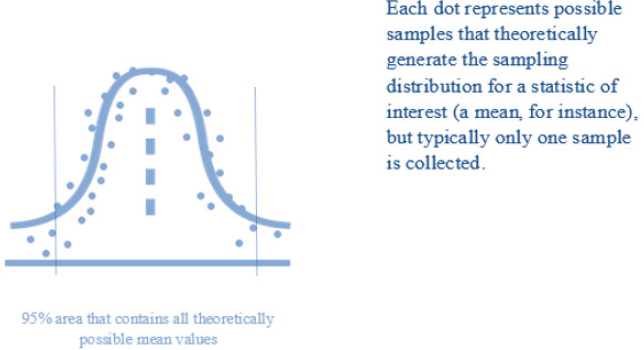
Survey methods that rely on a random selection of individuals are designed to support inferential statistics. Probability studies that can be generalized to the entire population of interest report confidence levels and boundaries for error. Relative to nonprobability approaches, the main differentiation is that probability methods are based on statistical theory that allows more clear estimates of the sampling error associated to them. Inferential statistics is based on the idea of multiple, repeated possible samples from the same population. The theoretical distribution of all possible samples (out of which a statistic of interest such as a mean is estimated) is the basis for estimating the possible sampling error. This potential variability in possible samples is known as the standard deviation of the sampling distribution (Figure 3A-10), which in turn is the basis for calculating the sample variance (and standard errors). Such variance allows the computation of the theoretical margin of error in a survey. The statistical theory behind the calculation of a margin of error gives us statistical confidence that results support inferences about the parameter of interest, even when the
sample that we happen to be observing does not sit exactly in the middle of the sampling distribution (Kalton, 2020; Lohr, 2021). In other words, even well-designed surveys can yield estimates that may not be right at the center of the theoretical sampling distribution and yield seemingly “unsound” results why is which a margin of error is calculated.
Inferences based on probability samples are possible because members of a population have a known, non-zero probability of being selected, and they are chosen at random. In probability studies, the type of sampling strategy and (lack of) proper weights may define the bias and variance in a result. A bias might occur, for example, when public opinion studies disproportionally select subgroups in the population to represent certain groups or regions. Let’s say a hypothetical survey obtains a representative sample of the country of Mexico, and the survey has 500 interviews from Mexico City, and 500 cases from the rest of the country (a total of 1,000 cases). In this hypothetical study, the researcher systematically oversampled individuals from Mexico City. To be able to make appropriate inferences for the whole country (that is, to have unbiased results), the base weight needs to account for the sample strategy, that is, whether the case came from Mexico City or the rest of the country. In other words, the 500 cases from Mexico City can be representative of Mexico City themselves, but to make an inference about the entire country based on the 1,000 collected interviews, the 500 cases coming from Mexico City need to be weighted down so they reflect the appropriate probability of selection. If they are not weighted down, the Mexico City cases will contribute too great a weight to the overall estimate, leading to results that are biased toward Mexico City.
In probability surveys, the number of cases and other factors such as the variance of the weights determines the margin of error. The general notion is that the higher the sample size, the lower the margin of error will be. At the same time: the intelligence analyst needs to keep in mind three important aspects: (a) the relationship between sample size and margin of error is not linear, (b) the size of the population typically does not have a major influence on the decision about sample size, and (c) a study with a large sample size also means a more challenging field operation. Figure 3A-11 shows the relationship of sample size (x axis) versus the margin of error (y axis). Typically, an increase from, let’s say, 400 cases to 1,000 cases means a reduction in margin of error, since the margin of error associated with 400 cases is +/–4.9 percent, and for 1,000 cases it’s +/–3.1 percent under simple random sampling and a 95 percent confidence interval. The relationship shown in Figure 3A-11 holds irrespective of the size of the population. There are other more advanced sampling techniques that incorporate stratification and clustering, which affect the properties of the margin of error. Survey designs that involve dividing the entire population into mutually exclusive segments (strata) and collecting data based on natu-

rally occurring groups (clusters) are based on multistage stratified cluster sampling techniques. The more advanced sampling techniques are typically referred to as complex random sampling and aim to have better (lower) bias and variance properties (see Lohr, 2021).
Regardless of the sampling technique, whether simple or complex, the gains in a margin of error resulting from a bigger sample quickly decrease to the point that there is just a marginal difference. For example, the difference between a study of 2,500 cases (+/–2.0 percent) and a study of 5,500 cases (+/–1.3 percent) is less than 1 percentage point under simple random sampling. More importantly, a data collection operation with many more cases requires more careful supervision of the field work and more support for the field staff. For studies that are not carefully planned or executed, a large sample size may mean having higher chances for greater error (including fabrication or falsification of interviews and inadequate field supervision). Sometimes, it is preferable to have a carefully conducted and supervised study of, let’s say, 800 cases than a rushed and poorly supervised study of 8,000 cases. This is not to say that studies with large sample sizes are always low quality. A study may aim to measure subregions in a country or subgroups in the population (for example, 800 interviews per state in a country with 10 states may result in a study of 8,000 cases), and this can be carefully conducted to maintain high quality in the study.
At the other extreme, the analyst needs to be aware of questionable surveys that claim (or may collect) a high number of cases just for the sake of claiming a much lower margin of error in hopes of gaining greater public credibility. Such a claim does not always translate into a high-quality study. It is recommended that the intelligence analyst try to identify what may explain the motivation for a large sample size to assess the quality of a survey.
There are other important practical aspects that can profoundly affect the quality of a sample. They are related to the data collection process and range from lack of accessibility to remote villages (due to unmaintained rural roads) and gated residential communities in wealthy neighborhoods to more extreme safety issues, threats, and violent attacks on field staff. An example of the latter happened in 2015 in the town of Ajalpa, Mexico (a town in the Puebla State, which is plagued by gang violence and a lack of public safety). Two interviewers conducting data collection for a study about tortilla consumption were accused of asking a lot of questions to families. A few misguided town residents confronted the interviewers, accusing them of being kidnappers who had come to town to abduct children off the streets. The angry residents called for their immediate public lynching. A mob of hundreds gathered quickly and self-constituted as judges. Sadly, in a matter of less than 2 hours the mob decided to set the interviewers on fire (Ahmed and Villegas, 2016). These actions were condemned by the international survey industry and left a lasting impact in the survey research industry in the country (WAPOR, 2015), eroding the morale of interviewers and making it difficult to safely conduct their jobs.
In theory, then, probability-based public opinion studies are better positioned to support statistical inferences relative to nonprobability sampling. In practice, there are extremely important considerations that may challenge the theoretical assumptions. It is equally important to seek information on both the sampling design as well as the practical conditions under which the survey was conducted. Figure 3A-12 provides some key questions that can help guide the research inquiry.
Nonprobability Sampling
The nonprobability approach may be helpful in certain circumstances, but it does not lend itself to an estimation of error in the same way that probability studies do. In general, the most reputable and scientific public opinion surveys are based on probability samples around the world. Nonprobability methods are nonetheless helpful when costs for a probability survey are discouragingly high, when insights enrich contextual information (for example, tracking sentiment on social media, conducting community research, interviewing elites, or observing increases in participation in public demonstrations), or when there is no easy access to the population of interest such as hard-to-reach populations (Vehovar, Toepel, and Steinmetz, 2016). Let’s briefly discuss nonprobability methods and then discuss probability methods for sampling.4
___________________
4 For more details on nonprobability methods, please see the companion paper “Alternatives to Probability-Based Surveys Representative of the General Population” by Ashley Amaya, provided later in this Analytic Framework.
Was the survey conducted based on probability sampling? (five-star rating)
★
No. The study is clearly based on nonprobability methods.
★★
No, but it mimics probability sampling (quota sampling), or the sample looks too good to be true (unrealistic large sample size).
★★★
Maybe. Study combines probability and nonprobability data, possibly when involving hard-to-reach populations.
★★★★
Yes. It’s clear that probability sampling was used but unclear on statistical weighting. Too much uncertainty.
★★★★★
Yes. Clearly, probability sampling and reasonable statistical weighting (based on relevant variables) were used.
Public opinion sampling methods that are not based on a probability mechanism such as random selection are usually referred to as nonprobability sampling. Nonprobability sampling usually relies on adjusting estimates based on statistical procedures (weighting) and an assumption of distributions in the population (these approaches are also known as model-based sampling approaches). The assumptions about weights in probability samples are different than in nonprobability samples. In nonprobability studies, there is no sampling base weight calculated on the inverse of the selection probability of a sampling unit (as is the case in probability methods). Examples of nonprobability methods are “purposive sampling,” “snowballing,” “respondent driven sampling,” and “quota sampling.”
Purposive sampling is also referred to as “expert sampling.” It relies on judgments about what a subject expert can deem a representative sample of the population of interest. A survey researcher, for example, may know that certain neighborhoods in a city do not experience changes in party preference frequently, while other neighborhoods have more volatile preferences. The researcher may choose to focus on the latter neighborhoods, selectively choosing “representative” blocks and conducting interviews in that area to measure voter intention. Quantifying the amount of error in purposive sampling may not be entirely possible, as the mechanism does not rely on probability sample. In other words, the studies based on nonprobability methods are frequently only representative of themselves (Etikan, Musa, and Alkassim, 2016).
Snowball sampling is a strategy for recruiting participants from networks, whether in person or by electronic form. A researcher may ask a few individuals from the target population to participate in a study and then help invite other members in the population to gather more sample along the way. Respondent-driven sampling (RDS) is a more formal way of conducting snowball sampling. RDS usually starts with a subjective sample of individuals who are part of the population of interest and then attempts to develop a probability sampling mechanism based on social networking, as well as the probability of selection weights. This method aims to derive conclusions for groups that are linked through social networks. It assumes that most of the individuals in the population of interest are connected to others through networks (they are not “isolates,” in other words). The RDS approach starts with respondent “seeds” who are known to the researcher already. These initial respondents are then asked to nominate people in their network and to provide contact information for other individuals and information about the size of their network. The network information is used to estimate the respondent’s relative contribution and create survey weights. These weights are used to generate population parameters for the target population (Biernacki and Waldorf, 1981). While RDS could be a helpful technique, it is not as accurate as it is generally acknowledged to be (Goel and Salganik, 2010).
Quota sampling is a common technique used by survey researchers to reduce costs and provide timely results. It bears some resemblance to probability surveys in that it attempts to generate a sample that looks closer to known population benchmarks, the difference being that quota sampling is a nonprobability method (Gorny and Napierala, 2016). Studies based on quota sampling may start with a random selection on geographical units (municipalities or election precincts in a city, for instance), but the data collection protocol tries to identify a certain number of cases per demographic groups. The study follows a protocol defined by the survey researcher in advance. A quota sampling study based on in-person interviews, for example,
may ask interviewers to select respondents based on age and gender instead of using a random selection mechanism not controlled by the interviewer. Interviewers are tasked with filling pre-established quotas until the desired number of interviews are completed. At the end of the study, the final demographic composition is likely to look very similar to the distribution of cases in the population, but the problem is that the selection of cases was not based on a random protocol; it was left up to the interviewer to decide. Interviewers may have selected cases that were more willing to voice opinions in a survey. This subjective selection challenges the assumption of random sampling and limits the ability to draw statistical inferences with confidence. When a survey uses a within-household respondent selection procedure that is not based on probability principles (such as the quota sampling approach described here), the quality of estimates is likely to be downgraded, and the analyst may assign a lower rating to the study in question.
There are nonetheless situations in which quota sampling may represent an opportunity to study public opinion in under-researched populations. It is well known, for instance, that there are many restrictions in China on conducting public opinion research, but China offers more flexibility to conduct market research. A group of researchers at Hong Kong Polytechnic University conducted two quota-sampling surveys in mainland China between 2018 and 2021. Their objective was to understand engagement and behaviors on social media platforms like Weibo or Wechat with political connotations (e.g., critical and satirical social media comments) among Chinese citizens with online presence (“Chinese netizens”). The researchers implemented an online survey utilizing an online market research panel through quotas based on gender, age, educational level, income, and province. They replicated in the survey questionnaire possible behaviors on social media (recommending, reposting, or skipping certain opinion comments). While their study may not have allowed full inference about the Chinese population, it provided important insights on political behavior in social media environments (Wong and Liang, 2021).
There are circumstances that merit a mix of probability and nonprobability methods. These situations are usually encountered when researchers try to study hard-to-reach populations, such as immigrants, homeless individuals, those resisting an established authority, ethnic minorities, individuals in extreme poverty, survivors of domestic abuse, individuals diagnosed with a new disease, individuals engaged in illegal activities, and individuals with a particular language. For these groups, strict probability surveys may not be entirely feasible or possible. It is thus advisable for the intelligence analyst to understand the motivation to produce use combined methods, as not all studies of hard-to-reach populations are the same (Kalton, 2009).
A study conducted by RAND, for instance, aimed to measure mental health issues among Cambodian immigrants. The target population for the RAND’s study was primarily refugees who had lived in Cambodia during the Khmer Rouge era—a radical communist movement that ruled Cambodia from 1975 to 1979—and emigrated to the United States prior to 1993. Researchers of the study developed a method by which a community expert would first rate the likelihood of households to contain immigrants (along with supplemental information available to survey researchers). The study was conducted from 2003 to 2005 in the Khmer language. The sampling method allowed to draw more efficiently a sample of individuals living in Long Beach, California, the largest Cambodian refugee community in the United States. Households with lower chances of having a Cambodian immigrant were sampled at a lower rate, and households with higher chances of having an immigrant were sampled at a higher rate. While there was an “expert” identifying whether a household had high or low chances of having an immigrant, all households in the area had a chance of being selected (there was no systematic exclusion from the selection process). Participants who were ultimately selected into the study were just weighted at a different rate. Such an approach would support conclusions for inference to the population of this hard-to-reach population (Himelein, 2016).
There are other nonprobability methods that have been developed in more recent years and continue to evolve such as random device engagement, river sampling, and assisted crowdsourcing, among others (Papadakis, Rothschild, and Konitzer, 2018; Pollfish, n.d.), that aim to support data collection based on web-based online surveys. Such methods are beyond the scope of the present document, but the analyst needs to be aware of them and understand their limitations. The analyst is encouraged to learn more about them.
Coverage Error
A key component in probability sampling is the sample frame. An ideal sample frame covers the target population entirely, which in practice may not happen. The frame provides the sample units that need to be selected for a study (technically called “primary sampling units”). Sample frames vary in form and quality by country. In Japan, for instance, there are administrative lists maintained by the government that researchers have used as a sample frame: the Basic Resident Register and the Voter Registration List. These lists include names, gender, addresses, and date of birth from individuals throughout the country. These lists are maintained at the city, town, and village level (Yamada and Synodinos, 1994; Tsuchiya and Synodinos, 2015). There are other studies that do not have access to such detailed information. For example, a survey of randomly selected Israeli Arabs
(a minority in a conflicted society) conducted in Israel in the early 2000s utilized the 1995 census information made available to survey researchers by the Israeli Social Science Data Center at the Hebrew University of Jerusalem, which was supplemented by the official list of eligible voters and Central Bureau of Statistics records. This information (organized by region, municipal status, and composition of population group) was the basis for selecting localities as primary sampling units under a multistage stratified sample (Gordoni and Schmidt, 2010).5
When some members of a target population are systematically excluded from the sample frame, there is a risk of coverage bias. Coverage bias can occur in two forms, as over-coverage (when there are units in the sampling frame that do not belong to the target population) and under-coverage (when the frame is incomplete and misses important parts of the target population). Undercoverage is far more problematic than over-coverage (people without phones, for example, being excluded from a phone survey), since over-coverage can be addressed easily by excising redundant sampling units. Under-coverage, which is more challenging, is frequently addressed through the combination of multiple sample frames. Combining several frames, nonetheless, requires estimation of a joint probability of a sample unit belonging to several frames. Obviously, the combination of frames assumes the existence of multiple sample frames. Often, in practice, new sample frames need to be developed, which can be costly and time-consuming (Brick, Cervantes, Lee, and Norman, 2011). A study based on multiple frames requires the creation of special selection weights, as there is an increased uncertainty in results associated to the possibility of selecting the same unit multiple times; as such, the level of theoretical variance increases for the study (Figure 3A-13).
There are trade-offs around the selection of sample frames. A hypothetical survey researcher, for example, may want to conduct a telephone survey in a country in which neither landlines nor cellphone telephone numbers perfectly cover the entire territory. The researcher may aim to produce unbiased estimates using a dual-frame sample approach (landlines and cellphone numbers) at the expense of higher variance (variance being due to the multiple-selection weights). Another hypothetical researcher in the same country may decide to reduce the variance by not using multiple frames and focus only on a single frame for the study (excluding parts of the population). There are researchers who prefer to disclose the limits of a study (that is, recognize that they use a single frame) and avoid the need to develop multiple sample frames.
Decisions on sample frames are frequently based on practical field conditions and costs. In that sense, just because a sample frame is based on
___________________
5 For a more recent example, see https://www.pewresearch.org/fact-tank/2016/03/08/keyfindings-religion-politics-israel/.
Did the study use an adequate sample frame? (five-star rating)
★
No. The study was not based on a clear sample frame.
★★
No, but the study attempted to develop an ad hoc sample frame. Not a lot of details were ava.
★★★
Maybe. The frame is incomplete or dated, and is likely to be biased or too uncertain.
★★★★
Yes. The sample frame looks good, and clearly reports its limits.
★★★★★
Yes. The sample frame is very reasonable to cover the target population.
geographic information like household addresses does not mean the study is automatically better than, say, a telephone survey or even an internet survey. In high crime areas, for instance, respondents may not be willing to answer the door to a stranger (i.e., an interviewer), or interviewers may not want to visit the area due to safety concerns. Perhaps both interviewers and respondents have concerns such as public health conditions, as in the early months of the COVID-19 pandemic in 2020. In such situations, survey interview respondents may be more easily reached with a phone call without having to spend a lot of money in a communication campaign to create an awareness of the study or to develop protocols for a safe interviewer-respondent interaction. Similarly, just because a phone call is a more convenient form of communication does not necessarily mean that a telephone survey offers better coverage than an area probability survey. Social context and practical conditions in a country frequently influence
researchers’ decisions about sample frames, and the analyst needs to investigate and assess the reason. Analysts need to identify the trade-offs made by survey researchers on a sample frame used to represent a population of interest. Understanding why a researcher chose a certain sample frame provides insight that can help determine what kind of statistical inference can be made.
Nonresponse Error
Probability sampling theory relies on having a representative sample selected through a random mechanism. When the sample size is reduced at random, the uncertainty, or the variance translated into standard errors and then converted into margin of error, increases. When the sample size is reduced due to a systematic reason, there is a risk for bias. To understand nonresponse and its effects, it is helpful to know how it is studied by survey researchers. The survey literature has classified nonresponse in three major categories (which are accepted by several professional organizations): (a) noncontacts (when the respondent can’t be located), (b) refusals (when contact was made with the selected individual, but the respondent declined to participate), and (c) other reasons (such as language barriers, health issues, or death) (Groves and Couper, 1998; Singer, 2006). In that sense, nonresponse due to lack of contact is usually about an individual’s inaccessibility or unavailability, that is, contactability. Nonresponse due to refusal is about an individual’s willingness to participate. Nonresponse due to other miscellaneous reasons is usually due to some form of inability.
In some instances, the systematic reasons leading to nonresponse are clear and allow the identification of potential bias. If a survey aims to study literacy levels in a population, but the mode of survey administration is a self-administered mail survey, for instance, individuals with low or no writing abilities would not be able to participate. In this example, individuals are unable to participate even if they are successfully contacted and willing to do so, and this would lead to bias. In opinion surveys, the reasons for nonresponse are less clear and often mixed, but most of the time the reasons are related to respondent willingness. Regardless of whether nonresponse is due to contactability, willingness, or inability, the idea remains the same: When there is a systematic relationship between the statistic of interest and nonresponse, there is a chance of a biased result (Figure 3A-14). Establishing the systematic effects of nonresponse is hard, and analysts could draw from previous literature or theory to understand the impact of nonresponse on survey estimates (as it is discussed in the following paragraphs).
Several professional organizations provide standardized ways of calculating response rates, which usually make use of the three elements described in the previous paragraphs. Many international organizations
Does the study discuss issues of nonresponse? (five-star rating)
★
No. Nothing is known about issues of nonresponse.
★★
No, but the study provides some elements to get a sense of the level of nonresponse.
★★★
Maybe. The study reports response rates but nothing else.
★★★★
Yes. The study offers some insights on the level of nonresponse.
★★★★★
Yes. The study offers an analysis of potential limitations due to nonresponse.
follow definitions proposed by the Council of American Survey Research Organizations and the American Association for Public Opinion Research.6 While a response rate is helpful in understanding levels of survey participation in a study, it should not be taken as direct measure of survey quality. It is often more helpful to gain information about the potential reasons that may have caused the response rate in a study than the rate itself.
Admittedly, it is not always possible to clearly establish the relationship between nonresponse and the statistic of interest (Groves and Peytcheva, 2008; Groves et al., 2006). Nonetheless, examining individual elements may shed some light on the reasons for nonresponse. Examining aspects related to contactability, for instance, may help to partly understand non-
___________________
6https://www.aapor.org/Education-Resources/For-Researchers/Poll-Survey-FAQ/ResponseRates-An-Overview.aspx.
response. Contactability aspects refer to the issues related to the inability to locate the selected individual for a survey, the individual being too busy at the time of contact to participate in the survey, or a lack of technological means for reaching the individual (such as telephone service, internet access, email account, city-style residential address). Aspects related to willingness to participate are somewhat different, and they include perception of the study topic (e.g., as unexciting or sensitive, concerns about privacy; perceived lack of study legitimacy; general antipathy to surveys; hostility toward the government; perceptions or views about the sponsor; crime rates; fear of strangers; cultural, religious or political circumstances; and intergroup differences. The unwillingness to participate can take two forms: unit nonresponse and item nonresponse.
Unit Nonresponse
This occurs when some selected individuals choose not to participate in the entire survey. To minimize unit nonresponse, survey researchers usually develop strategies that rely on recruitment materials explaining the purpose of the survey, delivering small gifts, offering several modalities to participate (phone, web, postal survey, or in-person), and offering monetary or in-kind incentives. These strategies may have different levels of success depending on contexts.
Despite best efforts, nonresponse is likely to occur in any survey, as there is evidence for a decline in survey participation around the world (De Heer and De Leeuw, 2002; Luiten, Hox, and de Leeuw, 2020). The issue of unit nonresponse is typically addressed through statistical weighting.
Intelligence analysts need to be cognizant of the fact that survey weighting may help reduce the potential bias when or if the demographic variables used for weighting are related to survey participation and the statistic of interest (Kalton and Flores-Cervantes, 2003; Kalton, 2020), but weighting can introduce more uncertainty to the estimates in the form of added variance. Indeed, the effect of weighting on the statistic of interest is calculated through what is known as weighting design effect, which is essentially the impact of differential probabilities on the estimate throughout the survey selection process (Henry and Valliant, 2015; Spencer 2000). The weighting design effect is further affected by another design effect called sampling design effect, which comes from the use of strata and clusters in complex random sampling (West and McCabe, 2012). When the design effect (the “deff”) is 1, the variance is similar to one obtained under simple random sampling. When the overall design effect is greater than 1, though, the precision of the estimate is likely to decrease (in other words, the variance is likely to increase). It is rare when public opinion surveys report the deff for a variable of interest, but when they do, the deff can be taken as a positive
signal of a study that aspires to be transparent about its limits. The analyst may want to use the deff as an additional piece of insight to understand uncertainties about a public opinion survey.
In recent and advanced methodological discussion around nonresponse (and how to address it), response rates are becoming less relevant, and the notion of representativeness is starting to become more relevant. Representativeness measures how successful the survey has been at representing subgroups of the population based on probability mechanisms and not predefined quotas. The criticism to assess surveys based on response rates is that it is relatively simple to increase response rates, since a researcher may collect data from the “easy cases” (individuals willing to participate), and then rely on substantial weighting to bring demographic distributions to conform population controls. This creates, however, a clear risk for nonresponse bias. In other words, a response rate should not be taken as an indicator of survey quality (for example, a response rate of 60 percent does not necessarily mean that it has superior quality over a survey with a response rate of 40 percent). Also, recent research suggests that sometimes a higher propensity to participate may lead to measurement error (Bach, Eckman, and Daikeler, 2020).
Recent survey studies have started to utilize methodological tools that rely on real-time monitoring of sample composition. These tools are known as “response indicators” or r-indicators and are based on predictive modeling of survey participation (based on key predictors such as region, age, gender, marital status, employment status, health insurance, and homeownership status) while the survey is in the field (Bethlehem, 2012; Schouten, Cobben, and Bethlethem, 2009; Wagner, 2012). The idea is to selectively intervene depending on whether the survey is falling short on certain demographic subgroups. The types of interventions during the period of data collection can range from more aggressive monetary incentives to tailored recruitment materials for certain subgroups, the subgroups likely to be underrepresented in the sample (Schouten and Shlomo, 2017). These are ideas that show promise as tools to address survey nonresponse. The notion of r-indicators is provided here to give the analyst something with which to navigate the gathering of intelligence around nonresponse, but the information and resources needed to develop predictive modeling (and real-time intervention) is not the same across countries at this point in history, and it is not a common feature in international public opinion studies.
Item Nonresponse
This occurs when respondents do not provide a response to a specific question. This is another source of error that can occur either systematically (bias) or at random (variance). Some survey items may experience higher
nonresponse expressed as “don’t know,” “can’t choose,” “prefer not to answer,” “I don’t remember,” or simply skipping the question on web surveys. When a question has a high item nonresponse rate, it may be signaling that the survey question may be too sensitive or too complex to answer, lack the expected response choices, show unfamiliarity with the topic, use poor wording, or seem to want to elicit undesirable answers. Some of these item nonresponse issues are anticipated by survey researchers and resolved through the improvement of the questionnaire using psychological and cognitive theory (discussed below).
Survey researchers commonly address the issue of item nonresponse through statistical methods. One simple approach is to only use respondents who provided a response in the analysis. This approach is usually known as list-wise deletion. Using only the answers from participants who systematically provided a response, though, risks over- or under-estimation of a statistic of interest (bias). There are other better statistical methods used to address item nonresponse, and they can be classified as class weighting, single imputation, and multiple imputation methods.
Class weighting (a form of basic modeling) attempts to reduce bias. Class weights are weights applied to cases on top of the weights outlined in Figure 3A-15, which further increases the variance. Single and multiple imputation approaches rely on assigning plausible imputed values to missing values that were not collected. Multiple imputation methods predict the probability of responses being missing and estimate plausible values for the unobserved data based on the observed survey data and auxiliary data that might be available from the sample frame. Unlike class weighting and single imputation methods, multiple imputation methods already consider the uncertainty (variance) associated with the fact that actual data from nonrespondents were not collected.
- Base weights
- Eligibility weights
- Nonresponse weights
- Post-stratification weights
In the imputation theoretical framework, missing data are assumed to come from a distribution that is modeled using available information to recreate the correlation structures of the analyzed data (Little and Rubin 2019; Rubin, 2004). Compared with the list-wise deletion approach, class weighting and single imputation methods are theoretically superior since they take some practical steps to address data missingness, but multiple imputation is superior to single imputation. The intelligence analyst may nonetheless see the use of list-wise deletion approaches in reports more frequently than the use of single or multiple imputation methods.
Measurement Error
The notion of measurement error is based on the difference between a true value and an estimated value. Measurement error occurs when the survey measure (i.e., the survey question) does not measure the intended construct of interest. This can systematically produce bias if, for instance, there is a leading question steering respondents in one direction, or randomly increase the variance if, for instance, a survey question is so ambiguous that it is unclear how participants interpreted the question. In general, it is easier to assess measurement error for factual questions than it is for subjective questions. Questions about the number of visits to the family doctor in a year, family income, the number of children, age, education, ownership of a smartphone are constructs that can have an external source for validation. This measurement error assessment is more difficult to quantify for nonfactual information, although there are methods that have produced scholarly research geared toward accomplishing this (Alwin, 2007).
Measurement error is more challenging to assess when interpreting results of subjective questions, such as questions on opinions, attitudes, motivations, beliefs, culture, religion, fears, anxieties, political preferences, ideology, and group identity. While it is not a straightforward task, features of the survey design can help the analysts review the potential for measurement error. The typical sources of measurement error stem from (a) aspects of questionnaire design (such as type of questions, question phrasing, response options, survey instructions, order of questions), (b) the questionnaire format (self- or interviewer-administered), and (c) the method of survey administration (face-to-face, mail surveys, computer-assisted telephone interviewing or CATI, Short Message Service or SMS, internet, automated interactive voice response, outbound automatic robocalls, social media platforms like Twitter and Facebook, and redirected inbound call sampling; see Figure 3A-16).
- Questionnaire design
- Type of question
- Phrasing of questions
- Type of response options
- Order of questions
- Questionnaire format
- Self-completion
- Interviewer-administered
- Respondent and interviewer characteristics
- Method of survey administration
- Face-to-face
- Mail surveys
- Computer-assisted telephone interviewing (CATI)
- Short Message Service (SMS)
- Internet (web-based)
- Interactive Voice Response (IVR)
- Outbound Robocalls
- Social media (e.g., Twitter, Facebook)
- Redirected Inbound Call Sampling (RICS)
Questionnaire Design
The questionnaire is the piece that links the survey researcher with the respondent, and the questionnaire represents a kind of “conversation” between the two parties about a particular topic, but a lot can happen in between. Questionnaires have multiple pieces including instructions to programmers (if it is an electronic instrument), visual elements (such as showcards in paper-based instruments or screen design on electronic surveys), instructions to interviewers (if it’s interviewer-administered), instructions to respondents, transition statements, response options offered to capture answers (which can take different forms depending on whether
the question is presented as open-ended or closed-ended), and the order in which questions were presented (known as context effects). Variations to these elements can produce different results even when the rest of the survey design elements remain the same.
Researchers from the European Social Survey (ESS), for example, designed an experiment to document how changes in question wording produce different results in expressed attitudes toward gay men and lesbians. Fielding an experiment in Portugal, Hungary, and United Kingdom in 2015, ESS researchers administered three versions of the same question to different respondents. The introduction script was the same for the three versions of the question: “To what extent do you agree or disagree with each of the following statements?,” but the test statements were slightly different. Version 1 said, “Gay men and lesbians should be free to live their own life as they wish”; version 2 said, “Gay men should be free to live their own life as they wish”; and version 3 said, “Lesbians should be free to live their own life as they wish.” Analysis of the experiment showed that respondents expressed more positive attitudes toward this construct in version 3 (“lesbians”) than in version 2 (“gay men”) or version 1 (“gay men and lesbians”) (Kuyper, Sommer, and Butt, 2018).
Some questions are just too sensitive in certain contexts to be asked directly to respondents. In those cases, there is a chance that respondents will not provide candid answers. In 2008, for example, a group of political scientists investigated whether voters in Nicaragua had received gifts or favors in exchange for their votes during municipal elections. When the question was asked directly to respondents, about 3 percent of respondents admitted that they had received vote-buying offers, but when the question was measured indirectly using a technique known as “list experiment,” about 24 percent of respondents reported vote buying (Gonzalez-Ocanto et al., 2012). In general, sensitive questions can take multiple forms, and there are multiple methods that survey researchers can use to measure them including indirect questioning, randomized response techniques, item count techniques, nominative technique, forgiving wording, and endorsement experiments (Chaudhuri and Christofides, 2013). It is advisable that intelligence analysts take some time to find out whether questions presented in the questionnaire were sensitive and what methods were used to ask them. The more basic questions for analysts to guide their inquiries are presented in Figure 3A-17.
Cognitive Aspects of Survey Methodology
Another helpful theoretical framework to further study the cognitive, psychological, and communication part of measurement error is known as the cognitive aspects of survey methodology, or CASM. Survey methodolo-
Did the survey use unloaded questions? (five-star rating)
★
No. The study does not provide information on the questionnaire.
★★
No, but from the brief description of results and frequencies, the question wording doesn’t look good.
★★★
Maybe. The questionnaire is partially available and there is no clear presentation of question wording.
★★★★
Yes, the questionnaire is available but no discussion of measurement properties (that is, it is unclear whether directionality in the wording of some questions is intentionally).
★★★★★
Yes. The study offers an analysis of measurement properties of survey questions (that is, there is an explicit discussion on question wording).
gists rely on a 4-stage model to assess the psychology of survey response. This model proposes that respondents first try to make sense of the question wording (comprehension), then recall information from long- and short-term memory (retrieval), assess what information is relevant to deliver a response (judgment), and find response categories that express their response (mapping). Some problems related to questions are due to lack of question comprehension (faulty wording), but other problems crop up because questions are not easy to answer due to the reference period (memory erosion).
In other instances, the question was worded clearly and the memory of the event (or topic) is clear but the respondent is unsure whether to candidly report the information because of contextual elements. In still other instances, the respondent is willing to provide the information, but the response categories may not reflect well what the respondent wants to express. All these are forms of measurement error. The analyst is encouraged to review and use the four-stage model to understand the psychology of survey response to take a deep dive from the cognition and communication perspective (Tourangeau, Rips, and Rasinski, 2000; Willis, 2004, 2018).
Interviewing Format
Responses to survey questions can be affected by the presence (or absence) of an interviewer. If interviewers are present, they can help to motivate respondents to take the survey, explain the purpose of questions, clarify terminology, and thank them for their careful thoughts. At the same time, the presence of interviewers may present a barrier to truthful answers on sensitive questions, since respondents may experience some form of normative pressure to answer in a particular way. Female respondents, for example, may not feel comfortable disclosing sexual or drinking behaviors to male interviewers, and those survey items may either elicit a disproportionally high level of item nonresponse among women, capture insincere responses among women, or both. In that sense, interviewers may be a source of random (variance) or systematic error (bias), depending on the topic.
One typical household survey was conducted by the World Bank Group in the Southeast Asian nation of Timor-Leste to measure consumption-based welfare. The survey also included questions on access to justice (with similar questions to the Afrobarometer and Latinobarometer), as well as items on corruption, law and order, and women’s rights. Using advanced statistical techniques (multilevel modeling), a researcher affiliated with the World Bank studied respondent-interviewer interactions and found patterns suggesting that female respondents were more likely to be influenced by the perceived opinion of the interviewers than male respondents (Himelein, 2016). There is indeed a growing literature on interviewer effects suggesting that interviewer presence may have significant impacts on results. Such effects depend on respondent and interviewer characteristics such as race, sex, gender, perceived opinions, or affiliation (Mangione, Fowler, and Louis, 1992; O’Muircheartaigh and Campanelli, 1998). Obviously, determining interviewer effects takes considerable effort and resources, and intelligence analysts may not have all the necessary tools at their disposal (specialty statistical software or the luxury of time, for instance), but it would be worthwhile to ask those who conducted the survey to see if there
are reasons to believe that interviewer effects are a source of systematic measurement error in a particular study (Olson et al. 2020).
Method of Survey Administration
Intelligence analysts may want to check with regional survey experts which is the more prevalent mode of data collection in a specific country. But in general, at this point in our history, household surveys conducted with a face-to-face interviewing methodology continues to be a preferred method around the world relative to other forms of survey administration because it is thought to assure adequate coverage of the population. While face-to-face surveys may allow researchers to verify addresses and motivate respondents to participate, survey researchers sometimes use other methods that are much faster and less costly and that minimize interviewer presence, therefore reducing measurement error due to the interviewer.
There are advantages and disadvantages to using methods other than face-to-face interviewing. Take the case of telephone surveys, which are based on probability sampling (known as random digit-dialing) and conducted based on computer-assisted instruments known as “CATI systems” (computer-assisted telephone interviewing). One advantage to CATI approach is that it allows telephone surveys to avoid direct interviewer presence in a respondent’s home and thus may provide a less intimidating way to collect information. Telephone surveys may still provide some interviewer presence to clarify terms in the survey, and facilitate the possibility to program more easily experiments with different question wording (and thus better assess measurement error due to phrasing). The obvious tradeoff is the limited population coverage, as there may be members of the target population that have neither a landline nor a mobile phone. Even if measurement error was reduced with a telephone survey, though, coverage error would increase.
There are other methods that may bring advantages to survey researchers depending on research objectives, but there are also trade-offs around them. Internet-based surveys, for example, may allow the use of graphics and animations that would be hard to produce in other modes such as telephone or paper-based instruments. Researchers from NORC at the University of Chicago and Argonne National Laboratories (operated for the United States Department of Energy by UChicago Argonne, LLC) conducted a survey to study public behaviors on evacuation traffic patterns in the event of a major no-notice human-caused event in Chicago. The researchers designed an internet-based survey utilizing Google Maps in which respondents were instructed to drop pins to place themselves and family members on the map on a selected date. The survey instrument visually displayed hypothetical emergency scenarios on Google Maps and made
them available to respondents. The emergency scenarios randomly allocated time, location, and event severity across the Chicago metropolitan area, as well as event radius and government recommendations. Respondents were asked to specify their travel behavior under the emergency circumstance by dropping a pin on their destination location. The dynamic tool allowed for georeferenced intended behavior, improving measurement properties of the instrument. There were nonetheless obvious trade-offs on response error, coverage error and sampling error (Auld et al., 2012).
There are other options such as SMS, interactive voice response, redirected inbound call sampling, robocalls, and social media surveys that may afford researchers cost flexibility but also some trade-offs. Such surveys could, for instance, be perceived as informal, nonserious surveys, unwanted calls, illegal messages, or sales calls. The intelligence analyst needs to consider possible sources of error related to the mode of administration and the trade-offs in terms of total survey error.
ESTABLISHING CREDIBILITY OF CONTEXTUAL INFORMATION AND SOUNDNESS OF TECHNICAL DATA
A global interpretation of public opinion results is not always straightforward, but there are elements that can help to understand critical aspects about a public opinion study: information that is not typically included in reports and information that is expected to show up in survey methodology reports. Tables 3A-1 and 3A-2 provide a summary of helpful questions to collect and assess contextual and technical information of a survey. It is important to recognize that each factor in Tables 3A-1 and 3A-2 does not have equal weight, and analysts should consider some more than others. For example, when it is evident that a survey lacks authenticity (the survey is clearly a fake) it may be moot that the survey is based on nonprobability sampling methods or that there is limited coverage of the population. The questions are presented as guiding principles and as a shorthand method, but it is not by any means exhaustive. The intention is to give the analyst a star-based rating system to intuitively assess the survey based on scientific principles, and understand trade-offs around various factors that have an influence in the quality of results.
Once the analyst has collected as much intelligence as possible based on key questions, it needs to be sorted out and categorized. To ease the transition from information gathering to assessment, the analyst can think of sorting the contextual and technical information into a tiered system. All elements that receive low ratings (one to two stars), can be placed in a lower tier (“not credible, not sound”). Elements with three stars can be placed in a middle tier (“partially credible, partially sound”). Elements with four or five stars are then placed in a high tier (“credible, sound information”).
TABLE 3A-1 A Rating Tool for Survey Quality: Credibility of Contextual Information
| ★ | ★★ | ★★★ | ★★★★ | ★★★★★ | ||
|---|---|---|---|---|---|---|
| Credibility of contextual information | ||||||
| Survey purpose | Is the survey purpose clear? | No, it is not clear at all what the objective of the survey is. | No, there are not enough elements to identify the purpose. | Maybe. There are some elements with which to infer the purpose. | Yes, with some modest effort, one can tell what the purpose is. | Yes, it is clear what the study aims to do. |
| Survey authenticity | Is the survey authentic (not fake)? | No. The survey is clearly a fake. | No, there is not enough to assert its authenticity. | Maybe. The information is not entirely clear. | Yes. With a careful reading, one can tell is authentic. | Yes. The survey is clearly authentic. |
| Professional integrity | Does the survey avoid condemned practices? | No. The study did not avoid condemned practices relating to collecting survey data. | No. There are not many details, but one can see that the survey did not avoid condemned practices. | Maybe. There is doubt as to whether the study used condemned practices. | Yes. While there are not a lot of details, one can tell there were not condemned practices. | Yes. It is obvious that the survey was not collected using condemned practices. |
| Survey sponsorship | Is it clear who paid for the study? | No, it is totally unclear who paid for the study. | No. There are just a few clues, but it’s unclear who may have contributed the money. | Maybe. There are a few names of individuals or organizations linked to the study. | Yes, based on what other people are saying or indirect knowledge. | Yes. The source of financing is quite clear and publicly known. |
| Survey research team | Is the team a known group of researchers? | No. There is no information about who designed and implemented the survey. | No. There is contradicting information on who conducted the study. | Maybe. There are enough elements to speculate who the team might be. | Yes, but contact information was gathered with some effort. | Yes. The survey research team is known and easily contactable. |
| ★ | ★★ | ★★★ | ★★★★ | ★★★★★ | ||
|---|---|---|---|---|---|---|
| Credibility of contextual information | ||||||
| Background of survey firm | Is the reputation of the survey agency known? | No. No one seems to know anything about the survey organization. | No clear record, but based on the few known elements, they don’t seem to have the right competencies. | Maybe. The organization is not specialized in public opinion, or it is new. | Yes. The survey organization is affiliated to professional associations, and the organization is not new. | Yes. They are well known, they have a good reputation in general, and they publicly report results. |
| Reporting and dissemination | Is the description of how the study was conducted clear? | No. The survey methodology is completely unavailable. | No. There is no confidence that the methodology can be acquired. | Maybe. The reporting is ambiguous, and the description is obscure. | Yes. The reporting of methods is limited. | Yes. The documentation and write-up of results are very clear. |
TABLE 3A-2. A Rating Tool for Survey Quality: Soundness of Technical Information
| ★ | ★★ | ★★★ | ★★★★ | ★★★★★ | ||
|---|---|---|---|---|---|---|
| Soundness of technical information | ||||||
| Sampling properties | Was the survey conducted based on probability sampling? | No. The study is clearly based on nonprobability methods. | No, but it mimics probability sampling (quota sampling), or the sample looks too good to be true (unrealistic large sample size). | Maybe. The study combines probability and nonprobability data. Possibly for hard-to-reach populations. | Yes. It is clear that probability sampling was used but it’s unclear on statistical weighting. Too much uncertainty. | Yes. The study was clearly based on probability sampling and reasonable statistical weighting (based on relevant variables). |
| Coverage properties | Did the study use an adequate sample frame? | No. The study was not based on a clear sample frame. | No, but the study attempted to develop an ad hoc sample frame, and there aren’t a lot of details. | Maybe. The frame is incomplete or dated and likely to be biased or too uncertain. | Yes. The sample frame looks good and clearly reports its limits. | Yes. The sample frame is very reasonable for covering the target population. |
| Nonresponse properties | Does the study discuss issues of nonresponse? | No. Nothing is known about issues of nonresponse. | No, but the study provides some elements to get a sense on nonresponse. | Maybe. The study reports response rates but nothing else. | Yes. The study offers some insights on potential nonresponse issues. | Yes. The study offers an analysis on potential limitations due to nonresponse. |
| ★ | ★★ | ★★★ | ★★★★ | ★★★★★ | ||
|---|---|---|---|---|---|---|
| Soundness of technical information | ||||||
| Measurement properties | Did the survey use unloaded questions? | No. The study does not provide information on the questionnaire. | No, but from the brief description of results and frequencies, the question wording doesn’t look good. | Maybe. The questionnaire is partially available and there is no clear presentation of question wording. | Yes. The questionnaire is available, but there is no discussion of measurement properties (that is, it is unclear whether directionality in the wording of some questions is intentional). | Yes. The study offers an analysis of measurement properties of survey questions (that is, there is an explicit discussion on question wording). |
There is no perfect classification, but based on the scientific and practical aspects of survey research covered in this document, the intelligence analyst can have a framework for thinking about the assessment.
The multitiered system can help with a succinct reporting and qualification of the assessment and description of a study for decision making and recommendations to intelligence officials. In other words, a public opinion survey can be classified as (1) “credible and sound,” (2) “partially credible, partially sound,” or (3) “not credible, not sound.” When all the evidence points toward a high-tier survey, then the analyst will have more confidence in their reporting and formulating recommendations.
REFERENCES
Ahmed, A., and P. Villegas. 2016. “As Frustrations with Mexico’s Government Rise, So Do Lynchings.” The New York Times, January 23. https://www.nytimes.com/2016/01/24/world/americas/as-frustrations-with-mexicos-government-rise-so-do-lynchings.html.
Alwin, D.F. 2007. Margins of Error: A Study of Reliability in Survey Measurement, vol. 547. Hoboken, NJ: Wiley-Blackwell.
Auld, J., V. Sokolov, A. Fontes, and R. Bautista. 2012. “Internet-Based Stated Response Survey for No-Notice Emergency Evacuations.” Transportation Letters 4(1):41–53.
Bach, R.L., S. Eckman, and J. Daikeler. 2020. “Misreporting among Reluctant Respondents.” Journal of Survey Statistics and Methodology 8(3):566–588.
Bautista, R. 2012. “An Overlooked Approach in Survey Research: Total Survey Error.” In Handbook of Survey Methodology for the Social Sciences edited by L. Gideon, 37–49, Springer Publishing, New York, NY.
Bethlehem, J.G. 2012. “Using Response Probabilities for Assessing Representativity.” Working paper, Statistics Netherlands, Heerlen/den Haag, The Netherlands.
Biernacki, P., and D. Waldorf. 1981. “Snowball Sampling: Problems and Techniques of Chain Referral Sampling.” Sociological Methods and Research 10(2):141–163.
Bischoping, K., and H. Schuman. 1992. “Pens and Polls in Nicaragua: An Analysis of the 1990 Preelection Surveys.” American Journal of Political Science 36(2):331–350.
Brick, J.M., I.F. Cervantes, S. Lee, and G. Norman. 2011. “Nonsampling Errors in Dual Frame Telephone Surveys.” Survey Methodology 37(1):1–12.
Chaudhuri, A., and T.C. Christofides. 2013. “Indirect Questioning in Sample Surveys.” Springer Science and Business Media.
De Heer, W., and E. De Leeuw. 2002. “Trends in Household Survey Nonresponse: A Longitudinal and International Comparison.” In Survey Nonresponse edited by R.M. Groves, D.A. Dillman, J.L. Eltinge, and R.J.A. Little, 41–54. Wiley and Sons, New York, NY.
Enten, H. 2017. “Fake Polls Are a Real Problem.” FiveThirtyEight, August 22. https://fivethirtyeight.com/features/fake-polls-are-a-real-problem/.
Etikan, I., S.A. Musa, and R.S. Alkassim. 2016. “Comparison of Convenience Sampling and Purposive Sampling.” American Journal of Theoretical and Applied Statistics 5(1):1–4.
Goel, S., and M.J. Salganik. 2010. “Assessing Respondent-Driven Sampling.” Proceedings of the National Academy of Sciences 107(15):6743–6747.
Gonzalez-Ocantos, E., C.K. De Jonge, C. Meléndez, J. Osorio, and D.W. Nickerson. 2012. “Vote Buying and Social Desirability Bias: Experimental Evidence from Nicaragua.” American Journal of Political Science 56(1):202–217.
Gordoni, G., and P. Schmidt. 2010. “The Decision to Participate in Social Surveys. The Case of the Arab Minority in Israel: An Application of the Theory of Reasoned Action.” International Journal of Public Opinion Research 22(3):364–391.
Gorny, A., and J. Napierała. 2016. “Comparing the Effectiveness of Respondent-Driven Sampling and Quota Sampling in Migration Research.” International Journal of Social Research Methodology 19(6):645–661.
Groves, R.M., and M.P. Couper. 1998. Nonresponse in Household Interview Surveys. New York, NY: Wiley and Sons.
Groves, R.M., M.P. Couper, S. Presser, E. Singer, R. Tourangeau, G.P. Acosta, and L. Nelson. 2006. “Experiments in Producing Nonresponse Bias.” International Journal of Public Opinion Quarterly 70(5):720–736.
Groves, R.M., and L. Lyberg. 2010. “Total Survey Error: Past, Present, and Future.” Public Opinion Quarterly 74(5):849–879.
Groves, R.M., and E. Peytcheva. 2008. “The Impact of Nonresponse Rates on Nonresponse Bias: A Meta-Analysis.” Public Opinion Quarterly 72(2):167–189.
Henry, K.A., and R. Valliant. 2015. “A Design Effect Measure for Calibration Weighting in Single-Stage Samples.” Survey Methodology 41(2):315–331.
Himelein, K. 2016. “Interviewer Effects in Subjective Survey Questions: Evidence from Timor-Leste.” International Journal of Public Opinion Research 28(4):511–533.
Kalton, G. 2009. “Methods for Oversampling Rare Subpopulations in Social Surveys.” Survey Methodology 35(2):125–141.
Kalton, G. 2020. Introduction to Survey Sampling, 2nd edition (Quantitative Applications in the Social Sciences No. 35). Thousand Oaks, CA: Sage Publications.
Kalton, G., and I. Flores-Cervantes. 2003. “Weighting Methods.” Journal of Official Statistics 19(2):81.
Kuyper, L., E. Sommer, and S. Butt. 2018. “Gender Gaps in the Measurement of Public Opinion about Homosexuality in Cross-National Surveys: A Question Wording Experiment.” International Journal of Public Opinion Research 30(4):692–704.
Little, R.J., and D.B. Rubin. 2019. Statistical Analysis with Missing Data, 3rd edition (Wiley Series in Probablility and Statistics, vol. 793). Hoboken, NJ: John Wiley and Sons.
Lohr, S.L. 2021. Sampling: Design and Analysis, 3rd edition. Boca Raton, FL: CRC Press.
Luiten, A., J. Hox, and E. de Leeuw. 2020. “Survey Nonresponse Trends and Fieldwork Effort in the 21st Century: Results of an International Study across Countries and Surveys.” Journal of Official Statistics 36(3):469–487.
Mangione, T.W., F.J. Fowler, and T.A. Louis. 1992. “Question Characteristics and Interviewer Effects.” Journal of Official Statistics 8(3):293–307.
O’Muircheartaigh, C., and P. Campanelli. 1998. “The Relative Impact of Interviewer Effects and Sample Design Effects on Survey Precision.” Journal of the Royal Statistical Society: Series A (Statistics in Society) 161(1):63–77.
Olson, K., J.D. Smyth, J. Dykema, A.L. Holbrook, F. Kreuter, B.T. West, eds. 2020. Interviewer Effects from a Total Survey Error Perspective. Boca Raton, FL: CRC Press.
Papadakis, J., D. Rothschild, and T. Konitzer. 2018. “The Methodology That Is Overcoming Some of Market Research’s Biggest Obstacles.” GreenBook (blog), https://www.greenbook.org/mr/market-research-methodology/organic-sampling-methodology/.
Pollfish. n.d. “Random Device Engagement and Organic Sampling.” Pollfish, https://resources.pollfish.com/market-research/random-device-engagement-and-organic-sampling/.
Rubin, D.B. 2004. Multiple Imputation for Nonresponse in Surveys (Wiley Classical Library, vol. 81). Hoboken, NJ: John Wiley and Sons.
Schouten, B., F. Cobben, and J. Bethlehem. 2009. “Indicators for the Representativeness of Survey Response.” Survey Methodology 35(1):101–113.
Schouten, B., and N. Shlomo. 2017. “Selecting Adaptive Survey Design Strata with Partial R Indicators.” International Statistical Review 85(1):143–163.
Singer, E. 2006. “Introduction: Nonresponse Bias in Household Surveys.” International Journal of Public Opinion Quarterly 70(5):637–645.
Smith, T.W. 2014. “Cross-National Public Opinion Research.” In Concise Encyclopedia of Comparative Sociology edited by M. Sasaki, J. Goldstone, E. Zimmermann, and S. Sanderson, 281–289, Brill, Leiden, The Netherlands.
Spencer, B.D. 2000. “An Approximate Design Effect for Unequal Weighting When Measurements May Correlate with Selection Probabilities.” Survey Methodology 26:137–138.
Tourangeau, R., L.J. Rips, and K. Rasinski. 2000. The Psychology of Survey Response. Cambridge, United Kingdom: Cambridge University Press.
Tsuchiya, T., and N.E. Synodinos. 2015. “Searching for Alternatives: Comparisons Between Two Sample Selection Methods in Japan.” International Journal of Public Opinion Research 27(3):383–405.
Vehovar, V., V. Toepoel, and S. Steinmetz. 2016. “Non-Probability Sampling.” In The Sage Handbook of Survey Methods edited by C. Wolf, D. Joye, T. Smith, and Y. Fu, 329–345. Sage Publications, Thousands Oaks, CA.
Wagner, J. 2012. “A Comparison of Alternative Indicators for the Risk of Nonresponse Bias.” Public Opinion Quarterly 76(3):555–575.
WAPOR (World Association for Public Opinion Research). 2015. “Statement on Interviewers Lynched in Ajalpan, Mexico.” Public statement, October 23. https://wapor.org/statement-on-interviewers-lynched-in-ajalpan-mexico/.
Weisberg, H.F. 2009. The Total Survey Error Approach. Chicago: University of Chicago Press.
West, B.T., and S.E. McCabe. 2012. “Incorporating Complex Sample Design Effects When Only Final Survey Weights Are Available.” The Stata Journal 12(4):718–725.
Willis, G.B. 2004. Cognitive Interviewing: A Tool for Improving Questionnaire Design. Thousand Oaks, CA: Sage Publications.
Willis, G. 2018. “Cognitive Interviewing in Survey Design: State of the Science and Future Directions.” In The Palgrave Handbook of Survey Research edited by D. Vannette and J.A. Krosnick. 103–107, Palgrave MacMillan, London.
Wong, S.H.W., and J. Liang. 2021. “Attraction or Distraction? Impacts of Pro-Regime Social Media Comments on Chinese Netizens.” Political Behavior (2021):1–25.
Yamada, S., and N.E. Synodinos. 1994. “Public Opinion Surveys in Japan.” International Journal of Public Opinion Research 6(2):118–138.
This page intentionally left blank.


