Critical Issues in Transportation for 2024 and Beyond (2024)
Chapter: Infrastructure Systems
many ways in which groups and individuals are disproportionately harmed by transportation or excluded from its benefits. In addition to being better able to articulate transportation harms, it also requires defining, measuring, and addressing increases in accessibility provided by new and changed transportation services and options.
![]() Transportation
Transportation
Infrastructure Systems
Transportation infrastructure—the backbone of the nation’s transportation system—has been built up over more than a century of economic and population growth and expansion. The infrastructure’s condition and performance affect the economy; its design and operation affect safety; its location affects equity; and its type affects development patterns, mode choice, and vehicle emissions. In addition, the U.S. transportation infrastructure is enormous. The system includes millions of miles of roadways and pipelines and tens of thousands of miles of passenger and freight rail tracks and waterways (see Table 2). In addition, there are more than 500 major airports, 600,000 bridges, 3,000 rail stations, and 190
TABLE 2 Transportation Network Length (miles)
| Mode | 2010 | 2020 |
|---|---|---|
| Highway | ||
| Public roads | 4,067,077 | 4,172,562 |
| Public road lanesa | 8,582,261 | 8,790,746 |
| Pipeline | ||
| Gas distribution | 1,229,946 | 1,328,885 |
| Gas transmission and gathering | 324,458 | 319,224 |
| Rail | ||
| Class I freight railroad | 95,700 | 91,773 |
| Amtrak | 21,178 | 20,787 |
| Transit | ||
| Commuter railb | 7,630 | 7,930 |
| Heavy railb | 1,617 | 1,663 |
| Light railb,c | 1,497 | 2,096 |
| Water | ||
| Navigable waterwaysd | 25,000 | 25,000 |
a Measured in lane-miles.
b Measured in directional route-miles.
c Light rail was revised beginning in 2011 and includes light rail, street car rail, and hybrid rail.
d Estimated length of domestic waterways.
SOURCE: Hampshire, R.C., P. Hu, and R. Schmitt. Pocket Guide to Transportation 2023. U.S. Department of Transportation, Bureau of Transportation Statistics. Washington, DC, 2023. https://rosap.ntl.bts.gov/view/dot/64803.
ports.137 This section focuses on infrastructure elements that affect the national economy. Inequities resulting from the location of infrastructure are discussed in the sections on Public Health and Equity.
Condition
The condition of the nation’s infrastructure varies across modes, as does the availability of accurate measurements of its condition. Available national metrics indicate that
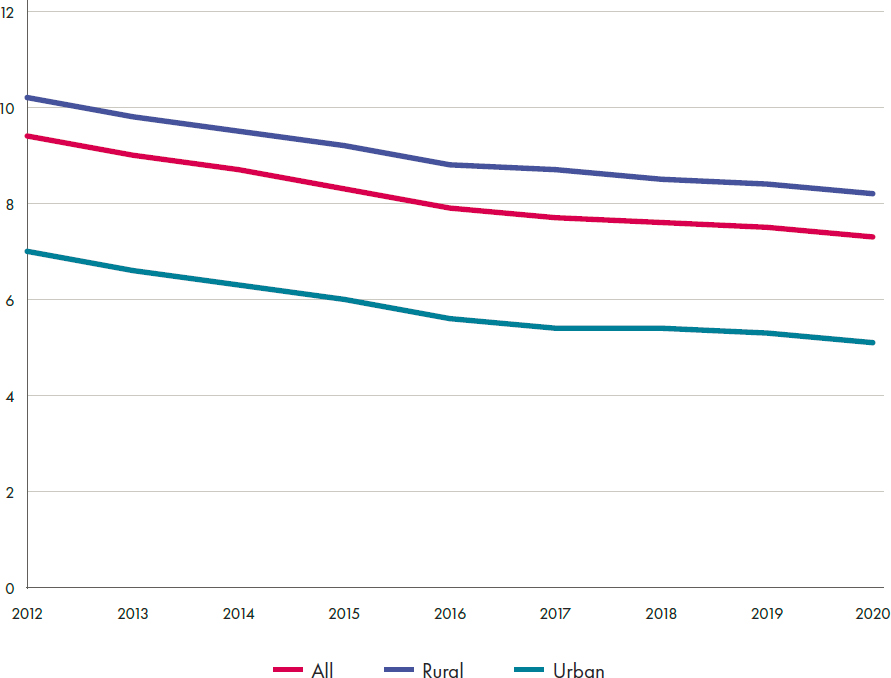
- States and local jurisdictions are reducing the percentage of major road and highway pavements and all bridges rated in poor condition (see Figures 13 and 14).138

SOURCE: Hampshire, R.C., P. Hu, and R. Schmitt. Pocket Guide to Transportation 2023. U.S. Department of Transportation, Bureau of Transportation Statistics. Washington, DC, 2023. https://rosap.ntl.bts.gov/view/dot/64803.
SOURCE: Hampshire, R.C., P. Hu, and R. Schmitt. Pocket Guide to Transportation 2023. U.S. Department of Transportation, Bureau of Transportation Statistics. Washington, DC, 2023. https://rosap.ntl.bts.gov/view/dot/64803.
- Areas of track that do not meet freight railroad rail design standards fell from 22 to 5 per 100 miles of inspected track between 2010 and 2018.139
- Most airport pavements (80 percent) are in good condition and have been over time.140
Transit condition estimates are not reported annually, but in 2016 an estimated 21 percent of buses and 10 percent of rail transit assets were in marginal or poor condition.141 Similar measures for ports, waterways, and private infrastructure assets are not generally available, despite their critical importance for supply chains and efficient freight intermodal transfers.
Performance
Various measures of performance provide indications of how well the nation’s transportation infrastructure system is meeting demand, which varies considerably across modes. Before the COVID-19 pandemic reduced travel demand, annual hours of roadway delay had more than doubled since 1985 to an average of 50 hours per commuter.142 Airport on-time arrivals since 1995 have hovered around 80 percent despite a sharp increase in air travel.143 Average lockage delays on waterways have increased from 1 to 4 hours since 2000, with half of vessels delayed.144 Measures of freight rail and pipeline performance are limited because both modes are privately held. Meaningful measures of marine port performance are limited by a variety of data gaps, including wide variation in ownership and operation of ports and terminals across the public and private sectors.145
Highway congestion is an important performance indicator because it accounts for such a large share of passenger and freight movement and its key role in supply chain stability and performance. Improved measures of hours of delay across the highway network have only become available since 2017.146 Modeled estimates suggest that major truck routes with recurring stop-and-go conditions totaled 5,000 miles in 2015. The same models predict more than five-fold growth by 2045 to 27,000 miles of these same conditions.147 FHWA’s updated forecasts indicate 1.1 percent annual growth in overall freight tonnage between 2017 and 2050, increasing from 0.7 percent in the most recent decade.148,149 Even if this forecast is overstated, demand will grow with an increasing population and expanding economy. The Federal Highway Administration’s (FHWA’s) forecast of congested mileage for the Northeast Corridor are illustrated in Figure 15. Similar patterns are forecast around and between major metropolitan areas in the East, Midwest, Texas, and West Coast. Although not always cost-beneficial, adding well-targeted lane miles on major congested intercity highway links can benefit total trade among regions that would exceed the costs required to add the lanes.150 Charging congestion or variable tolls on added lanes could also help avoid negating the benefits of capacity expansion due to increased travel volume and reduce the total investment required to provide efficient traffic flow.151,152,153
Improved traffic flow is only one important performance measure, however—improved safety is another. The increases in highway fatality rates discussed earlier in the Safety section of this publication will require state departments of transportation and their federal and local partners to redouble their efforts to implement best practices to reduce fatalities and injuries.154 Moreover, although the focus of this publication is on the national scale, performance measures at the state, metropolitan area, and local government levels are also needed. Such areas, for example, need
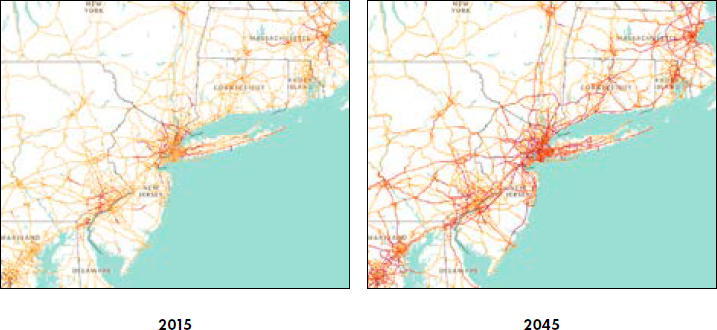
SOURCE: U.S. Department of Transportation, Bureau of Transportation Statistics. https://data.bts.gov/stories/s/Freight-Transportation-System-Condition-Performanc/vvk5-xjjp.
effective and appropriate measures of how well they are succeeding in providing choices that shift demand away from fossil-fueled vehicles.
Aging systems also require adequate funding for repair and maintenance, which can be informed by collection of better condition data, improved predictive models, and other asset management tools. Decisions about how much needs to be invested to meet capacity, in which modes, over what time periods, and how increases in motorized travel generated by providing new infrastructure can best be mitigated also require further R&D to develop better models, policies, and capital investment estimates.
The United States is enmeshed in a globally competitive economy. It ranks second in overall economic competitiveness, but only thirteenth in the quality and extent of its infrastructure.155 That relatively low ranking should be concerning for a nation seeking to bolster manufacturing and exports.
The condition and performance of the enormous interconnected systems of U.S. transportation infrastructure are critical for the safe and efficient movement of people and goods and achievement of transportation-related climate and economic goals, but measures of their condition and performance are incomplete and imperfect. The lack of such information hampers decision making about the required scale of resource allocation and how most cost-effectively to ensure that transportation infrastructure serves a thriving society.


