Critical Issues in Transportation for 2024 and Beyond (2024)
Chapter: Movement of People and Goods
![]() Transportation
Transportation
Movement of People and Goods
Travel results from people, organizations, and communities pursuing their goals and freight and passenger carriers trying to serve them. The movement of people and goods is the means by which the benefits and costs of transportation affect societal goals, as illustrated in Figure 1. The lens used for this publication focuses on the national scale, recognizing that patterns of travel and modes used range widely across the country from that of New York City to Yuma, Arizona, to Prudhoe Bay, Alaska.
Passengers traveled more than 6 trillion passenger miles in the United States in 2019, the last year before travel was severely reduced by the COVID-19 pandemic (see Figure 2).3 This enormous travel volume is not surprising for a continent-sized country inhabited by 334 million people,
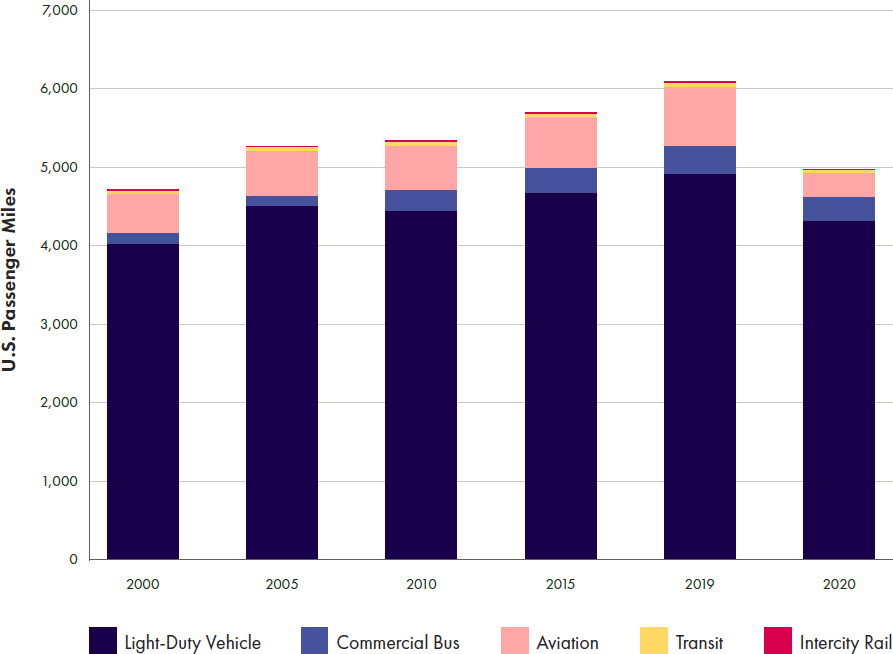
SOURCE: U.S. Department of Transportation, Bureau of Transportation Statistics. 2017. Table 1-40: U.S. Passenger-Miles (Millions). https://www.bts.gov/archive/publications/national_transportation_statistics/table_01_40.
whose metropolitan areas are generally far apart (other than in the Northeast United States) and designed around the use of motor vehicles. Indeed, personal travel in light-duty vehicles (LDVs), or cars, sport utility vehicles (SUVs), motorcycles, and light trucks, make up more than three-quarters of total passenger miles represented in Figure 2. Aviation follows LDVs with almost 12 percent of total passenger miles, and then commercial (non-transit) bus with almost 6 percent. Transit and intercity rail combined represent less than 1 percent of passenger miles. That seemingly small share belies the importance of transit for the economic vitality of center cities, the essential service it provides to the many individuals who do not drive, and its importance in climate change mitigation strategies. Indeed, as shown in Table 1, when considered in terms of percentage of daily trips, active travel (walking and cycling) and transit account for almost 14 percent of trips nationwide, and these shares are even higher in metropolitan areas with extensive transit systems. Although still small in number relative to other modes, trips by the expanding types of micromobility—e-scooters, regular bikes, and e-bikes (both docked and dockless)—have been growing rapidly in a variety of urban areas around the country, with potential growing health and climate benefits and safety concerns in the future.4
TABLE 1 Travel Day Person Trips by Mode, 2017
| Mode | Percent Trips |
|---|---|
| Walk | 10.49 |
| Bike | 0.96 |
| Car/van/SUV | 73.58 |
| Pickup and other truck | 9.52 |
| School bus | 1.90 |
| Transit bus and rail | 2.44 |
| Other bus | 0.24 |
| Intercity rail | 0.21 |
| Aviation | 0.17 |
| Water | 0.05 |
| Other/Don’t recall | 0.44 |
| Total | 100.00 |
NOTE: Car/van/SUV also includes motorized two-wheeled vehicles, rental cars, and ridehail trips.
SOURCE: National Household Travel Survey, Federal Highway Administration, U.S. Department of Transportation. See https://nhts.ornl.gov/person-trips.
Passenger modal preferences have been relatively stable over time but shifted some between 2000 and 2019.5 For example, although overall passenger miles increased 30 percent over this period, travel by commercial bus grew 150 percent, and aviation grew 50 percent. Although it accounts for the largest share of total passenger miles by far, LDV travel grew only 20 percent. This slower growth than overall travel may be partly due to lack of growth in per capita vehicle miles traveled (VMT) between 2000 and 2019.6 Transit travel also grew 20 percent but has been falling from its peak of 26 percent growth in 2014.7 Intercity rail grew 16 percent.
National estimates of active travel are collected periodically and are likely underestimated. Federal surveys in 2009 and 2017 estimated that these
modes represent less than 1 percent of total passenger miles but 11.5 percent of trips, despite a general dearth of sidewalks and bike paths designed to encourage safe walking and biking.8 Transit, walking, and cycling mode shares differ considerably when considering levels of urbanization. In metropolitan areas with a population of 3 million or more, for example, transit accounts for 5 percent of trips and walking accounts for 15 percent. Even so, LDVs still account for 75 percent of trips in these areas.
A significant shift in travel has occurred in large metropolitan areas as increased remote work has persisted, even after many other COVID-19 pandemic-induced trends have returned to their pre-pandemic state. In October 2023, 50 percent of office space in 10 major cities remained unoccupied, long after highway and aviation passenger traffic had rebounded.9 The percentage of remote work appears to be stabilizing at about 1 in 4 workdays, compared to less than 1 in 20 workdays before the COVID-19 pandemic.10 Overall transit ridership remains down by about one-third from its 2019 level and appears to be leveling off at this reduced rate.11 Whether workers will return to in-person work at previous levels has profound implications for downtown economies and the future of transit systems designed to deliver workers to and from city centers. Population losses or sharply reduced growth in the largest metro areas across the country in 2021 have accelerated population shifts that were already occurring, especially in urban core counties.12 Low-density residence and work environments make transit and active modes of transportation less attractive for commuting and other trips due to the greater distances between origins and destinations. Moreover, increased rates of individuals working from home also increase overall motor vehicle travel due to increased trip distances for newly remote workers and increased home-based non-work vehicle trips in general.13
Freight mode shares of total freight ton miles have fluctuated over the last 20 years. Overall, less fuel-efficient trucks have gained share while more fuel-efficient modes of rail, pipelines, and water have lost share (see Figure 3). In general, long-distance truck transport is faster than other freight modes and can more easily provide point-to-point service. Although depicted as individual modes in Figure 3, most freight is part of complex supply chains involving shippers, brokers, carriers, infrastructure, and transfers from one mode to another between the freight’s origin and its final destination. The COVID-19 pandemic demonstrated the fragility of supply chains, as well as the limited capability of public agencies to help restore traffic flow once supply chains were severely disrupted (see further discussion in the Governance section of this publication).
The passenger and freight travel trends summarized above help to create and support the nation’s economy, as described further in this publication’s Economy section. However, these economic benefits are

SOURCE: U.S. Department of Transportation, Bureau of Transportation Statistics. U.S. Ton-Miles of Freight. https://www.bts.gov/content/us-ton-miles-freight.
partially offset by travel’s harmful effects, as discussed in this publication’s sections on Climate Change, Safety, and Public Health.
The demand for different passenger and freight modes has important implications for fossil fuel consumption and its effects on climate change, discussed further in this publication’s Climate Change section. The projections by the U.S. Department of Energy shown in Figure 4 were made before the passage of major federal legislation in 2021 and 2022 to address climate change (and described in the Climate Change section). Without a significant change in demand, transportation was forecast to increase fossil fuel consumption by 2050 to 14.3 million barrels per day (see Figure 4). Most of that projected growth is attributable to the growing demand for energy-intensive air transportation. Almost all of this fossil fuel demand—roughly 90 percent of all U.S. petroleum consumption—will need to shift to renewable sources to meet national climate goals and commitments.


