Critical Issues in Transportation for 2024 and Beyond (2024)
Chapter: Building and Sustaining a Strong, Competitive Economy
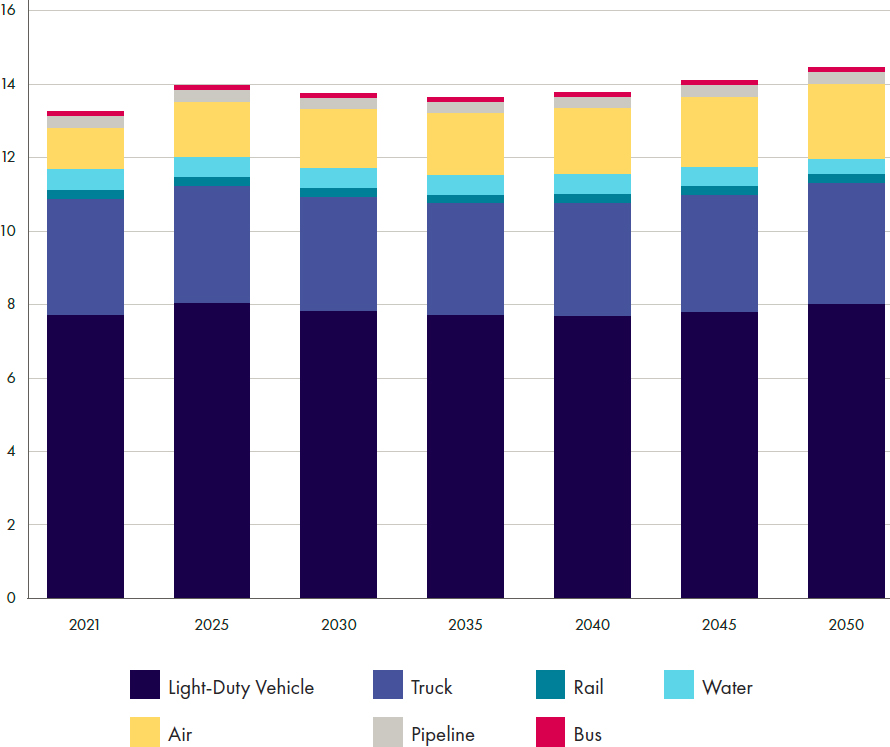
SOURCE: Energy Information Administration, Annual Energy Outlook 2022, Table 7.
![]() Societal Goals
Societal Goals
Building and Sustaining a Strong, Competitive Economy
The U.S. economy would not function without transportation. Goods move from producers to consumers, most workers travel from home to workplaces, and consumers travel to purchase goods and services or pay to have goods delivered. As critical aspects of both production and consumption, transport’s direct costs would ideally be minimized, and

SOURCE: U.S. Department of Transportation, Bureau of Transportation Statistics. In-House Transportation and Household Transportation. https://data.bts.gov/stories/s/smrm-36nv.
in the United States their costs are indeed low. Even the most transport-dependent sector, wholesale and retail trade, has required 10 cents or less in transportation services for every dollar of output since 2012.14 Natural resources/mining, construction, and manufacturing have required 4.5 cents or less in transportation services per dollar of output, and most service sectors, including leisure and hospitality, have required 3 cents or less.
Measuring transportation’s contribution to the Gross Domestic Product (GDP) is another way of illustrating its importance to the economy (see Figure 5). By this measure, freight and household transportation costs have hovered near 6 percent of the total U.S. GDP since 2012. This relative stability in transportation costs’ share of GDP may be partially explained by the lack of overall growth in total factor productivity (TFP), or the real output resulting from all combined inputs of labor and capital for the
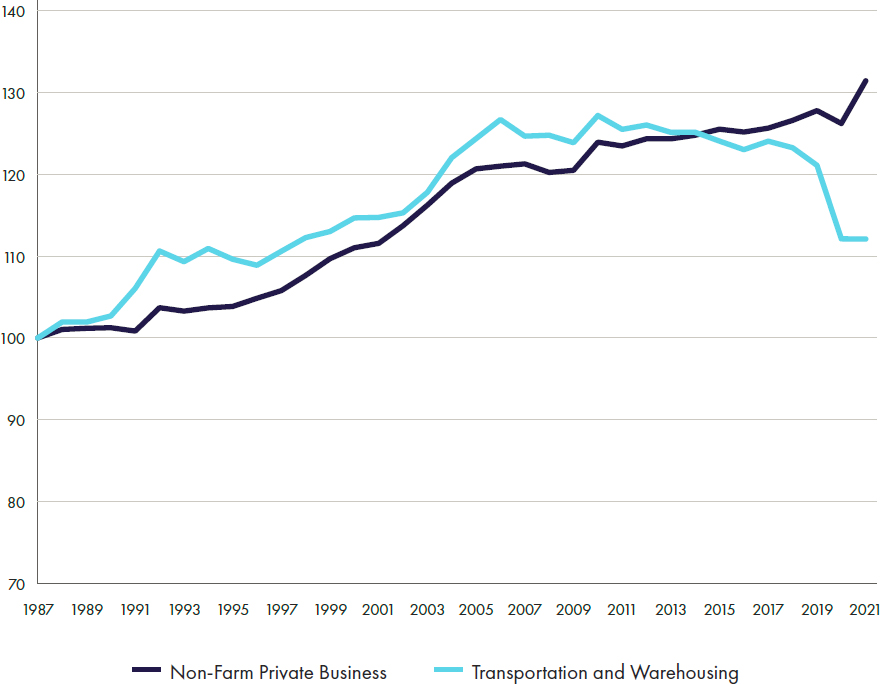
NOTE: 1987 = 100.
SOURCE: Bureau of Labor Statistics. Annual Total Factor Productivity and Related Measures for Major Industries, October 18, 2022. https://www.bls.gov/productivity/tables.
transportation sector, since 2006 and declines in productivity growth since 2012 (see Figure 6).15 As shown in Figure 6, transportation’s productivity trend is similar to the general slow growth in U.S. productivity overall.16,17 The slow growth in transportation productivity is not attributable to transportation labor productivity, which has been rising steadily since at least the 1990s for aviation and freight modes.18 The actual causes of the overall national slowdown in TFP growth have long been elusive, and the consequences of this slowdown are worrying for future prosperity.19
The combined measure of transportation TFP in Figure 6 masks considerable variation across freight modes since 1987 (see Figure 7).20 Freight rail transportation TFP grew sharply compared to all private businesses until 2008, after which its growth declined. Pipeline productivity
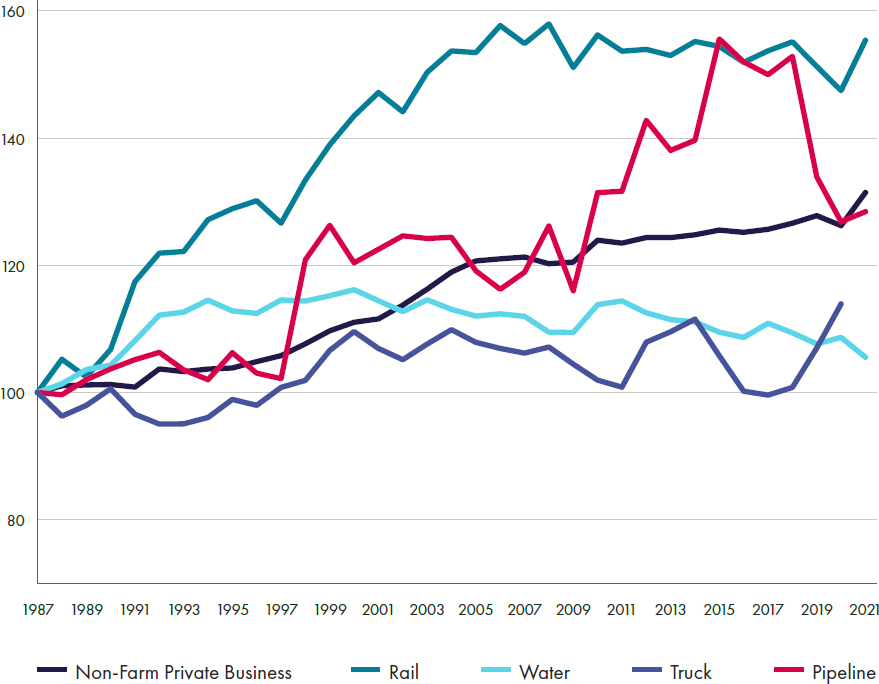
NOTE: 1987 = 100.
SOURCE: Bureau of Labor Statistics. Annual Total Factor Productivity and Related Measures for Major Industries, October 18, 2022. https://www.bls.gov/productivity/tables.
growth exceeded that of all private businesses for most of the last decade. Water TFP grew faster than private businesses until 2000, but has since declined steadily. Truck TFP growth has lagged that of private businesses since 1987. The large share of total freight moved by truck and rail and their declining growth in TFP help explain the slowdown in total transportation and warehousing TFP over the last decade shown in Figure 6.
Possible explanations for these productivity trends vary and their estimated benefits and costs are important for guiding public policy. It may be the case that rail TFP growth declined, in part, because of utility shifts away from coal to natural gas moved by pipelines. Declining rail and trucking TFP growth may be related to the decline in U.S. manufacturing.21 Understanding benefits and costs of TFP trends for trucking is particularly


