Myopia: Causes, Prevention, and Treatment of an Increasingly Common Disease (2024)
Chapter: 3 Understanding Myopia and Its Prevalence
3
Understanding Myopia and Its Prevalence
This chapter establishes the significance of myopia by examining prevalence throughout the world and in the United States. It also examines how myopia is defined and measured, which is fundamental to interpreting the other chapters. Readers will find that the prevalence data on myopia motivate this report and underlie the urgency in determining the mechanisms of the disease’s development.
The prevalence of myopia appears to be increasing worldwide (Holden et al., 2016), including in the United States (Tailor et al., 2024; Vitale et al., 2009), and is predicted to continue to increase globally. The Brien Holden Vision Institute has suggested that 50% of the world’s population will be nearsighted by 2050, up from 23% in 2000 (Holden et al., 2016). The National Eye Institute predicts that 44.5 million people in the United States will be nearsighted in 2050, with greater increases among African and Hispanic Americans (National Eye Institute, 2020). Although prevalence is clearly high, the exact estimate will depend on the definition of myopia, how myopia is measured, and at what age it is measured.
The measurement of myopia’s current prevalence in the United States is only an imperfect estimate. National data are now more than 20 years old, so they precede the widespread use of laptops, tablets, smartphones, and other personal digital devices, as well as the recent indoor quarantine period induced by the COVID-19 pandemic. Most recent population data are limited to specific regions of the country and therefore may be unrepresentative in terms of race/ethnicity, level of education, access to care, and a variety of other factors. Since myopia generally increases in severity with age during childhood, prevalence data vary by the age studied. Finally, myopia (and refractive error in general) can be measured and defined in multiple ways, making comparisons across studies difficult.
This section of the chapter describes the data on prevalence in the United States in the context of worldwide changes in prevalence and using data from specific global locations that are possibly informative about mechanisms. The committee chose to concentrate on rigorous studies with representative samples, studies that use the same method longitudinally or crosssectionally at a variety of ages. Interestingly, the rate at which myopia progresses in individuals does not appear to be changing (Chandler et al., 2023; Khanal & Dhakal, 2024; see Box 3-1). Therefore, the focus of this chapter will be to identify what is known about overall prevalence and best practices to determine current prevalence more accurately in the United States, including surveillance and accountability.
BOX 3-1
Higher Prevalence of Myopia but Same Rate of Progression
Has the rate of myopia progression for school-aged children become faster as myopia has become more common? A comparison between late 20th century studies and more recent work suggests that the answer is no. Myopia may be more common, but the rate of progression has largely remained the same across the last 60 years, at least in the United States. The data come primarily from observational studies and clinical trial control groups. The previous 1989 report on myopia from the National Research Council Committee on Vision summarized the existing literature from the 1960s through the early 1980s. Myopia progression at that time was typically −0.50 diopters* (D) per year with a range of −0.30 to −0.60 D/year. A 2012 meta-analysis summarizing literature from 1990 to 2012 found similar values (Donovan et al., 2012). The 2012 study’s estimate was that myopia progressed at an annual rate of −0.55 D/year (95% CI = −0.39 to −0.72 D/year) for children of European heritage who had a mean age of 9.3 years when progression was measured.
More recent clinical trial results show similar rates of progression for young myopic children. In studies of multifocal contact lenses, Chamberlain et al. (2019) and Walline et al. (2020) reported −0.45 D/year and −0.38 D/year average annual myopia progression, respectively, in their control groups not receiving that treatment. In randomized studies of the effectiveness of low-dose atropine for slowing myopia progression in children, Repka et al. (2024) and Zadnik et al. (2023) reported annual progression rates in control groups receiving placebo (i.e., children without atropine treatment) of −0.41 D/year and −0.43 D/year, respectively. As noted in Chapter 5, the age at onset of myopia in U.S. children generally ranges from 7 years to 16 years (Kleinstein et al., 2012). For about 50% of children with myopia, the condition stabilizes, meaning it is no longer increasing, by age 15, and in 75% of children with myopia by age 18 (COMET Group, 2013). Younger children have faster rates of myopia progression (Chua et al., 2016; Jones-Jordan et al., 2021) and data from China suggest that recent cohorts of children are becoming myopic at younger ages (Wang et al., 2021). These two factors combined could increase the overall rate of progression when averaged across ages. The rate of progression at a given age, however, appears to be stable over time.
MEASURING MYOPIA
Refractive error is usually measured as the spherical equivalent in units of diopters (D). Spherical equivalent refractive error takes account of the patient’s spherical refractive error as well as any astigmatism. The threshold for classifying a patient as myopic varies from study to study; most studies use a threshold level of spherical equivalent refractive error of −0.50, −0.75, or −1.00 D. Other researchers take account of astigmatism by defining myopia in any “meridian” or in one specific meridian; that is, along any astigmatic axis or along one specific axis. For example, an eye could potentially be farsighted in one meridian but myopic in another meridian, due to the presence of astigmatism (see Figure 3-1 and Table 3-1).

NOTE: The larger image shows an eye with uneven optical power in the vertical and horizonal meridians, which produces multiple focal points on the retina and a blurry image. The smaller image shows a normal eye with perfect optical balance between meridians, which produces a single focal point on the retina in shown at the top for comparison.
SOURCE: Illustration by Laurie O’Keefe in Mangan, 2019. Image used with permission from AllAboutVision.com.
Another issue in measurement is whether the refractive measurements are made while the child’s focusing system is temporarily paralyzed using eye drops that induce cycloplegia, which is a state of temporary paresis of the ciliary body muscles. Because a child’s eye has a dynamic accommodative range in those muscles, changing focus from near to far distances with little effort, myopia may be overestimated without cycloplegia. With the focusing power made static using cycloplegic eye drops, a more predictable and reproducible measure of refractive error can be obtained. Empirical data comparing pre- and post-cycloplegic data show that teenage measurements are, on average, 0.26 D more myopic before cycloplegia. Adults have a less dynamic focusing range, and cyclopleged versus non-cyclopleged refractions are usually similar after approximately age 20 (Sanfillippo et al., 2014).
| Study/Project | Definition of Myopia | Definition of Astigmatism | Definition of Aniso-Metropia |
|---|---|---|---|
| CLEERE (Collaborative Longitudinal Evaluation of Ethnicity and Refractive Error) Jones-Jordan et al., 2010 | −0.75 D or more myopia in both meridians (by cycloplegic autorefraction) | ||
| COMET (Correction of Myopia Evaluation Trial) Hyman et al., 2001 | SER between −1.25 D and −4.50 D | Astigmatism < or = 1.50 D | Aniso < 1.00 D |
| IMI (International Myopia Institute) Flitcroft et al., 2019 | SER of an eye is ≤ −0.50 D when ocular accommodation is relaxed |
| BLINK (Bifocal Lenses in Nearsighted Kids) Walline et al., 2020 | −0.75 D to −5.00 D of spherical component myopia | Astigmatism < 1.00 D | |
| MOSAIC (Myopia Outcome Study of Atropine in Children) Loughman et al., 2024 | SER ≤ −0.50 D in both eyes | ||
| MTS1 (Myopia Treatment Study 1) Repka et al., 2023 | −1.00 D to −6.00 D SER | Astigmatism of 1.50 D or less in both eyes | Aniso < 1.00 D |
| CHAMPS (Childhood Atropine for Myopia Progression) Zadnik et al., 2023 | −0.50 D to −6.00 D SER | No worse than −1.50 D astigmatism | |
| LAMP (Low-concentration Atropine for Myopia Progression) Yam et al., 2019 | At least 1.0 D | Astigmatism of 2.5 D or less | |
| DOT (Diffusion Optics Technology by SightGlass) Rappon et al., 2023 | SER between −0.75 and −4.50 D | Astigmatism greater than 1.25 D | No more than1.50 D aniso |
| HALT (Highly Aspherical Lenslet Technology by Essilor Stellest) Bao et al., 2022 | Cycloplegic SER between −0.75 D and −4.75 D | Astigmatism not exceeding 1.50 D | Aniso not exceeding 1.00 D based on SER |
NOTE: Various large-scale randomized clinical trials have studied myopia using various quantitative definitions.
Some investigators simply ask participants (or their parents) if they are farsighted or nearsighted. Others evaluate the individual’s most recent spectacle prescription. Still others use more objective means, such as an automated measure of myopia or a retinoscopy session with an eye care provider. Measurement error is reduced when objective measures are used. However, it may not be feasible at the population level to collect prevalence data using cycloplegic eye drops and an automated instrument. Screening data from uncyclopleged eyes and automated instruments are useful, but they might cause the rate of myopia to be over- or underestimated due to variable screening protocols within or outside of school systems. Diagnostic codes and their use can also be monitored, but not all eye care providers use the same codes, if they use any at all. Table 3-2 summarizes the strengths and weaknesses of different ways of measuring myopia in an individual and of estimating its prevalence at the population level. Table 3-3 presents options for reporting myopia in prevalence evaluations, and their feasibility at the population level and at the individual/local level.
The age at which myopia is measured may also affect prevalence rates. Data from the Collaborative Longitudinal Evaluation of Ethnicity and Refractive Error suggest that the average age of onset for myopia is 11 years old and ranges primarily from 7 to 16 years of age (Kleinstein et al., 2012). Therefore, if myopia is measured in the preschool years, the prevalence will be much smaller than it would be if it were measured in the late school-aged years. Some studies measure myopia in older generations and compare that to myopia prevalence in younger
generations of the same population. If prevalence were increasing, one would expect to find more in younger generations. In fact, this is what was found, for example, in Singapore where one researcher measured the prevalence of myopia (worse than −0.50 D spherical equivalent) to be 81.6% in young adults (Koh et al., 2014) and another found myopia prevalence, using the same magnitude of myopia, to be 38.9% in adults over age 40 (Pan et al., 2013).
A small caveat on how myopia is measured is related to the natural aging of the human eye. Changes in the anterior part of the eye, including natural yellowing and hardening of the crystalline lens, are associated with aging, and these can lead to an increase in a person’s nearsightedness without a change in the axial length. Similarly, natural changes in the power of the crystalline lens after age 50 years shift refractive error toward hyperopia, complicating comparisons between generations (Bomotti et al., 2018; Mutti & Zadnik, 2000).
TABLE 3-2 Methods for Detecting and Measuring Myopia
| Ways to Measure Myopia | Pros | Cons | Feasible at the Population Levela | Feasible at the individual/Local Levelb |
|---|---|---|---|---|
| Distance visual acuity | Snellen or pediatric visual acuity charts are readily available. | The assumption that poor vision at distance indicates myopia may lead to over-estimation given that other refractive errors, amblyopia, and other conditions of the eye may result in poor distance vision. | Yes | Yes |
| Photorefraction | Takes fewer than 30 seconds to obtain measure in a cooperative child, including preschool-aged or younger children. | Instrument-based techniques may be cost-prohibitive; without cycloplegia, estimates of myopia may be inflated due to a child’s strong accommodative system (Hu et al., 2015; Li et al., 2019) | Yes | Yes |
| Autorefraction | If used under cycloplegic conditions, this represents possibly one of the most accurate and objective | Instrument-based techniques may be cost-prohibitive. Without cycloplegia, estimates of myopia may be inflated due to | Possible, but an autorefractor is generally less portable than a photorefractor, which is often handheld; | Yes |
| measures of refractive error. | strong accommodative system of child (Hu et al., 2015; Li et al., 2019). | Not readily feasible with cycloplegia but can be used for noncyclopleged estimates. | ||
| Retinoscopy | Under cycloplegic conditions, this represents one of the most accurate and objective measures of refractive error. | Requires specially trained individuals, largely eye care professionals. | Not readily feasible under cycloplegic conditions. Possible under noncycloplegic conditions, but requires an expert, and the measure may be less consistent than under cycloplegic conditions. | Yes |
a Population level: large-scale evaluations of prevalence including vision screenings in community/school/country.
b Individual/local level: smaller-scale, more in-depth evaluation, including comprehensive eye exams within a clinical office setting.
TABLE 3-3 Ways to Report Myopia When Evaluating Prevalence and Their Feasibility
| Ways to Define Myopia | Feasible at the Population Levela | Feasible at the Individual/Local Levelb |
|---|---|---|
| Magnitude in diopters | Yes | Yes |
| Magnitude in millimeters (length of the eyeball) | No | Yes |
| Self-report | Yes | Yes |
| Prescription evaluation | Yes | Yes |
| Lensometry (measuring prescription of spectacle lenses using an optical instrument) | No | Yes |
| Medicaid or other use of ICD-10 diagnostic codesc | No | Yes |
a Population level: large-scale evaluations of prevalence including vision screenings in community/school/country.
b Individual/local level: smaller-scale, more in-depth evaluation, including comprehensive eye exams within a clinical office setting.
c ICD-10 codes are applicable diagnosis codes that providers and suppliers utilize when submitting medical claims to Medicare.
WORLDWIDE PREVALENCE
Myopia is one of the most prevalent eye disorders worldwide and is a major cause of visual impairment (Bourne et al., 2013; Resnikoff et al., 2008). The highest prevalence is observed in well-documented studies performed in countries in East and South-East Asia: 80–90% of children ages 17–18 from urban regions of Hong Kong, Singapore, China, Taiwan, and Japan are myopic (Morgan & Rose, 2005; Morgan et al., 2012) and evidence of steady increases in prevalence during the last 10 years (see, for example, Gwon & Lee, 2023 for longitudinal data
from over 2 million Korean men reporting for mandatory physical exams at age 19). A comprehensive study of all 19-year-old males residing in urban Seoul, Korea, found an astonishing prevalence of over 96% (Jung et al., 2012).1 In European countries, the overall prevalence of myopia is 24% across all age categories and 47% in young adults (Williams et al., 2015).
The rising prevalence in China was recently documented in a detailed analysis of 7.5 million Chinese children, which used data from 187 individual studies conducted in schools to calculate prevalence in five time periods from 1998 to 2015 (Wang et al., 2023b). There was a steady increase in the prevalence of myopia, especially in rural communities where the rate rose by 5% to 7% every 5 years, as compared to a slower but steady increase in urban communities (see Figure 3-2). Other studies from Asia found prevalence rates for high myopia already varying between 15% and 25% by the age of 10 (Matsumura & Hirai, 1999).
There data from China indicate a further increase in urban communities during the pandemic for children in Grades 1–9 (Wang et al., 2023a). In Hong Kong, where school closures were of longer duration than in mainland China, cross-sectional data from cyclopleged refraction indicates that the prevalence of myopia 2 in children 6–7 years old, which had been stable from 2015–2019, was higher during and after the lockdown (2020 and 2021; Zhang et al., 2023). At the same time, parental questionnaires indicated that the decrease in time outdoors and increased time on screens and doing near work that characterized the lockdown period did not completely reverse after it was lifted.
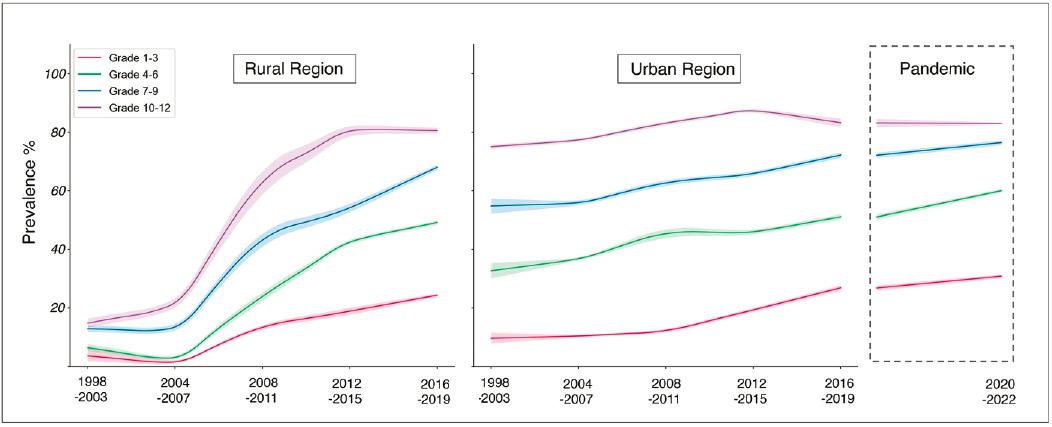
NOTE: The left and middle panels show data from rural and urban regions, respectively; the right panel shows urban regions tested during the pandemic.
SOURCE: Reprinted from Wang et al., 2023b, under a Creative Commons Attribution-NonCommercial-No Derivatives 4.0 International License (https://creativecommons.org/licenses/by-nc-nd/4.0/).
While the largest increase in myopia has occurred in Asian populations, increases have also been observed in the United States and other countries worldwide (Sankaridurg et al., 2021; Vitale et al., 2009). It is estimated that by the year 2050, half of the world’s population will be
___________________
1Worse than −0.50.
2−0.5D or worse.
myopic (3.6–6.1 billion), and almost 10% will be highly myopic and thus at greater risk for retinal issues and other comorbidities (Holden et al., 2016). The impact on those afflicted and on society is already significant, with reduction of or lost productivity and quality of life, as well as a high health care burden and costs (Sankaridurg et al., 2021).
Divergent Prevalence in Children by Age and Ethnicity
Several studies report on the prevalence of refractive error and myopia in children, generally finding lower prevalence in younger children and differences according to ethnicity (Goh et al., 2005; Kim et al., 2020; Logan et al., 2011; Matsumura & Hirai, 1999; Morgan et al., 2010; Vitale et al., 2009). For example, Czepita et al. (2008) studied myopia in Polish children from rural regions between the ages of 10 and 14. Among these children, all from the southeast part of Poland, they found a myopia prevalence rate of 6.3% at the age of 10, which increased to a prevalence of 9.7% at the age of 12. In another Polish study in a semirural population of children ages 6–18, the prevalence of myopia using the same methodology and cut-off was slightly higher: 11.0% in those age 10 and 14.4% in those age 12 (Czepita et al., 2008). Two studies in the United Kingdom of children of European descent, which looked at children ages 6 to 7 and ages 12 to 13, respectively, found a myopia prevalence of 2.8%–5.7% in the younger group and of 17.7–18.6% in the older age group (Logan et al., 2011; O’Donoghue et al., 2010). All four of those studies used the same definition of myopia, namely at least −0.5D.
Ojaimi et al. (2005) studied schoolchildren ages 5 to 8 in Australia and found an overall myopia prevalence of 1.4%. They found a significant difference between children of European descent (0.79%) and those belonging to other racial groups (2.73%, p < 0.001). The Sydney Myopia Study (Ip et al., 2008), which examined children ages 11 to 14, determined an overall myopia prevalence of 11.9% but also found large differences in prevalence between children of European descent (4.6%) and those of East Asian descent (39.5%). In a representative sample of South Korean children aged 5–18 years old, prevalence of myopia was over 75% by age 13 (Kim et al., 2020). Comparatively, South Asian children also have relatively high prevalence rates from early childhood: 10.8% in those ages 6 to 7 and 36.8% in those ages 12 to 13 (Logan et al., 2011; see Goh et al., 2005 for similar data from Malaysia). These studies also used the same definition of myopia, namely at least −0.5D.
Lifestyle and Urbanization: Potential Causes of Divergent Prevalence
Although these ethnic differences are striking, they may reflect lifestyle differences among populations through which environmental factors may affect the onset and progression of myopia. These factors could include time spent outdoors, amount of near work, and educational exposure (see Chapter 5 on onset and progression). There is no genetic reason to expect major ethnic differences (Tedja et al., 2018). What these studies make clear is that the prevalence of myopia in most studies of children is non-trivial, regardless of ethnicity.
Data from studies in China suggest that prevalence is increasing faster in rural than in urban communities there (Wang et al., 2023b), although myopia manifested at an earlier age in the urban communities. This pattern raises concern that as more rural communities begin to urbanize, especially in developing countries, the prevalence of myopia globally will likely increase. Current data from Africa show this pattern already: the prevalence of myopia approximately doubled between 2000 and 2010 (reaching 2.9%) and again between 2011 and 2020 (reaching 5.6%), perhaps because of increased access to schooling (Kobia-Acquah et al.,
2022). These rates remain low by worldwide standards, but they raise concern that prevalence may increase dramatically with further development and urbanization across Africa.
While a heat map comparing prevalence levels across countries has not yet been developed, even informal comparisons are difficult to interpret. They are hampered by the varied methods of detection (manual retinoscopy versus multiple instruments, cycloplegia versus not), varied policies on population screening, and varied methods for measurement (Carlton et al., 2008; Goh et al., 2005; Multi-Ethnic Pediatric Eye Diseases Study, 2010; Pan et al., 2009; Taylor et al., 2010; Villarreal et al., 2003).
A rare exception to the difficulties in making direct comparisons concerns the inspection of data from Sydney, Australia, alongside that from Belfast, Northern Ireland. The first set of data are from a study of Australian children who were predominantly 6 years old at the time of cycloplegic autorefraction and among whom 1.4% had myopia3 (Robaei et al., 2005). With the same definition and method of refractive-error assessment, the study in Northern Ireland reported that 2.8% of 661 children aged 6 to 7 had myopia. In older children, ages 12 to 13, 17.7% had myopia in the Belfast study (O’Donoghue et al., 2010). The observed differences might be caused by the slightly older cohort in Ireland and the possibility of differences in ethnic composition between the two populations, but they also might arise instead, or in addition, from behavioral differences that vary with culture.
PREVALENCE OF MYOPIA IN THE UNITED STATES
As stated earlier, the current prevalence of myopia in the United States is largely an estimate. Without formal policies on myopia surveillance and accountability, it is difficult to find rigorous, large-scale and (or) population-based estimates of childhood myopia prevalence in the country.
The best evidence of the prevalence of myopia in U.S. adults likely stems from the work of Susan Vitale and the studies she directed using the National Health and Nutrition Evaluation Survey (NHANES; Vitale et al., 2008). NHANES is an ongoing study of population characteristics in a nationally representative sample of the United States population that for many years included measures of refractive errors, including myopia.
Adult Population-Based Prevalence
NHANES: National Data
For the period 1999–2004 (Vitale et al., 2008), the prevalence of myopia in adults aged 20 and older was 33.1% (see Table 3-4). Individuals aged 60 and older were less likely to have myopia than younger participants, hinting at increasing prevalence in more recent generations since axial myopia is usually a lifelong condition. Again, inter-generational comparisons can be confounded by hyperopic shifts with age. Myopia was more common in non-Hispanic White people (35.2%) than in non-Hispanic Black people (28.6%) or Mexican American people (25.1%).
NHANES data have also been compared between the periods 1971–1975 and 1999–2004 (Vitale et al., 2009). For individuals aged 12–54, average prevalence increased from 25% in 1971–1975 to 41.6% in 1999–2004. It should be noted that for Americans of European descent
___________________
3Defined as worse than −0.50D.
myopia increased 1.63-fold; for African Americans it increased 2.59-fold. Perhaps of most concern, for high myopia (worse than or equal to –7.90 D myopia), there was an 8-fold increase in prevalence.
Rochester, Minnesota
The prevalence of myopia in adults has also been reported for the period between 1966 and 2019 in Olmsted County, which encompasses the Mayo Clinic in Rochester, Minnesota (Tailor et al., 2024). For adults there older than age 18, 57.1% had myopia in the 2010s. This represents a 68% increase from the 33.9% prevalence recorded in the 1960s. By the 2010s, the prevalence of myopia had increased to 53.3% in White people and to 41% in Black people. Of note, high myopia, defined as –6.00 D of myopia or more, had nearly tripled, from 2.8% in the 1960s to 8.3% in the 2010s. It should also be noted that this study is not representative of the United States, as nearly every participant in the 1960s was White, and in 2010, 85% of participants were White as well. Nevertheless, the Olmstead County study does represent a comprehensive look at the prevalence of myopia at the (county) population level and illustrates the increasing prevalence in the area. More population-based studies in more diverse areas of the United States will be required to obtain a more representative picture.
Pediatric Population-Based Prevalence
In 2013, a population-based study of refractive error and other eye conditions known as the Multi-Ethnic Pediatric Eye Disease Study (MEPEDS) was conducted in Los Angeles, California, in children ages 6 to 72 months. It found that the prevalence of myopia in the preschool years ranged from 1.2% to 6.6%, depending on ethnicity (see Table 3-4; MEPEDS, 2010; Wen et al., 2013).
An earlier study, known as the Baltimore Pediatric Eye Disease Study (BPEDS), was conducted in Baltimore, Maryland, with the same core definitions and age groups as MEPEDS. When MEPEDS and BPEDS participant data are combined, the total prevalence of myopia in preschool children comes out to 3.8%, with prevalence ranging from 1.0% to 5.8% depending on ethnicity and age (see Table 3-4; Borchert et al., 2011).
Medicaid Claims for Children
Crude prevalence data are also available from Medicaid claims between 2016 and 2019. In 2016, of 27,667,800 children (0 to 17 years old) with claims data, 6.75% of children were diagnosed with myopia (Vision & Eye Health Surveillance Systems, 2016). In 2019, of 34,094,900 children with claims, prevalence rose to 7.24% (Vision & Eye Health Surveillance Systems, 2019).
TABLE 3-4 Studies of U.S. Prevalence of Myopia
| Study | Prevalence (period of measurement) | Myopia definition and measurement technique | Age (n) |
|---|---|---|---|
|
NHANES 2008 (Vitale et al., 2008) | 33.1% (1999–2004) | > –1.00 D SER myopia; non-cycloplegic autorefraction | > 20 years (12,010) |
| NHANES 2009 | 25.0% (1971–1972) | lensometry, pinhole visual acuity, and presenting visual acuity (for | 12–54 years (4,436 in 1971– |
| (Vitale et al., 2009) | 41.6% (1999–2004) | presenting visual acuity (for presenting visual acuity of at least 20/40) or retinoscopy (for presenting visual acuity of 20/50 or worse). | 1972 and 8,339 in 1999–2004) |
|
Olmsted County, MN (Tailor et al., 2024) | 33.9% (1960s) 57.1% (2010s) | > –0.50 D SER myopia; refraction or lensometry | >18 years (81,706) |
|
Los Angeles, CA (MEPEDS, 2010; Wen et al., 2013) | 1.2% in White Americans 3.7% in Hispanic Americans 3.98% in Asian Americans 6.6% in African American Americans (2003–2011) | > –1.00 D SER myopia; cycloplegic examination | 6–72 months (1,501 non-Hispanic White Americans; 3,030 Hispanic Americans, 1,507 Asian; 2,994 African Americans) |
|
Los Angeles, CA, and Baltimore, MD (combined) (Borchert et al., 2011) | 3.8% (all) 1.0% in White Americans, 3.3% in Hispanic Americans, 5.8% in African Americans (2003–2007) | (Combined: 9,970) | |
| Medicaid Claims | 6.75% (2016) 7.24% (2019) | Medicaid International Classification of Diseases diagnosis | 0–17 years (27,667,800 in 2016; 34,094,900 in 2019) |
SOURCE: Committee generated.
LESSONS FROM THREE REGIONS: THE INUIT, AUSTRALIA, AND ISRAEL
Lessons from the Inuit
Historically, population studies of Arctic communities found low rates of myopia (Rozema et al., 2021). After 1950, though, reports emerged of increasing prevalence in younger members of the community in studies from Canada, Alaska, and Greenland. A recent review shows this pattern by plotting the prevalence as a function of age and the decade of measurement (Figure 3-3; Rozema et al., 2021). It includes five studies from Alaska, one from Canada, and two from Greenland, with data collected from 1950 to 2010. From 1950 to 1980, there is higher prevalence of myopia for those ages 10 to 30 years than for older members of the community, suggesting that prevalence is increasing. For the intervals 1980−1990 and 1990−2010, the prevalence remains high at ages 10 to 30 but the peak shifts to older ages, as would be expected from the cumulative effect of a factor that began to affect children’s eye growth around 1950. Results are similar in studies using a higher cut-off for myopia (e.g., Morgan et al., 1975).
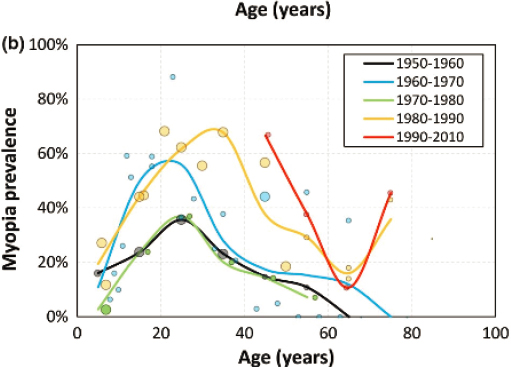
NOTES: The prevalence of myopia of −0.25 D or worse in studies of northern native communities plotted as a function of age. Each dot represents an individual data point, with its size scaled to the size of the sample. The color coding represents the decade when the measurements were taken.
SOURCE: Reprinted from Rozema et al., 2021, with permission from John Wiley & Sons, Inc. Copyright © 1999–2024 John Wiley & Sons, Inc or related companies. All rights reserved, including rights for text and data mining and training of artificial intelligence technologies or similar technologies.
Two concerns emerge from the data depicted in Figure 3-3. First, there is a surprising uptick at the end for those ages 75 to 80 from a much lower prevalence at age 65. The uptick is based on studies with very small sample sizes (e.g., 11 participants ages 70−90; 7 participants ages 80+), while the remainder of the graphs are based on larger cohorts. The uptick may also be due to concomitant age-related changes to the human lens called nuclear sclerosis, which can cause a myopic shift in older adults (Lee et al., 1999). Second, one study was omitted, as the authors wrote that the “Myopia percentage makes no sense” (see also Rozema et al., 2021). This omitted study covered 138 Inuit individuals who lived on Canada’s Belcher Island,4 most of whom were under age 50 (Woodruff & Samer, 1976). Only 6.9% of the eyes were myopic, 5 mostly in those in the age range of 10−20 years, and only 23% had any negative refractive error at all. One possible reason for the low incidence suggested by the authors is the relatively little western contact of this community, except for a period of iron ore mining in the 1950s.
Collectively, these studies show an initially low incidence of myopia in northern native populations and a recent increase in prevalence in many, but not all of these communities (see comment on Belcher Island, above). The most likely cause of the increased prevalence is increased early childhood school attendance, with which it correlates almost perfectly (Rozema et al., 2021). The correlation is often explained by the increase in near work that happens with schooling, but it is important to remember that there is a corresponding decrease in time outdoors. The importance of the latter is also signaled by the way myopia correlates with latitude, that is, with the angle and amount of sunlight in winter and summer. However, latitude cannot explain the increasing prevalence over time in any given locale.
___________________
4Measurements were taken of 77% of the population by a vision team from the University of Waterloo’s School of Optometry.
5Myopia worse than −1.0D.
Lessons from Australia
Australians are known as a people who enjoy spending significant time at beaches and, perhaps as a result, who have a higher risk of developing skin cancer (Mackey, 2023). Prevalence figures suggest lower rates of myopia there than in other countries of similar economic development. As early as 2000, the prevalence of myopia6 in adults older than 40 years was noted to be lower in Australia than in western Europe or the United States: the estimated prevalences for these three regions as of 2000 were 16.4%, 26.6%, and 25.4%, respectively (Kempen et al., 2004). Figure 3-4 shows that the prevalence of myopia7 across four large-scale population studies of Australian adults aged 40 and older ranged from 13.6% to 23.9%—all significantly lower than rates for the comparison group used by the authors from the U.K. Biobank study of adults ages 40 to 69 (27.8%). In one of the Australian studies, prevalence was lower in those with a history of skin cancer (and presumably more sun exposure) at 11.9% than in those with no such history, at 21.6% (Franchina et al., 2014). For high myopia,8 all four Australian samples had a significantly lower prevalence than the U.K. sample (0.7−2.7% versus 6.1%).9 Inspection of Figure 3-4 hints at increasing prevalence over decades because it is higher at ages 49–54 than at ages 65–70. This might reflect lifestyle changes, such as increasing education, or hyperopic shifts in the aging eye (Lee et al.,1999).
Although the low prevalence in Australians is notable, comparisons to the U.K. Biobank data might not be appropriate because of likely differences in social class and education (which are higher in the U.K. sample; Cumberland et al., 2015). A more appropriate comparison might be the data from the Gutenberg Health Study. With similar cutoffs,10 the prevalence in the German adults ages 35–74 was 35% and the prevalence of high myopia was 3.5% (Wolfram et al., 2014). Although the definition of myopia and age range do not match those in the Australian studies exactly, the German prevalence figures are higher than any of those from Australia.
Studies of Australian adolescents also indicate a relatively low incidence of myopia by worldwide standards, especially when the analysis is restricted to those of European ancestry. For example, one comparison of Sydney, Australia, and Northern Island found a prevalence of <10% at age 12 years (2 samples) and of 17.7% at age 17 years (1 sample) in Sydney schools, both of which were lower than the prevalence in comparable samples in Northern Ireland (French et al., 2012, 2013). A longitudinal study of children born in a Perth, Western Australia hospital in 1989–1991 found that 25.8% of those tested at age 20 years had myopia and 1.4% had high myopia11 (Lee et al., 2022). Myopia was more likely if they were currently studying, if they were non-White, if the concentration of serum 25(OH)D was lower at ages 17 or 20, suggesting less exposure to sunlight, and if there was more parental myopia (Lingham et al., 2021). By age 28 years, the prevalence had increased to 33.2%; the incidence of high myopia
___________________
6Myopia of at least −1.0 D.
7Myopia of at least −0.5 D.
8High myopia of −5.0 D or worse.
9The study also included data from a much smaller sample of 1,098 parents of children born 26 years earlier at a Perth hospital, with 22% of eligible mothers and 16% of eligible fathers participating; this study is omitted from the summary given here because the smaller number of participants may not be a representative sample, since they were parents who were willing to participate for 26 years.
10Myopia worse than –0.50D (rather than –0.05D or worse in the Australian study) and high myopia equal to –6D or worse (rather than –5.00 D or worse in the Australian study).
11Myopia of –0.5D or worse; high myopia of –6.0D or worse; n = 1328; longitudinal study, n = 801.
had not changed (1.5% vs. 1.4% at age 20). Importantly, the longitudinal data showed that the onset of myopia can occur between age 20 and 28 years: of the 516 participants without myopia at age 20 years, 72 (14%) had developed it by age 28 years. Multivariate analyses indicated that the increase of myopia between age 20 and 28 years was related to female gender, East Asian (as opposed to White) ethnicity, less sun exposure, parental myopia, and reporting more time working on a computer either at both ages or increasing to high usage over this period of time (Lee et al., 2023). The reported amount of TV time (including gaming) and reported amount of screen time (smartphones and tablets) were unrelated to the myopia results (Lee et al., 2022).

NOTES: The prevalence of myopia (top panel; −0.50 D or worse) and of high myopia (bottom panel; −5.00 D or worse) in adults 40–70 years old in Australia and, for comparison, the United Kingdom. Shown are data collected in 1992–1994 in Australia: The Blue Mountain Eye Study assessment in two postal codes of urban Sydney and the Melbourne urban and regional assessments conducted in randomly selected areas of metropolitan Melbourne and regional Victoria. Also shown are data from an Australian study conducted in 2010–2015 in Busselton, a regional town in Western Australia (brown line, n = 5,907). For comparison, data are plotted from the United Kingdom Biobank study (purple line on the top; n= 80,220).
SOURCE: Adapted from Mackey et al., 2021, with permission from John Wiley & Sons, Inc. © 1999–2024 John Wiley & Sons, Inc, or related companies. All rights reserved, including rights for text and data mining and training of artificial intelligence technologies or similar technologies.
Lessons from Israel
Prevalence data from Israel are valuable because virtually the entire population of 17-year-olds is screened for mandatory military service, including males and females, except for married or pregnant women, mothers, Arabs and some other minority groups, and until 2013, the
ultra-Orthodox. From 1971 and 1994 the prevalence of myopia 12 increased from 20.4% to 26.2%, with a higher prevalence in females than males at all time points (see Figure 3-5), possibly because they were more likely to have higher education (Shapira et al., 2019). Those of non-Jewish origin also had lower prevalence.
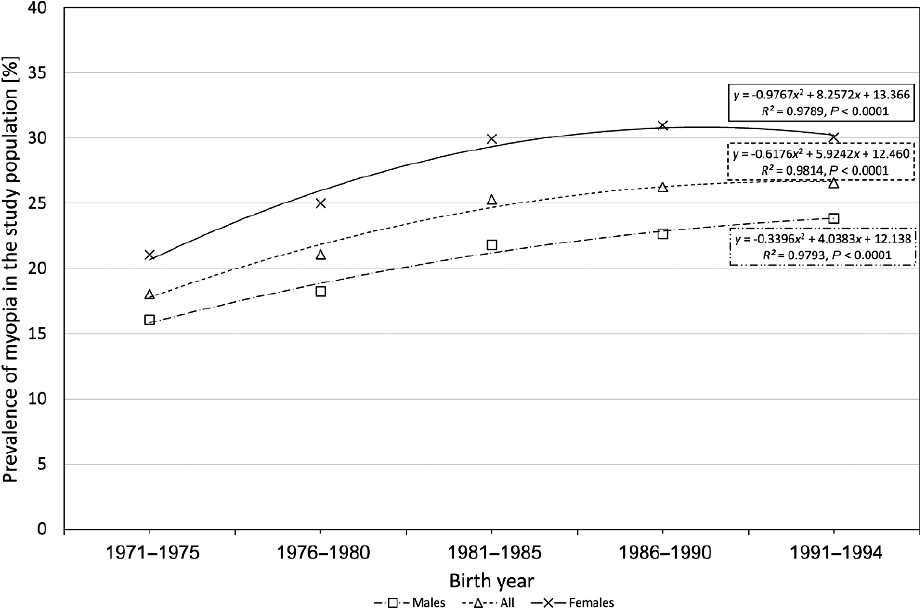
NOTES: The triangles are the overall data; the squares are the data from males; the x’s, from females. Refractive error was measured in 104,689 young adults, excluding only the ultra-Orthodox, some ethnic minorities, multiparous females, and married females. Over this time, the prevalence of myopia increased, with a similar pattern for high myopia (6 D and higher), which increased from 1.54% to 1.75%.
SOURCE: Reprinted from Shapira et al., 2019, with permission from Elsevier.
Data accumulated from 1990 through 2002 on 919,929 recruits in Israel show a continuation of this trend: an overall increase in prevalence from 20.3% in 1990 to 28.3% in 2002, with prevalence again higher in females, those with more years of higher education, and those of Jewish origin. Part of the increasing prevalence could be explained by an increase in higher education among male recruits and the increased pursuit of higher education among females (Dayan et al., 2005).
Particularly interesting are data for the 22,823 male recruits in 2013, a year when mandatory service included the ultra-Orthodox. The goal was to assess the entire male Jewish population of Israel at ages 17–18.13 The prevalence of myopia was 37.8% overall, with large differences depending on where the recruit had studied or was studying (see Table 3-5). For those from the Orthodox educational system, where males study in single-sex classrooms and are
___________________
12Myopia of −0.5D or worse.
13The sample excluded recruits born abroad, of a different age, non-Jewish, those who had had surgical refractive correction, and all female recruits (because religious female recruits are not subject to military service).
expected to do 2–3 additional hours weekly of intensive study of religious texts, the prevalence was significantly higher than for those with secular schooling. It was higher yet for those from the ultra-Orthodox educational system, who begin formal school with an emphasis on reading religious texts in fine print from the age of three and who are expected to study up to 16 hours/day as they progress in school (Bez et al., 2019).
Similar differences are evident in the prevalence of high myopia. The differences remained significant after adjustment for age, country of origin, socioeconomic status, years of education, and body-mass index. With secular recruits as a reference, the odds ratio for having myopia in the ultra-Orthodox was 9.3:1. Note that the data suggest an influence of near work (and the consequent lack of time outside) from an early age in a population that also experiences very little screen time (Bez et al., 2019).
| Schooling | Refractive Error Worse than or Equal to −0.50D | Refractive Error Worse than or Equal to −6.00D |
|---|---|---|
| Secular | 29.7% | 2% |
| Orthodox | 50.3% | 7.1% |
| Ultra-Orthodox | 82.2% | 27.6% |
SOURCE: Committee generated from data in Bez et al., 2019.
Lessons from the Inuit, Australia, and Israel
The relatively low prevalence among the Inuit and Australians suggests important lessons. For the Inuit, western contact and schooling appear to have led to an increase in myopia. However, the data for Australia, while also showing increasing prevalence, suggest that exposure to sunlight is prophylactic and may offset the effects of schooling. The data from Israel are especially valuable because of the use of large representative samples collected using the same methods over extended periods of time. They demonstrate convincingly that prevalence is increasing. Within the Israeli samples, education seems to be a factor, as those with more years of education were more likely to be nearsighted, as were those for whom near work was more intense and started at younger ages (the ultra-Orthodox). In Chapter 5, we evaluate evidence on the impact of near work and sunlight on the development of myopia, including the mechanisms by which they might have an impact. That evidence is clear for the benefit of sunlight but not for any independent effect of near work.
Trends in Myopia Prevalence
Although the National Academies 1989 myopia report (National Research Council, 1989) suggested no increase in prevalence at that time, it appears that myopia prevalence is now increasing in the United States and around the world (Mackey et al., 2021; Rozema et al., 2021; Shapira et al., 2019; Vitale et al., 2009). Of special concern is that high myopia, which creates a greater risk for retinal detachment, glaucoma, and myopic macular degeneration, appears to be increasing rapidly. Large-scale studies have not been funded recently in the United States, making it difficult to ascertain how the United States fits in with worldwide trends. Comparisons are difficult because of impactful methodological differences in how myopia is defined and measured. Estimates would be improved with formal policies on surveillance and accountability,
including stipulations on how to measure refractive error and how to define myopia, as well as similar procedures for taking and reporting measurements in different jurisdictions.
INFLUENCES OF SEX AND ETHNICITY ON PREVALENCE
Some prevalence data suggests higher rates in females and in certain ethnic groups. Those data should be interpreted with caution, as they may be influenced by differences in lifestyle, education, access to care, and a variety of other confounders. Moreover, there is no known genetic explanation that would lead one to expect sex or ethnic differences (see Chapter 5).
CONCLUSIONS
In recent years, there has been growing concern over the escalating prevalence of myopia on a global scale, including within the United States. The increases appear related to increased near work, as exemplified by the data from studies of the Inuit, urbanized Chinese, and ultra-Orthodox Jewish scholars. However, the Australian counter-example suggests a protective effect of time outdoors, which may decrease as the amount of near work or schooling increases. Factors such as extensive indoor reading in childhood (in the data from Israel) and extra time in the sunlight (data from Australia) very likely affect prevalence. In Chapter 5, we consider the direct evidence on the relationship between the protective effect of time outdoors and increased near work.
Despite the clear worldwide trends, comprehensive and up-to-date data in the United States remain scarce. This scarcity can be attributed to various factors, including discrepancies in the definition, measurement techniques, and age of assessment across different states and studies. Moreover, the lack of recent funding for large-scale surveillance studies with representative populations further exacerbates this data deficit. Concurrently, as lifestyle patterns evolve, particularly in developing regions, there is a foreseeable surge in myopia rates worldwide, one that will likely have significant economic implications. Contextualizing U.S. data within this broader international landscape not only facilitates comparative analysis but also allows for the generation of innovative hypotheses concerning the etiology of myopia and treatment development.
Conclusion 3-1: The prevalence of myopia appears to be increasing worldwide, including in the United States. However, very little recent data exist for the United States, and even when data are available, measuring trends is difficult. This is partly because the definition, magnitude, measurement technique, and age of assessment vary across states and across studies. The needed large-scale surveillance studies with representative populations have not been funded in recent years.
Conclusion 3-2: Predictable changes in lifestyle factors in the developing world, such as spending less time outdoors and more time at school and in near work, are likely to lead to an increase in worldwide myopia with an associated economic burden. Placing U.S. data in the context of worldwide trends will allow for comparisons to formulate novel hypotheses about etiology and/or treatment development.
RECOMMENDATIONS
Recommendation 3-1: The Centers for Disease Control and Prevention and state health departments should collect consistent, harmonized data on the prevalence of myopia in the United States, prioritizing longitudinal surveillance on refractive error prevalence in children using standardized procedures. A central repository should be created so that consistent data can be uploaded into a central database using insight from existing repositories (e.g., National Alzheimer’s Coordinating Center or the National Cancer Institute’s Surveillance, Epidemiology, and End Results Program) to advance our understanding of this disease.
- For such population statistics, the data should comprise objective measures at various ages, collected longitudinally from an early age and by repeated cross-sectional measurements using consistent methodology.
- The data should include the entire distribution of refractive errors, not just the mean and the age of onset. Otherwise, a shift in part of the distribution (e.g., high myopia) or age of onset (e.g., starting before Grade 1) that would suggest the need for different policy/practice responses could be obscured. This will also prevent biased conclusions from comparisons of studies using different values as the cut-off separating myopic from not-myopic.
- The repository should involve collaboration between government agencies, research institutions, healthcare providers, and advocacy organizations to ensure comprehensive data collection and dissemination.
Recommendation 3-2: The Centers for Disease Control and Prevention should coordinate with the World Health Organization so that both organizations are using consistent, harmonized definitions and monitoring methods. Data subsequently collected should then consistently follow these methods so that future worldwide comparisons can be used to identify the influence of economic development, lifestyle, and ethnicity on the prevalence of refractive error.
REFERENCES
Bao, J., Yang, A., Huang, Y., Li, X., Pan, Y., Ding, C., Lim, E. W., Zheng, J., Spiegel, D. P., Drobe, B., Lu, F., & Chen, H. (2022). One-year myopia control efficacy of spectacle lenses with aspherical lenslets. The British Journal of Ophthalmology, 106(8), 1171–1176. https://doi.org/10.1136/bjophthalmol-2020-318367
Bez, D., Megreli, J., Bez, M., Avramovich, E., Barak, A., & Levine, H. (2019). Association between type of educational system and prevalence and severity of myopia among male adolescents in Israel. JAMA Ophthalmology, 137(8), 887. https://doi.org/10.1001/jamaophthalmol.2019.1415
Bomotti, S., Lau, B., Klein, B. E. K., Lee, K. E., Klein, R., Duggal, P., & Klein, A. P. (2018). Refraction and change in refraction over a 20-year period in the Beaver Dam Eye Study. Investigative Ophthalmology & Visual Science, 59(11), 4518–4524. https://doi.org/10.1167/iovs.18-23914
Borchert, M. S., Varma, R., Cotter, S. A., Tarczy-Hornoch, K., McKean-Cowdin, R., Lin, J. H., Wen, G., Azen, S. P., Torres, M., Tielsch, J. M., Friedman, D. S., Repka, M. X., Katz, J., Ibironke, J., Giordano, L., & Multi-Ethnic Pediatric Eye Disease Study and the Baltimore Pediatric Eye Disease Study Groups. (2011). Risk factors for hyperopia and myopia in preschool children: The multi-ethnic pediatric eye disease and Baltimore pediatric eye disease studies. Ophthalmology, 118(10), 1966–1973. https://doi.org/10.1016/j.ophtha.2011.06.030
Bourne, R. R., Stevens, G. A., White, R. A., Smith, J. L., Flaxman, S. R., Price, H., Jonas, J. B., Keeffe, J., Leasher, J., Naidoo, K., Pesudovs, K., Resnikoff, S., & Taylor, H. R. (2013). Causes of vision loss worldwide, 1990–2010: A systematic analysis. Lancet Global Health, 1, e339–e349. https://doi.org/10.1016/S2214-109X(13)70113-X
Carlton, J., Kamon, J., Czoski-Murray, C., Smith, K. J., & Marr, J. (2008). The clinical effectiveness and cost-effectiveness of screening programmes for amblyopia and strabismus in children up to the age of 4–5 years: A systematic review and economic evaluation. Health Technology Assessment, 12(25). https://doi.org/10.3310/hta12250
Chamberlain, P., Peixoto-de-Matos, S. C., Logan, N. S., Ngo, C., Jones, D., & Young, G. (2019). A 3-year randomized clinical trial of MiSight lenses for myopia control. Optometry and Vision Science, 96(8), 556–567. https://doi.org/10.1097/OPX.0000000000001410
Chandler, S., Sinnott, L., Mutti, D., Zadnik, K., Jordan, L., Fong, T., & Hemmati, H. (2023). The CHAMP and CLEERE studies demonstrate similar rates of myopia progression over time [Conference abstract]. Academy 2023: Annual Meeting of the American Academy of Optometry. New Orleans, LA, United States. https://aaopt.org/past-meeting-abstract-archives/?SortBy=&ArticleType=&ArticleYear=&Title=&Abstract=&Authors=&Affiliation=&PROGRAMNUMBER=230015
Chua, S. Y., Sabanayagam, C., Cheung, Y. B., Chia, A., Valenzuela, R. K., Tan, D., Wong, T. Y., Cheng, C. Y., & Saw, S. M. (2016). Age of onset of myopia predicts risk of high myopia in later childhood in myopic Singapore children. Ophthalmic & Physiological Optics: The Journal of the British College of Ophthalmic Opticians (Optometrists), 36(4), 388–394. https://doi.org/10.1111/opo.12305
COMET Group. (2013). Myopia stabilization and associated factors among participants in the Correction of Myopia Evaluation Trial (COMET). Investigative Ophthalmology & Visual Science, 54(13), 7871–7884. https://doi.org/10.1167/iovs.13-12403
Cumberland, P. M., Bao, Y., Hysi, P. G., Foster, P. J., Hammond, C. J., Rahi, J. S., & UK Biobank Eye and Vision Consortium. (2015). Frequency and distribution of refractive error in adult life: Methodology and findings of the UK Biobank Study. PLOS ONE, 10(10), e0139780. https://doi.org/10.1371/journal.pone.0139780
Czepita, D., Mojsa, A., & Zejmo, M. (2008). Prevalence of myopia and hyperopia among urban and rural schoolchildren in Poland. Annales Academiae Medicae Stetinensis, 54(1), 17–21. https://pubmed.ncbi.nlm.nih.gov/19127805/
Dayan, Y. B., Levin, A., Morad, Y., Grotto, I., Ben-David, R., Goldberg, A., Onn, E., Avni, I., Levi, Y., & Benyamini, O. G. (2005). The changing prevalence of myopia in young adults: A 13-year series of population-based prevalence surveys. Investigative Ophthalmology & Visual Science, 46(8), 2760. https://doi.org/10.1167/iovs.04-0260
Donovan, L., Sankaridurg, P., Ho, A., Naduvilath, T., Smith, E. L., 3rd, & Holden, B. A. (2012). Myopia progression rates in urban children wearing single-vision spectacles. Optometry and Vision Science: Official Publication of the American Academy of Optometry, 89(1), 27–32. https://doi.org/10.1097/OPX.0b013e3182357f79
Flitcroft, D. I., He, M., Jonas, J. B., Jong, M., Naidoo, K., Ohno-Matsui, K., Rahi, J., Resnikoff, S., Vitale, S., & Yannuzzi, L. (2019). IMI—Defining and classifying myopia: A proposed set of standards for clinical and epidemiologic studies. Investigative Ophthalmology & Visual Science, 60(3), M20–M30. https://doi.org/10.1167/iovs.18-25957
Franchina, M., Yazar, S., Hunter, M., Gajdatsy, A., deSousa, J., Hewitt, A. W., & Mackey, D. A. (2014). Myopia and skin cancer are inversely correlated: Results of the Busselton Healthy Ageing Study. Medical Journal of Australia, 200(9), 521–522. https://doi.org/10.5694/mja14.00086
French, A. N., Morgan, I. G., Burlutsky, G., Mitchell, P., & Rose, K. A. (2013). Prevalence and 5- to 6-year incidence and progression of myopia and hyperopia in Australian schoolchildren. Ophthalmology, 120(7), 1482–1491. https://doi.org/10.1016/j.ophtha.2012.12.018
French, A. N., O’Donoghue, L., Morgan, I. G., Saunders, K. J., Mitchell, P., & Rose, K. A. (2012). Comparison of refraction and ocular biometry in European Caucasian children living in Northern Ireland and Sydney, Australia. Investigative Ophthalmology & Visual Science, 53(7), 4021. https://doi.org/10.1167/iovs.12-9556
Goh, P. P., Abqariyah, Y., Pokharel, G. P., & Ellwein, L. B. (2005). Refractive error and visual impairment in school-age children in Gombak District, Malaysia. Ophthalmology, 112(4), 678–685. https://doi.org/10.1016/j.ophtha.2004.11.034
Gwon, S. H., & Lee, D. C. (2023). Factors associated with myopia in 19-year-old adult men in Korea between 2014 and 2020. Scientific Reports, 13(1), 11581. https://doi.org/10.1038/s41598-023-38569-w
Holden, B. A., Fricke, T. R., Wilson, D. A., Jong, M., Naidoo, K. S., Sankaridurg, P., Wong, T. Y., Naduvilath, T. J., & Resnikoff, S. (2016). Global prevalence of myopia and high myopia and temporal trends from 2000 through 2050. Ophthalmology, 123(5), 1036–1042. https://doi.org/10.1016/j.ophtha.2016.01.006
Hu, Y. Y., Wu, J. F., Lu, T. L., Wu, H., Sun, W., Wang, X. R., Bi, H. S., & Jonas, J. B. (2015). Effect of cycloplegia on the refractive status of children: The Shandong Children Eye Study. PLOS ONE, 10(2), e0117482. https://doi.org/10.1371/journal.pone.0117482
Hyman, L., Gwiazda, J., Marsh-Tootle, W. L., Norton, T. T., Hussein, M., & COMET Group. (2001). The Correction of Myopia Evaluation Trial (COMET): Design and general baseline characteristics. Controlled Clinical Trials, 22(5), 573–592. https://doi.org/10.1016/s0197-2456(01)00156-8
Ip, J. M., Huynh, S. C., Robaei, D., Kifley, A., Rose, K. A., Morgan, I. G., Wang, J. J., & Mitchell, P. (2008). Ethnic differences in refraction and ocular biometry in a population-based sample of 11–15-year-old Australian children. Eye, 22(5), 649–656. https://doi.org/10.1038/sj.eye.6702701
Jones-Jordan, L. A., Sinnott, L. T., Chu, R. H., Cotter, S. A., Kleinstein, R. N., Manny, R. E., Mutti, D. O., Twelker, J. D., Zadnik, K., & CLEERE Study Group. (2021). Myopia progression as a function of sex, age, and ethnicity. Investigative Ophthalmology & Visual Science, 62(10), 36. https://doi.org/10.1167/iovs.62.10.36
Jones-Jordan, L. A., Sinnott, L. T., Manny, R. E., Cotter, S. A., Kleinstein, R. N., Mutti, D. O., Twelker, J. D., Zadnik, K., & Collaborative Longitudinal Evaluation of Ethnicity and Refractive Error. (CLEERE) Study Group. (2010). Early childhood refractive error and parental history of myopia as predictors of myopia. Investigative Ophthalmology & Visual Science, 51(1), 115–121. https://doi.org/10.1167/iovs.08-3210
Jung, S. K., Lee, J. H., Kakizaki, H., & Jee, D. (2012). Prevalence of myopia and its association with body stature and educational level in 19-year-old male conscripts in Seoul, South Korea. Investigative Ophthalmology & Visual Science, 53(9), 5579–5583. https://doi.org/10.1167/iovs.12-10106
Kempen, J. H., Mitchell, P., Lee, K. E., Tielsch, J. M., Broman, A. T., Taylor, H. R., Ikram, M. K., Congdon, N. G., O’Colmain, B. J., & Eye Diseases Prevalence Research Group. (2004). The prevalence of refractive errors among adults in the United States, Western Europe, and Australia. Archives of Ophthalmology, 122(4), 495–505. https://doi.org/10.1001/archopht.122.4.495
Khanal, S., & Dhakal, R. (2024). Myopia progression trends from 1980 to 2020. Investigative Ophthalmology & Visual Science, 65(7), 173.
Kim, H., Seo, J. S., Yoo, W. S., Kim, G. N., Kim, R. B., Chae, J. E., Chung, I., Seo, S. W., & Kim, S. J. (2020). Factors associated with myopia in Korean children: Korea National Health and Nutrition Examination Survey 2016–2017 (KNHANES VII). BMC Ophthalmology, 20(1), 31. https://doi.org/10.1186/s12886-020-1316-6
Kleinstein, R. N., Sinnott, L. T., Jones-Jordan, L. A., Sims, J., Zadnik, K., & Collaborative Longitudinal Evaluation of Ethnicity and Refractive Error (CLEERE) Study Group. (2012). New cases of myopia in children. Archives of Ophthalmology, 130(10), 1274–1279. https://doi.org/10.1001/archophthalmol.2012.1449
Kobia-Acquah, E., Flitcroft, D. I., Akowuah, P. K., Lingham, G., & Loughman, J. (2022). Regional variations and temporal trends of childhood myopia prevalence in Africa: A systematic review and meta-analysis. Ophthalmic and Physiological Optics, 42(6), 1232–1252. https://doi.org/10.1111/opo.13035
Koh, V., Yang, A., Saw, S. M., Chan, Y. H., Lin, S. T., Tan, M. M. H., Tey, F., Nah, G., & Ikram, M. K. (2014). Differences in prevalence of refractive errors in young Asian males in Singapore between 1996–1997 and 2009–2010. Ophthalmic Epidemiology, 21(4), 247–255. https://doi.org/10.3109/09286586.2014.928824
Lee, K. E., Klein, B. E., & Klein, R. (1999). Changes in refractive error over a 5-year interval in the Beaver Dam Eye Study. Investigative Ophthalmology & Visual Science, 40(8), 1645–1649. https://pubmed.ncbi.nlm.nih.gov/10393030/
Lee, S. S.-Y., Lingham, G., Sanfilippo, P. G., Hammond, C. J., Saw, S.-M., Guggenheim, J. A., Yazar, S., & Mackey, D. A. (2022). Incidence and progression of myopia in early adulthood. JAMA Ophthalmology, 140(2), 162. https://doi.org/10.1001/jamaophthalmol.2021.5067
Lee, S. S.-Y., Lingham, G., Wang, C. A., Torres, S. D., Pennell, C. E., Hysi, P. G., Hammond, C. J., Gharahkhani, P., Clark, R., Guggenheim, J. A., & Mackey, D. A. (2023). Changes in refractive error during young adulthood: The effects of longitudinal screen time, ocular sun exposure, and genetic predisposition. Investigative Ophthalmology & Visual Science, 64(14), 28. https://doi.org/10.1167/iovs.64.14.28
Lee, S. H., Tsai, P. C., Chiu, Y. C., Wang, J. H., & Chiu, C. J. (2024). Myopia progression after cessation of atropine in children: a systematic review and meta-analysis. Frontiers in Pharmacology, 15, 1343698. https://doi.org/10.3389/fphar.2024.1343698
Li, T., Zhou, X., Zhu, J., Tang, X., & Gu, X. (2019). Effect of cycloplegia on the measurement of refractive error in Chinese children. Clinical & Experimental Optometry, 102(2), 160–165. https://doi.org/10.1111/cxo.12829
Lingham, G., Mackey, D. A., Zhu, K., Lucas, R. M., Black, L. J., Oddy, W. H., Holt, P., Walsh, J. P., Sanfilippo, P. G., Chan She Ping-Delfos, W., & Yazar, S. (2021). Time spent outdoors through childhood and adolescence—assessed by 25-hydroxyvitamin D concentration—and risk of myopia at 20 years. Acta Ophthalmologica, 99(6), 679–687. https://doi.org/10.1111/aos.14709
Lingham, G., Yazar, S., Lucas, R. M., Milne, E., Hewitt, A. W., Hammond, C. J., MacGregor, S., Rose, K. A., Chen, F. K., He, M., Guggenheim, J. A., Clarke, M. W., Saw, S., Williams, C., Coroneo, M. T., Straker, L., & Mackey, D. A. (2021). Time spent outdoors in childhood is associated with reduced risk of myopia as an adult. Scientific Reports, 11(1). https://doi.org/10.1038/s41598-021-85825-y
Logan, N. S., Shah, P., Rudnicka, A. R., Gilmartin, B., & Owen, C. G. (2011). Childhood ethnic differences in ametropia and ocular biometry: the Aston Eye Study. Ophthalmic & Physiological Optics: The Journal of the British College of Ophthalmic Opticians (Optometrists), 31(5), 550–558. https://doi.org/10.1111/j.1475-1313.2011.00862.x
Loughman, J., Kobia-Acquah, E., Lingham, G., Butler, J., Loskutova, E., Mackey, D. A., Lee, S. S. Y., & Flitcroft, D. I. (2024). Myopia outcome study of atropine in children: Two-year result of daily 0.01% atropine in a European population. Acta Ophthalmologica, 102(3), e245–e256. https://doi.org/10.1111/aos.15761
Mackey, D. (2023, December 5). Sunshine and nightshade to prevent myopia [Workshop presentation]. Workshop on the Rise in Myopia: Exploring Possible Contributors and Investigating Screening Practices, Policies, and Programs. National Academies of Sciences, Engineering, and Medicine, Washington, DC, United States. https://www.nationalacademies.org/event/41360_12-2023_workshop-on-the-rise-in-myopia-exploring-possible-contributors-and-investigating-screening-practices-policies-and-programs
Mackey, D. A., Franchina, M., Yazar, S., Hunter, M., Gajdatsy, A., deSousa, J., & Hewitt, A. W. (2014, April 30). Myopia and skin cancer are inversely correlated: Results of the Busselton Healthy Ageing Study. Investigative Ophthalmology & Visual Science, 55, 1274. https://iovs.arvojournals.org/article.aspx?articleid=2266491
Mackey, D. A., Lingham, G., Lee, S. S., Hunter, M., Wood, D., Hewitt, A. W., Mitchell, P., Taylor, H. R., Hammond, C. J., & Yazar, S. (2021). Change in the prevalence of myopia in Australian middle-aged adults across 20 years. Clinical & Experimental Ophthalmology, 49(9), 1039–1047. https://doi.org/10.1111/ceo.13980
Mangan, T. (2019, February 19). Astigmatism. All About Vision. https://www.allaboutvision.com/conditions/astigmatism.htm
Matsumura, H., & Hirai, H. (1999). Prevalence of myopia and refractive changes in students from 3 to 17 years of age. Survey of Ophthalmology, 44(Suppl 1), S109–S115. https://doi.org/10.1016/s0039-6257(99)00094-6
Morgan, I., & Rose, K. (2005). How genetic is school myopia? Progress in Retinal and Eye Research, 24(1), 1–38. https://doi.org/10.1016/j.preteyeres.2004.06.004
Morgan, I. G., Ohno-Matsui, K., & Saw, S.-M. (2012). Myopia. The Lancet, 379(9827), 1739–1748. https://doi.org/10.1016/S0140-6736(12)60272-4
Morgan, I. G., Rose, K. A., & Ellwein, L. B. (2010). Is emmetropia the natural endpoint for human refractive development? An analysis of population-based data from the refractive error study in children (RESC). Acta Ophthalmologica, 88(8), 877–884. https://doi.org/10.1111/j.1755-3768.2009.01800.x
Morgan, R. W., Speakman, J. S., & Grimshaw, S. E. (1975). Inuit myopia: An environmentally induced “epidemic”? Canadian Medical Association Journal, 112(5), 575–577. https://www.ncbi.nlm.nih.gov/pmc/articles/PMC1956268/
Multi-Ethnic Pediatric Eye Disease Study Group. (2010). Prevalence of myopia and hyperopia in 6- to 72-month-old African American and Hispanic children: The Multi-Ethnic Pediatric Eye Disease Study. Ophthalmology, 117(1), 140–147.e3. https://doi.org/10.1016/j.ophtha.2009.06.009
Mutti, D. O., & Zadnik, K. (2000). Age-related decreases in the prevalence of myopia: longitudinal change or cohort effect? Investigative Ophthalmology & Visual Science, 41(8), 2103–2107. https://pubmed.ncbi.nlm.nih.gov/10892850/
National Eye Institute. (2020). Projections for myopia (2010-2030-2050). Nearsightedness (myopia) tables. https://www.nei.nih.gov/learn-about-eye-health/eye-health-data-and-statistics/nearsightedness-myopia-data-and-statistics/nearsightedness-myopia-tables
National Research Council. (1989). Myopia: Prevalence and progression. National Academies Press. https://doi.org/10.17226/1420
O’Donoghue, L., McClelland, J. F., Logan, N. S., Rudnicka, A. R., Owen, C. G., & Saunders, K. J. (2010). Refractive error and visual impairment in school children in Northern Ireland. The British Journal of Ophthalmology, 94(9), 1155–1159. https://doi.org/10.1136/bjo.2009.176040
Ojaimi, E., Rose, K. A., Morgan, I. G., Smith, W., Martin, F. J., Kifley, A., Robaei, D., & Mitchell, P. (2005). Distribution of ocular biometric parameters and refraction in a population-based study of Australian children. Investigative Ophthalmology & Visual Science, 46(8), 2748–2754. https://doi.org/10.1167/iovs.04-1324
Pan, Y., Tarczy-Hornoch, K., Cotter, S. A., Wen, G., Borchert, M. S., Azen, S. P., Varma, R., & Multi-Ethnic Pediatric Eye Disease Study Group. (2009). Visual acuity norms in pre-school children: The Multi-Ethnic Pediatric Eye Disease Study. Optometry and Vision Science: Official Publication of the American Academy of Optometry, 86(6), 607–612. https://doi.org/10.1097/OPX.0b013e3181a76e55
Pan, C. W., Zheng, Y. F., Anuar, A. R., Chew, M., Gazzard, G., Aung, T., Chen, C.-Y., Wong, T. Y., & Saw, S.-M. (2013). Prevalence of refractive errors in a multiethnic Asian population: The Singapore Epidemiology of Eye Disease Study. Investigative Ophthalmology & Visual Science, 54(4), 2590–2598. https://doi.org/10.1167/iovs.13-11725
Rappon, J., Chung, C., Young, G., Hunt, C., Neitz, J., Neitz, M., & Chalberg, T. (2023). Control of myopia using diffusion optics spectacle lenses: 12-month results of a randomised controlled, efficacy and safety study (CYPRESS). The British Journal of Ophthalmology, 107(11), 1709–1715. https://doi.org/10.1136/bjo-2021-321005
Repka, M. X., Weise, K. K., Chandler, D. L., Wu, R., Melia, B. M., Manny, R. E., Kehler, L. A. F., Jordan, C. O., Raghuram, A., Summers, A. I., Lee, K. A., Petersen, D. B., Erzurum, S. A., Pang, Y., Lenhart, P. D., Ticho, B. H., Beck, R. W., Kraker, R. T., Holmes, J. M., Cotter, S. A., … Pediatric Eye Disease Investigator Group. (2023). Low-dose 0.01% atropine eye drops vs placebo for myopia control: A randomized clinical trial. JAMA Ophthalmology, 141(8), 756–765. https://doi.org/10.1001/jamaophthalmol.2023.2855
Resnikoff, S., Pascolini, D., Mariotti, S. P., & Pokharel, G. P. (2008). Global magnitude of visual impairment caused by uncorrected refractive errors in 2004. Bulletin of the World Health Organization, 86(1), 63–70. https://doi.org/10.2471/blt.07.041210
Robaei, D., Rose, K., Ojaimi, E., Kifley, A., Huynh, S., & Mitchell, P. (2005). Visual acuity and the causes of visual loss in a population-based sample of 6-year-old Australian children. Ophthalmology, 112(7), 1275–1282. https://doi.org/10.1016/j.ophtha.2005.01.052
Rozema, J. J., Boulet, C., Cohen, Y., Stell, W. K., Iribarren, L., van Rens, G. H. M. B., & Iribarren, R. (2021). Reappraisal of the historical myopia epidemic in native Arctic communities. Ophthalmic and Physiological Optics, 41(6), 1332–1345. https://doi.org/10.1111/opo.12879
Sanfilippo, P. G., Chu, B. S., Bigault, O., Kearns, L. S., Boon, M. Y., Young, T. L., Hammond, C. J., Hewitt, A. W., & Mackey, D. A. (2014). What is the appropriate age cut-off for cycloplegia in refraction. Acta Ophthalmologica, 92(6), e458–e462. https://doi.org/10.1111/aos.12388
Sankaridurg, P., Tahhan, N., Kandel, H., Naduvilath, T., Zou, H., Frick, K. D., Marmamula, S., Friedman, D. S., Lamoureux, E., Keeffe, J., Walline, J. J., Fricke, T. R., Kovai, V., & Resnikoff, S. (2021). IMI impact of myopia. Investigative Ophthalmology & Visual Science, 62(5), 2. https://doi.org/10.1167/iovs.62.5.2
Shapira, Y., Mimouni, M., Machluf, Y., Chaiter, Y., Saab, H., & Mezer, E. (2019). The increasing burden of myopia in Israel among young adults over a generation. Ophthalmology, 126(12), 1617–1626. https://doi.org/10.1016/j.ophtha.2019.06.025
Tailor, P. D., Xu, T. T., Tailor, S., Asheim, C., & Olsen, T. W. (2024). Trends in myopia and high myopia from 1966 to 2019 in Olmsted County, Minnesota. American Journal of Ophthalmology, 259, 35–44. https://doi.org/10.1016/j.ajo.2023.10.019
Taylor, H. R., Xie, J., Fox, S., Dunn, R. A., Arnold, A.-L., & Keeffe, J. E. (2010). The prevalence and causes of vision loss in Indigenous Australians: The National Indigenous Eye Health Survey. Medical Journal of Australia, 192(6), 312–318. https://doi.org/10.5694/j.1326-5377.2010.tb03529.x
Tedja, M. S., Wojciechowski, R., Hysi, P. G., Eriksson, N., Furlotte, N. A., Verhoeven, V. J. M., Iglesias, A. I., Meester-Smoor, M. A., Tompson, S. W., Fan, Q., Khawaja, A. P., Cheng, C. Y., Höhn, R., Yamashiro, K., Wenocur, A., Grazal, C., Haller, T., Metspalu, A., Wedenoja, J., Jonas, J. B., … Klaver, C. C. W. (2018). Genome-wide association meta-analysis highlights light-induced signaling as a driver for refractive error. Nature Genetics, 50(6), 834–848. https://doi.org/10.1038/s41588-018-0127-7
Villarreal, G. M., Ohlsson, J., Cavazos, H., Abrahamsson, M., & Mohamed, J. H. (2003). Prevalence of myopia among 12- to 13-year-old schoolchildren in northern Mexico. Optometry and Vision Science: Official Publication of the American Academy of Optometry, 80(5), 369–373. https://doi.org/10.1097/00006324-200305000-00011
Vision & Eye Health Surveillance System. (2016). Annual prevalence of diagnosed disorders of refection and accommodation, myopia, 2016 [Map]. Ceneters for Disease Control and Prevention. https://ddt-vehss.cdc.gov/LP?Level1=Vision+Problems+and+Blindness&Level2=Diagnosed+Vision+Disorders&Level3=Diagnosed+Refractive+Error&Level4=Diagnosed+Myopia&LocationId=&DataSourceId=MEDICARE&IndicatorId=QDXDC7~R7_1&ShowFootnotes=true&View=NationalMap&CompareViewYear=1&CompareId=&CompareId2=&YearId=YR7&ResponseId=R7_1&AgeId=AGE017&GenderId=GALL&RaceId=ALLRACE&RiskFactorId=RFALL&RiskFactorResponseId=RFTOT&DataValueTypeId=CRDPREV&MapClassifierId=quantile&MapClassifierCount=4&CountyFlag=N
___. (2019). Annual prevalence of diagnosed disorders of refection and accommodation, myopia, 2019 [Map]. Ceneters for Disease Control and Prevention. https://ddt-vehss.cdc.gov/LP?Level1=Vision+Problems+and+Blindness&Level2=Diagnosed+Vision+Disorders&Level3=Diagnosed+Refractive+Error&Level4=Diagnosed+Myopia&LocationId=&DataSourceId=MEDICARE&IndicatorId=QDXDC7~R7_1&ShowFootnotes=true&View=NationalMap&CompareViewYear=1&CompareId=&CompareId2=&YearId=YR11&ResponseId=R7_1&AgeId=AGE017&GenderId=GALL&RaceId=ALLRACE&RiskFactorId=RFALL&RiskFactorResponseId=RFTOT&DataValueTypeId=CRDPREV&MapClassifierId=quantile&MapClassifierCount=4&CountyFlag=N
Vitale, S., Ellwein, L., Cotch, M. F., Ferris, F. L., & Sperduto, R. (2008). Prevalence of refractive error in the United States, 1999-2004. Archives of Ophthalmology, 126(8), 1111–1119. https://doi.org/10.1001/archopht.126.8.1111
Vitale, S., Sperduto, R. D., & Ferris, F. L., III. (2009). Increased prevalence of myopia in the United States between 1971–1972 and 1999–2004. Archives of Ophthalmology, 127(12), 1632–1639. https://doi.org/10.1001/archophthalmol.2009.303
Walline, J. J., Walker, M. K., Mutti, D. O., Jones-Jordan, L. A., Sinnott, L. T., Giannoni, A. G., Bickle, K. M., Schulle, K. L., Nixon, A., Pierce, G. E., Berntsen, D. A., & BLINK Study Group. (2020). Effect of high add power, medium add power, or single-vision contact lenses on myopia progression in children: The BLINK randomized clinical trial. JAMA, 324(6), 571–580. https://doi.org/10.1001/jama.2020.10834
Wang, J., Han, Y., Musch, D. C., Li, Y., Wei, N., Qi, X., Ding, G., Li, X., Li, J., Song, L., Zhang, Y., Ning, Y., Zeng, X., Li, Y., Sun, L., Hua, N., Li, S., Jardines, S., & Qian, X. (2023a). Evaluation and follow-up of myopia prevalence among school-aged children subsequent to the COVID-19 home confinement in Feicheng, China. JAMA Ophthalmology, 141(4), 333–340. https://doi.org/10.1001/jamaophthalmol.2022.6506
Wang, J., Li, Y., Musch, D. C., Wei, N., Qi, X., Ding, G., Li, X., Li, J., Song, L., Zhang, Y., Ning, Y., Zeng, X., Hua, N., Li, S., & Qian, X. (2021). Progression of myopia in school-aged children after COVID-19 home confinement. JAMA Ophthalmology, 139(3), 293–300. https://doi.org/10.1001/jamaophthalmol.2020.6239
Wang, Y. X., Pan, Z., Wang, Z. Y., Li, Z., Huang, Y., Wang, J., Zhang, C., Li, F., Jonas, J. B., & Wong, T. Y. (2023b). 25-year trend in myopia prevalence in Chinese school children and adolescents: A nationwide analysis from 1998–2022. Investigative Ophthalmology & Visual Science, 64(8), 3821. https://iovs.arvojournals.org/article.aspx?articleid=2790769
Wen, G., Tarczy-Hornoch, K., McKean-Cowdin, R., Cotter, S. A., Borchert, M., Lin, J., Kim, J., Varma, R., & Multi-Ethnic Pediatric Eye Disease Study Group (2013). Prevalence of myopia, hyperopia, and astigmatism in non-Hispanic white and Asian children: Multi-ethnic pediatric eye disease study. Ophthalmology, 120(10), 2109–2116. https://doi.org/10.1016/j.ophtha.2013.06.039
Williams, K. M., Bertelsen, G., Cumberland, P., Wolfram, C., Verhoeven, V. J., Anastasopoulos, E., Buitendijk, G. H., Cougnard-Grégoire, A., Creuzot-Garcher, C., Erke, M. G., Hogg, R., Höhn, R., Hysi, P., Khawaja, A. P., Korobelnik, J. F., Ried, J., Vingerling, J. R., Bron, A., Dartigues, J. F., … European Eye Epidemiology Consortium. (2015). Increasing prevalence of myopia in Europe and the impact of education. Ophthalmology, 122(7), 1489–1497. https://doi.org/10.1016/j.ophtha.2015.03.018
Wolfram, C., Höhn, R., Kottler, U., Wild, P., Blettner, M., Bühren, J., Pfeiffer, N., & Mirshahi, A. (2014). Prevalence of refractive errors in the European adult population: The Gutenberg Health Study (GHS). British Journal of Ophthalmology, 98(7), 857–861. https://doi.org/10.1136/bjophthalmol-2013-304228
Woodruff, M. E., & Samek, M. J. (1976). The refractive status of Belcher Island Eskimos. Canadian Journal of Public Health, 67(4), 314–320. https://pubmed.ncbi.nlm.nih.gov/963652/
Yam, J. C., Jiang, Y., Tang, S. M., Law, A. K. P., Chan, J. J., Wong, E., Ko, S. T., Young, A. L., Tham, C. C., Chen, L. J., & Pang, C. P. (2019). Low-Concentration Atropine for Myopia Progression (LAMP) Study: A randomized, double-blinded, placebo-controlled trial of 0.05%, 0.025%, and 0.01% atropine eye drops in myopia control. Ophthalmology, 126(1), 113–124. https://doi.org/10.1016/j.ophtha.2018.05.029
Zadnik, K., Schulman, E., Flitcroft, I., Fogt, J. S., Blumenfeld, L. C., Fong, T. M., Lang, E., Hemmati, H. D., Chandler, S. P., & CHAMP Trial Group Investigators. (2023). Efficacy and safety of 0.01% and 0.02% atropine for the treatment of pediatric myopia progression over 3 years: A randomized clinical trial. JAMA ophthalmology, 141(10), 990–999. https://doi.org/10.1001/jamaophthalmol.2023.2097
Zhang, X. J., Zhang, Y., Kam, K. W., Tang, F., Li, Y., Ng, M. P. H., Young, A. L., Ip, P., Tham, C. C., Chen, L. J., Pang, C. P., & Yam, J. C. (2023). Prevalence of myopia in children before, during, and after COVID-19 restrictions in Hong Kong. JAMA Network Open, 6(3), e234080. https://doi.org/10.1001/jamanetworkopen.2023.4080


