Assessing Lifecycle and Human Costs of Bus Operator Workstation Design and Components (2024)
Chapter: 2 Literature Review
CHAPTER 2
Literature Review
Human variability exists in various forms. Such variability is responsible for a broad spectrum of user responses to one solution, and it multiplies the ambiguity in the design process (38). In some cases, users give dissimilar or even conflicting feedback, which pulls the design in opposite directions (34). In vehicle packaging, for instance, drivers vary in body dimensions and have different driving postures. The ideal situation is to design a vehicle package that allows all drivers to safely and comfortably perform all driving tasks without encountering any limitation; however, such high expectation of accommodation requires large adjustment ranges that are not always achievable due to cost, safety, and the desire to reduce vehicle size (3). While packaging a vehicle, all these factors must be considered, and compromises need to be made to find the best possible solution based on these considerations and accommodation possibilities.
This chapter introduces the concept of vehicle packaging and reviews design objectives that are used to measure success. It also presents several approaches that have been developed to design for human variability and discusses the advantages and disadvantages of each.
2.1 Vehicle Packaging
Vehicle packaging is designing the interior layout of a vehicle with the goal of achieving a certain level of accommodation (27). It involves a broad range of design considerations that determine whether the fundamental driving components, such as the pedals and the steering wheel, are within reach (3). Further design considerations include button controls, digital displays, and other elements the driver interacts with. In the automotive industry, designing for vehicle interior layout is one of the first steps, after the body exterior contour design and window openings design (3). Besides spatial fitting, safety-related vision requirements are crucial factors to provide accommodation and comfort for drivers (27).
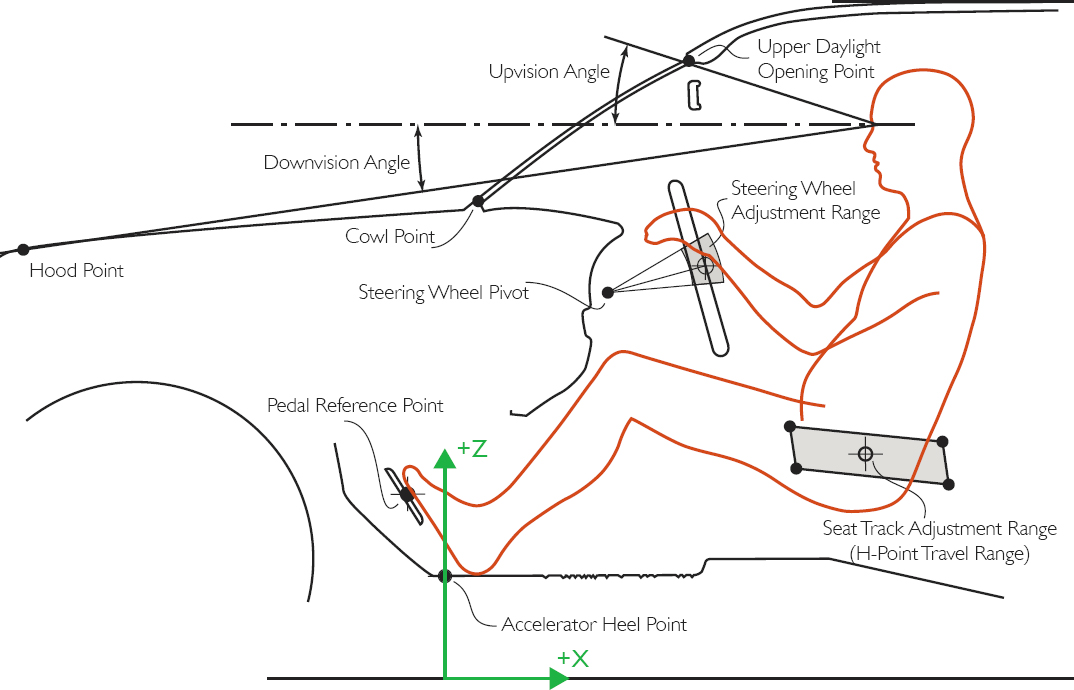
The transportation industry has been evolving, and this trend is not slowing down. The demand for vehicles for uses other than daily commuting has increased greatly and the variety of vehicle class divisions has also multiplied as vehicles of different shapes are developed to suit societal needs (39). Categorizing by interior volume and gross weight, the three major classes are car class (various sizes of compacts, sedans, and wagons), sport utility vehicles (SUVs; various sizes of crossovers and SUVs, and minivans), and trucks (mid- and full-size regular/extended/crew) (40). Vehicles in each class share a similar shape and similar design objectives. While designing the frame, a number of concerns need to be considered; one of the most important is the field of view. The upper daylight opening (UDLO) is the point where the top of the windshield meets the car frame (Figure 2.1), which limits the angle that drivers can see upward. The upvision requirements are different for different categories of vehicles. Drivers must also maintain sufficient downvision; depending on the driver’s eye location, downvision can be limited by either the hood point (a point that represents the tip of the hood) or the cowl point

(where the bottom of the windshield meets the hood) (41). These points are commonly measured from the ground in the Z direction and from the accelerator heel point (AHP) in the X direction (Figure 2.3). Although vehicle packaging is a 3D design, only the X-Z plane is studied in this work because the adjustable components of interest, such as the steering wheel and the seat, are designed on the center line on the driver’s side. Future work could consider the design objectives in the Y direction.
To properly and efficiently design a vehicle package, understanding human anthropometric variability is key. In general, there are two categories of data involved: conventional static measurements and functional task-oriented measurements. Conventional static measurements are done when subjects are in standardized rigid positions, which typically involve lengths, widths, and circumferences (Figure 2.2). They are the fundamental descriptors of a driver’s size and shape, and they do not change due to the driver’s posture, unlike the functional task-oriented measurements. These descriptors are the basis of driver-vehicle spatial fitting (27).
Functional task-oriented measurements indicate the driver’s ability to perform certain tasks, and they can vary among drivers—even among those with similar body dimensions. These are

a function of body segment parameters, strength, and range of motion and include things like reach envelopes and manipulation zones. Vehicle packaging is a complex task: a cab needs to be designed such that drivers not only fit in it, but are able to perform functional tasks, such as turning the steering wheel.
One of the most important reference points is the AHP, the intersection between the accelerator and the floor. Components of vehicle frame geometry (roof, UDLO, cowl point, hood point, etc.) are measured from the ground in the Z direction and from the AHP in the X direction. This reference system works for these components, but is unsuitable for the interior components, such as the seat and the steering wheel, because there is not a direct way of measuring them from the ground. The difficulty of measuring interior components from the ground causes inaccuracy in these measurements. Instead, these interior components are measured from the AHP, since the AHP is a fixed distance from the ground (1). In vehicle packaging research, the AHP is commonly referred to as the origin of the system; this report follows that convention to refer to interior measurements.
When designing the interior layout of a vehicle, it is important to understand each component and its contribution to the overall accommodation. In most vehicles, the steering wheel can tilt around a pivot point, and some can telescope in and out (Figure 2.3). Ideally, a driver’s preferred steering wheel location should fall within the adjustment envelope. In that case, that aspect of driver preference is considered accommodated. If the preferred location lies outside the envelope, the location preference is not accommodated, and the driver would compromise by adjusting the steering wheel center to the nearest point on the envelope. Although the driver cannot obtain the most desirable steering wheel location, they can often achieve moderate comfort by adjusting the rest of their body to adapt (37).
Another adjustable component is the seat. Most seats can move in the fore-aft direction (i.e., horizontally toward the front and rear of the vehicle). For large vehicles, such as trucks and buses, the seat can also move vertically. The adjustment envelope is a rectangle (Figure 2.3), and the goal is to design a seat adjustment envelope to accommodate the majority of drivers. If a driver’s preferred seat position lies outside the envelope, they will adjust the seat to the nearest point on the envelope, as with the steering wheel adjustment (42). Once the locations of the most critical components, steering wheel and seat, are determined, an assessment on eye location can be conducted. Although eye location is rarely a concern of spatial fitting, it is an important consideration in vehicle packaging because it determines the driver’s field of view, which is directly related to driving safety (3). Previous research has found success in estimating drivers’ eye locations as an elliptical model (41), which can be a useful tool to assess vehicle layout reference points, such as cowl point, hood point, and UDLO. This report explicitly studies eye locations, together with steering wheel and seat locations.
In vehicle packaging, the results of accommodation are usually expressed as a percentage. An accommodation rate can be defined as the proportion of the driver population able to meet the spatial fitting requirements and safety requirements (27). For instance, a seat adjustment envelope can be designed to accommodate 95% of the population and implies that 95% of drivers can move the seat to their desired location without encountering any limits, while 5% cannot. The assessment of one objective is intuitive, but the design task becomes challenging when more than one component is adjustable. Therefore, it is important to first distinguish a multivariate problem from a univariate problem (43).
2.1.1 Univariate and Multivariate Analyses
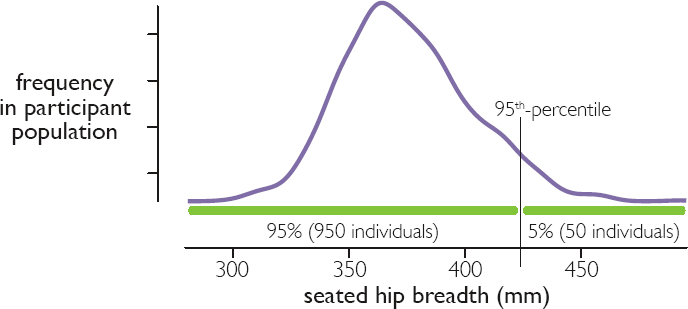
Univariate analysis has guided vehicle packaging practice for over 50 years (44, 45). However, some of the limitations of the method have been understood for nearly as long (46, 47). For example, recommendations for seat height adjustment range may be based on the popliteal height of seated operators. Similarly, seat width recommendations are typically based on seated hip breadth (Figure 2.4). The 95th percentile value is the location separating the lower 95% of the distribution from the upper 5%.
In univariate analysis, each workstation dimension is considered independently of the others. In other words, the data under consideration are analyzed and conclusions drawn without considering other factors (48). Using univariate analysis to solve multivariate problems is known to produce inaccurate estimates of accommodation (49). Historically, the univariate data could be
represented in tables and templates. This simplicity of representation coupled with a long tradition of practice may explain the popularity of the method today despite its known problems.
For most design problems, univariate analysis is not sufficient to achieve the overall goal of a specific level of accommodation; Figure 2.5 illustrates this for two dimensions. Since anthropometric measures are not perfectly correlated, accommodating 95% of the population on two dimensions individually will usually not result in accommodating 95% on both. Individuals disaccommodated on one measure are not the same as those disaccommodated on another. For example, when 95th-percentile values of both popliteal height and seated hip breadth are selected, the overall accommodation for this population is 902/1000 people = 90.2%. Note that it is not possible to determine in advance how much the accommodation level will be affected when multiple variables are considered.
When two or more variables are considered simultaneously, many possible designs will achieve the same level of accommodation. In general, decreased accommodation on one dimension can be traded off for increased accommodation on another while maintaining the same overall level of accommodation. Of course, the accommodation level on each dimension must be at least at the target level (for example, 95%). If the selected anthropometric dimensions are fully independent, the disaccommodated fractions are additive. For example, the two variables in Figure 2.5 are nearly independent. Univariate disaccommodation of 5% of the population on hip breadth and 5% on popliteal height results in a total accommodation of just over 90%–only two individuals in this population are disaccommodated on both dimensions. Accommodating 95% of the population on these two uncorrelated dimensions would require disaccommodating no more than approximately 2.5% on each individual dimension.
This principle is true when looking exclusively at anthropometry, but it extends to all aspects of the operator experience. For example, if 10% of operators are disaccommodated based on fore-aft seat location, there is no reason to expect those individuals are the same as those disaccommodated by vision requirements, strength requirements, or limitations due to fatigue.

Due to these limitations of univariate analysis, a multivariate approach is the best practice for multivariate design problems such as vehicle packaging. Multivariate analyses allow designers to investigate the accommodation level of a combination of design objectives, which reveals the underlying relationships between the different objectives (50) and provides important information on design decision-making.
2.2 Manikin Approach
The variability in human anthropometry is a difficult subject because human bodies vary in size and shape. However, the randomness in most length- or width-related measures follow a distribution, so statistical tools, such as percentiles, are frequently used. Given a group of people ordered from least to greatest by stature, the 5th percentile is that surpassed by 95% of the group and the 95th percentile is that surpassed by 5% of the group. Using percentiles allows for estimating the proportion of a group that meets a certain requirement and determining design limits (51).
A direct way to apply percentiles is through manikins. Each manikin is built to a unique combination of body dimensions suitable for the design project and used to predict human interaction. To detect design limits, boundary manikins are frequently used to represent the extremes of the population. A design that can accommodate the extremes is expected to accommodate those with less extreme body dimensions. In many cases, a small female and a large male are used to approximate the extremities. For instance, a 2.5th-percentile female manikin and a 97.5th-percentile male manikin are frequently used to assess a 95% accommodation level, assuming female and male body dimensions are approximately normally distributed and male bodies are bigger than female bodies.
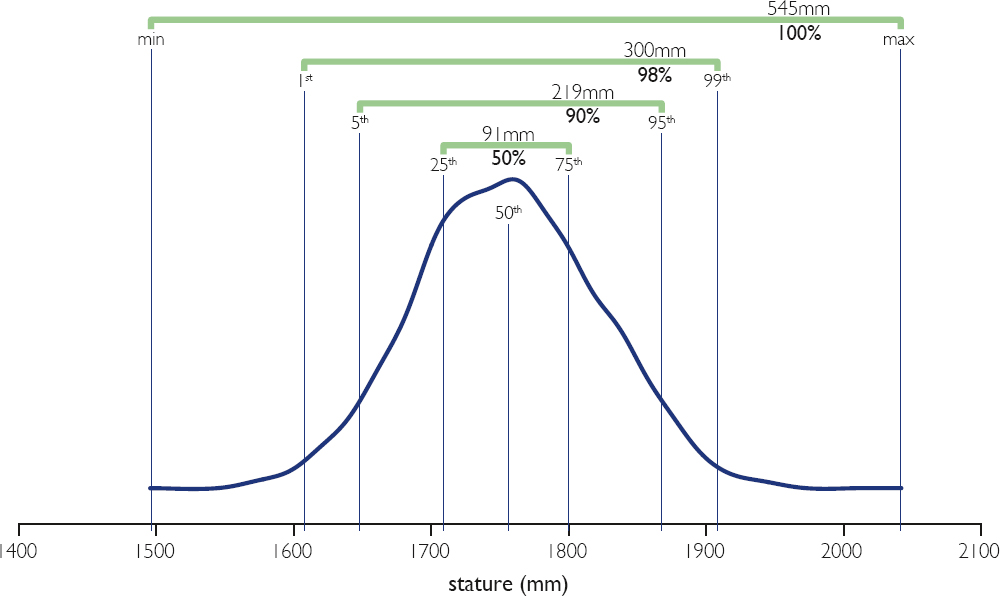
A Gaussian or “normal” distribution contains higher-frequency data in the middle and low-frequency data at the tails. Because of the increased density in the central region of a distribution, relatively small amounts of adjustability, properly located, can accommodate large percentages of a population’s preferred design configuration. A similar amount of adjustability focused on the tails of the distribution will yield much lower accommodation rates. Consider Figure 2.6, a probability density plot for stature, a measure that is approximately normally distributed. The total range across these data is 545 mm, but a design that accommodates the central 219 mm (40%) of the data will accommodate 90% of the individuals. For this reason, it is usually most cost-effective to design for the central portion of the distribution. For some design conditions there is no practical limitation on either the lower (seat width; narrower individuals are not disaccommodated) or upper (seat height; taller lengths are not disaccommodated) bound, so the design is limited by one tail or the other, rather than both.
The manikin approach is relatively easy to understand and is easier to implement, but it has certain limitations; one of these is the reliability of manikins. During the approach, each manikin is a percentile model and represents one user with extreme body dimension. Intuitively, a 90th-percentile manikin is expected to be composed of 90th-percentile body segments, but in reality, these segments would add up to be much taller. By accommodating this 90th-percentile manikin, designers assume those with less extreme body dimensions are also accommodated. However, this assumption has major flaws, especially in complex design problems. A design that accommodates the users with extreme body dimensions will not necessarily accommodate all the users in between the extremes, and an nth-percentile individual does not exist (47).
The manikin approach has been applied in various design fields. For instance, a systematic ergonomics study using manikins was conducted on industrial workstation design in 1996 (52). In 1998, a study was conducted on the optimization of viewing angle for touchscreen displays using a similar approach (53). Manikins have been used in the automotive industry as early as 1962. In the late 1950s, the Society of Automotive Engineers (SAE) first proposed the concept
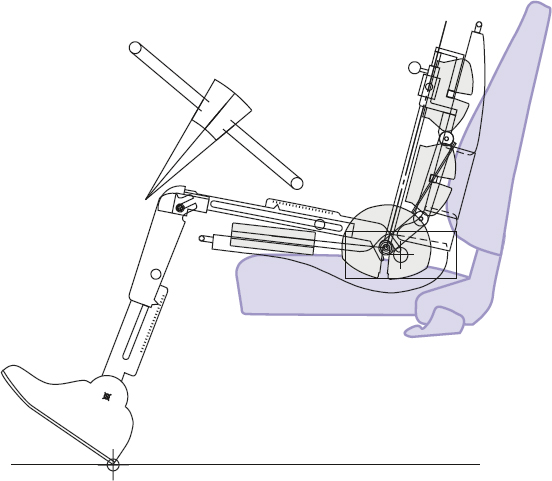
of applying standardized procedures and tools in vehicle packaging and composed J826, which introduced a 2D H-point template to estimate packaging profile and a 3D H-point machine for defining and measuring occupant seating accommodations. This machine, one of the first uses of manikins in the automotive industry, defines the location of the H-point (generally, where a driver’s hips would be), which is specific to a seat (42). An update to J826 uses the improved Automotive Seat and Package Evaluation and Comparison Tools (ASPECT) manikin, shown in Figure 2.7 (54).
The manikin approach, or the percentile model, is one of the most commonly used approaches in ergonomic design, and it studies the distribution aspect of anthropometric measurements. The investigation of how an individual relates to a population is its core concept. For example, when designing for a single measure, the 5th and 95th percentile values might be specified as limits. The expectation would be that individuals smaller than the 5th and larger than the 95th percentile would not be able to use the design in the intended manner (55). This simple and intuitive approach remains reliable for most univariate problems. In many design practices, by designing for both the lower extreme user and the upper extreme user, designers assume all the users in the middle are accommodated. This assumption is valid in simple design cases but loses its validity when assessing a full body that consists of multiple measurements. Although statistics and research (including this report) often refer to an “nth-percentile user,” such a person does not really exist, because of human variability. There are countless measurements to define a human body, and it is impossible to find one person who is nth percentile on every single measurement (56).
Manikins are frequently used in vehicle packaging to simulate how a user would interact with the main components in a vehicle based on body anthropometry. It is a simple and visual way to assess multivariate accommodation, but it has major flaws. Specifically, driving posture plays a critical role in vehicle packaging, but it is not considered in the manikin approach (57). In practice, designers often posture the manikins manually based on either personal intuition or a standardized procedure, which poorly quantifies human postural variability. In order to solve this bias, several methods with a focus on posturing were developed.
2.3 Population Model Approach
The manikin approach provides a visual and intuitive way to estimate user interaction under the assumptions given in section 2.2, but it cannot provide knowledge on human posturing. The population model approach, on the other hand, directly investigates the interaction between users and a design. This approach first identifies a sample group, then conducts a human interaction experiment for this group and establishes a model based on the results. This model is then applied to the user population so a certain percentage of the population can be accommodated (57).
Unlike the manikin approach, which simulates a percentile-based user who frequently represents an extremity, the population model approach targets the actual users. To lower the cost of the design, a sample group, rather than the entire population, is commonly selected for an experiment or a focus study. Although there are advantages to reducing the size of the sample group, it must be relatively large to ensure it can adequately represent the target user. Certain traits could be magnified when the group is small, which could lead to biases. In addition, a random sampling method must be used; this is essential to the validity of the results (27).
During the experimental study with the sample group, participants are frequently invited to interact with a robust prototype that provides an excessive range of adjustment, and their responses are recorded and analyzed. Due to the interactive nature of the population model and its use of prototypes, it is frequently used in product design. For instance, a research group used a 3D laser scanner to measure standoff distance between the head and the back of the helmet of a representative sample group of 30 participants. This information was used to guide future ballistic helmet design (58). Similarly, a study was conducted using a population model approach to determine the optimal grip span with respect to hand anthropometry. During the process, a total of 12 participants were invited to interact with the hand-grip device (59).
In order to study postural preferences through a population model approach, participation from a large number of randomly sampled drivers is required. While each participant is in a testing environment, a tracking system can be used to continuously monitor the location of the body landmarks of interest. The relative spatial locations of these landmarks show the subject’s
body configuration, which indicates their postural preference, and the absolute spatial locations determine whether the subject is accommodated by the vehicle layout or not.
There are many examples of the population model being applied in the automotive industry. In a study published by the University of Michigan Transportation Research Institute (UMTRI) in 2017, a statistical body shape model was used for seated vehicle occupants to study their driving preference. This reliable model was established from 147 participants. The data of various seating postures was captured with a laser scanner together with manually measured body landmarks (60). There are many more applications of the population model approach in the SAE as it is one of the fundamental concepts in the SAE International recommended practices (61).
2.4 Hybrid Approach
Although the population model approach shows improvement from the manikin approach by considering postural preferences, it still has several limitations that cannot be ignored. The most important one is that the population model can only be applied to one single design case. Since the sample group is selected from the user population, this model is limited to that user population and can only be applied in an identical design case, which rarely happens in real life. Even when designing the same product for a slightly different user population, the entire process must be repeated. An adequately large group needs to be sampled randomly, and participants have to participate in the accommodation experiment individually, after which data can be analyzed. The process of creating a valid model this way is time-consuming and costly. It would be more efficient to be able to reuse the previous data.
To conquer the issues with the population model, a hybrid approach was developed. The hybrid approach merges the strengths of the postural preference model and the anthropometry-configurable manikins (57). The goal is to confidently apply the same model to a different user population, so a quantitative relationship must be found that relates the desired outcome to anthropometric measurements. These anthropometric measurements serve as predictors of the model. When applying the model to a different user population, anthropometric measurements can be modified to best match the new user population, and the results from the hybrid model are adjusted accordingly.
By diligently collecting data and interpreting the underlying relationships, researchers have found success in the hybrid model. For example, a group of researchers used an adjustable bicycle simulator to assess comfort level on bicycles and validate commercial bicycle accommodation. To do so, they performed correlation analysis on preferred bicycle dimensions and body anthropometric measurements and found that saddle-pedal distance is strongly related to crotch height (62). A similar approach, relating outcome variables with anthropometric measurements, can be found in the Yakou et al. study on evaluation of cylindrical objects, which examines handle diameter and hand length (63).
2.4.1 Virtual Fit Testing
The most accurate assessment of the level of accommodation provided by a design would be obtained by having a large population of individuals representative of the target user population interacting with a high-fidelity physical prototype. Because such testing is generally not feasible due to cost and time requirements, virtual fit testing (VFT) can be conducted using abstract representations of individuals suitable for computational evaluation. In a traditional application of anthropometric data, only summary statistics for each variable across the population would be used. The interactions among the various variables are not considered in this approach. In contrast, VFT examines each individual and their simulated interaction with the design, then computes the fraction of the total population that is accommodated.
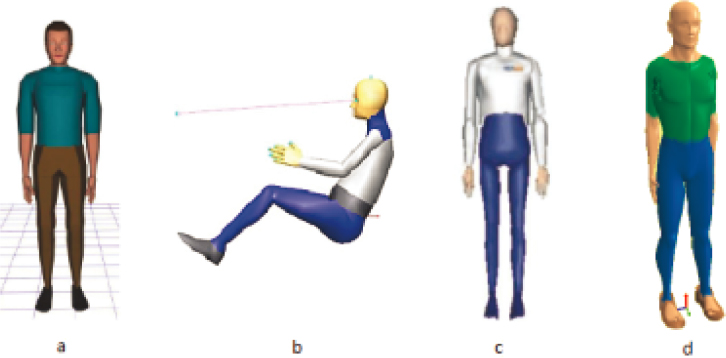
Digital human models (DHMs) are one strategy for conducting virtual fits. They were developed in the 1990s to virtually represent humans as an improvement to the manikin approach. Since then, DHMs have increasingly been used for vehicle packaging and other ergonomics design (64). Since the creation of DHMs, they have been widely used for task performance simulation. One of their advantages is the facilitation of a quicker design process (36). With the development of computers, DHMs can be an important part of product design and provide insights on product usability (65). Instead of competing on money investment, companies shift their focus to engineering research and computing power. Figure 2.8 shows the DHMs generated in four different software tools.
Using DHMs, designers can visually assess the fit of all interior components and make appropriate adjustments to improve overall accommodation (Figure 2.9). While DHMs produce useful visualizations and the opportunity to simultaneously consider a number of measures, there are also limitations. In particular, each model only represents one user and one of their associated preferences (e.g., posture). Since each model requires meaningful amounts of time to place and posture, the use of more than a few manikins is rare.
Improvements to the VFT approach can be made by using large numbers of manikins. For example, Figure 2.10 is the result of analyses from a study assessing posturing and fit involving 23 SAE Class B truck drivers in several different truck and bus cabs (66). The four panels show a cross section of the workstation. The green stick figure shows the anthropometry and as-measured posture for that individual. The other dots show estimated preferred location for 100 individuals
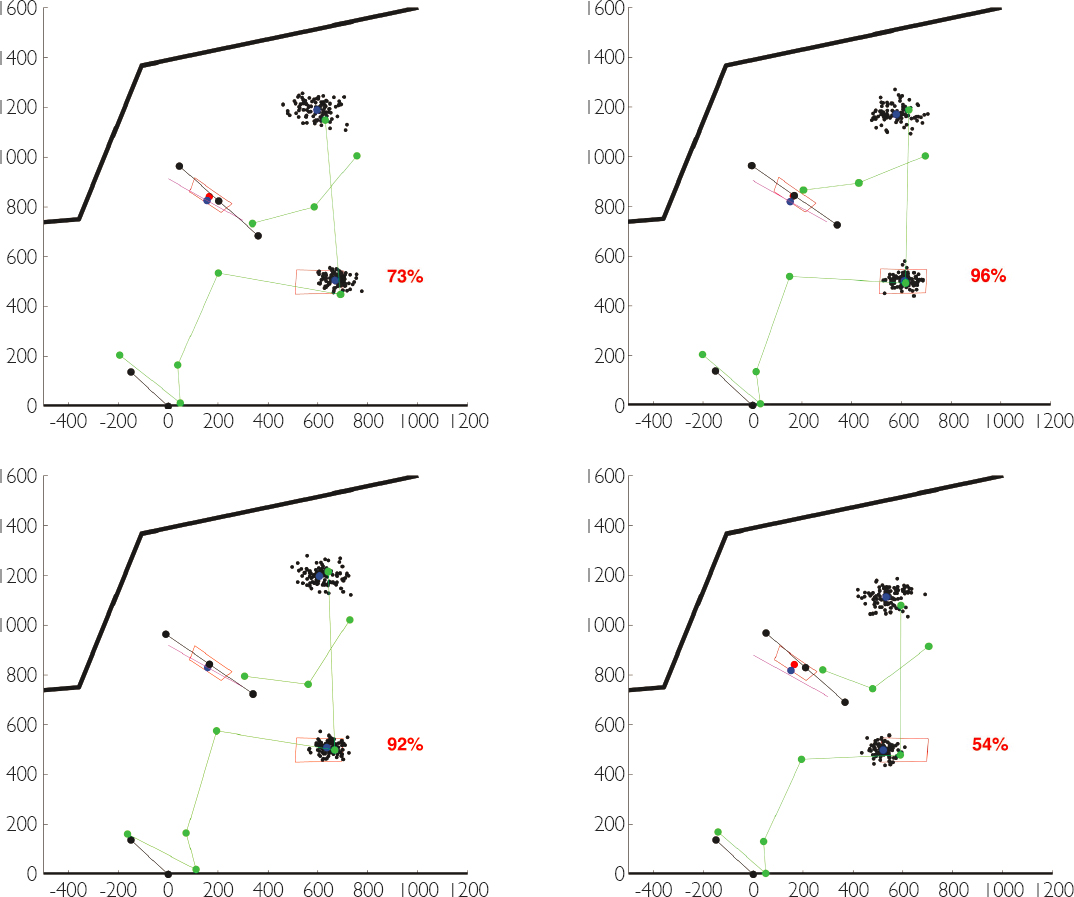
of that same size and shape. The blue dot shows the centroid or average behavior for each location (seat, steering wheel, and eye). Based on those analyses, the likelihood of accommodation for an individual of that size and shape is shown. This ranges from 54% to 97% for the four individuals shown.
When the interaction of large numbers of virtual drivers can be assessed quickly, the virtual fitting method can provide high-resolution estimates of true multivariate accommodation. Models like the cascade prediction model (described in section 2.4.2) allow the manikins to be postured almost instantaneously and the effects of anthropometry, preference related to anthropometry, and preference unrelated to anthropometry to be considered simultaneously. The method is especially useful for Class B vehicles, such as trucks and buses, because they usually involve more design considerations besides spatial fitting due to the driving tasks. For instance, Class B vehicles commonly use height-adjustable seats so drivers can maintain adequate vision of the surroundings (67).
Another significant advantage of applying VFT in vehicle packaging is its seamless adaptability to the hybrid model. As discussed, the manikin approach does not usually have a scientific way
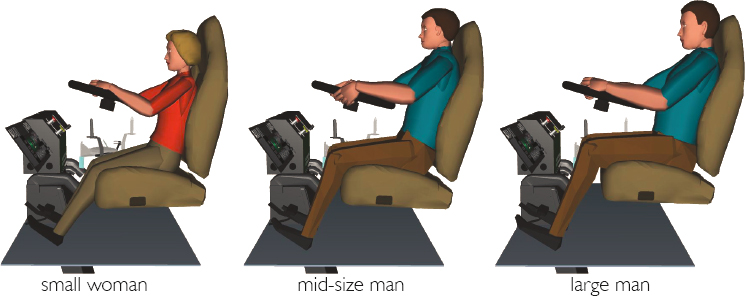
of posturing the manikins. The designers usually posture the manikins manually, which introduces bias. Using a hybrid approach can resolve this issue. The hybrid approach establishes a model relating driver anthropometry to their body landmark locations in space. By creating a large number of virtual driver profiles and feeding their body anthropometric data into the hybrid model, designers can accurately and quantitatively simulate how each driver would posture themselves in a cab. It allows the designers to visually assess the accommodation level of any vehicle layout (Figure 2.11) (3).
2.4.2 Cascade Prediction Model
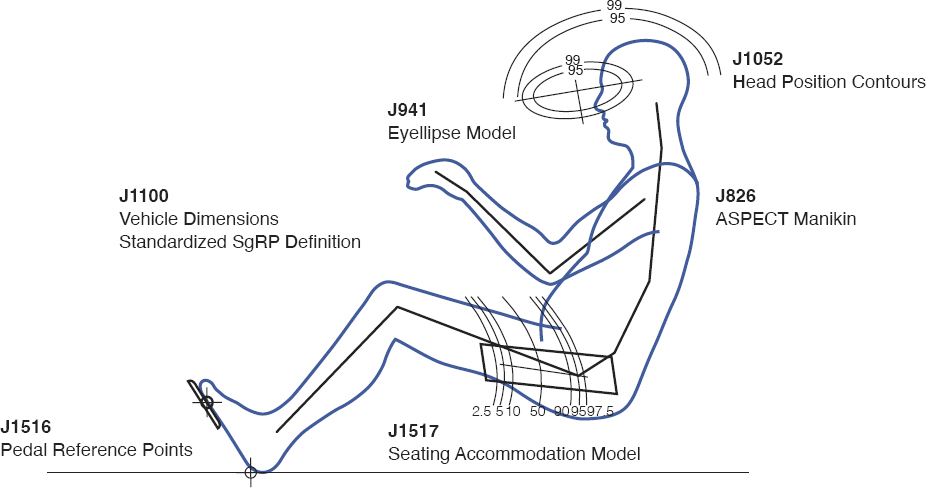
The SAE is an organization of professional engineers that aims to come up with standards and conduct research to bring safe and innovative design to the world. In the past several decades, many SAE J tools have been developed and heavily used for vehicle packaging in the automotive industry. For instance, SAE J1517 examines driver seat position, SAE J941 investigates driver eye position, and SAE J1052 specifically studies driver head location (Figure 2.12). These SAE J tools provide thorough guidelines on each individual component. Since these tools are not reconfigurable and generally consider a single design variable, they can produce vehicle package designs that accommodate a smaller percentage of the driver population than expected.
In the early 2000s, a cascade prediction model (CPM) was developed (68). From analyzing drivers’ postures captured with a sonic digitizer, researchers found that drivers frequently react to their surroundings by moving their limbs while keeping their torso position still. Since locating the torso is a crucial step that lays the foundation for limb posturing, the CPM puts great emphasis on predicting hip and eye locations, which are recognized to be the most important measurements in vehicle packaging. Hip location is critical for seat position design and lower limb posturing, while eye location is a direct assessment of a driver’s field of vision (69). With these two critical body landmarks created from the models of experimental data, researchers can establish submodels and apply inverse kinematics to predict the secondary body landmarks, such as shoulder location, elbow location, and knee location (37).
Even though the CPM is relatively recent compared to other vehicle packaging methods, such as the manikin approach, it is proven to be reliable. In a study conducted by UMTRI, a group
of researchers aimed to estimate driver postures with a CPM and compare them to laboratory observations (60). A total of 63 participants were studied in a laboratory setting to create the CPM while being given 27 vehicle package and seat conditions. The results matched the observed postures of 24 participants from an earlier in-vehicle study. The differences in mean eye and hip locations were within a few millimeters, and the differences in standard deviation were comparable as well. The CPM is used for subsequent analyses in this report.


