Assessing Lifecycle and Human Costs of Bus Operator Workstation Design and Components (2024)
Chapter: 5 Bus Packaging Results
CHAPTER 5
Bus Packaging Results
When packaging a bus, several design parameters need to be considered. This work exclusively discusses drivers’ accommodation in the X-Z plane and addresses concerns regarding spatial fitting of components, driver safety, and a driver’s ability to see objects around the cab. To provide meaningful feedback to the industry users, the following design parameters are used:
- Steering wheel pivot location
- Steering wheel tilt angle adjustment
- Steering wheel telescope distance adjustment
- Steering wheel diameter
- Seat fore-aft adjustment
- Seat vertical adjustment
- UDLO location
- Cowl point location
- Tip of dashboard location
- Tip of front bumper location
- AHP location
When packaging a bus, industry users must carefully select these parameters to ensure the majority of the driver population are accommodated on all four design objectives, as discussed in Chapter 3.
Apart from bus geometry, driver population profile is also a critical contributor to the success of a design because a bus package made for one population may not be suitable for another. In fact, the wrong match could cause driver fatigue and other safety hazards (110). The United States is known for its diverse population, and this diversity is reflected in the bus driver workforce. To reflect U.S. bus drivers, this chapter uses a 55:45 men-to-women ratio.
This chapter presents the outcomes of the cascade model by showing the predicted reference points and body landmarks in a virtual bus cab. It is important to be aware that the location of these points depends on bus cab geometry. The virtual bus cab shown in this chapter only serves as visual representation and can be altered to meet the specific needs of the industry user. Similarly, the population is reduced to 1,000 individuals (550 men and 450 women) to make the accommodation rate math easier to follow in the example.
5.1 Steering Wheel
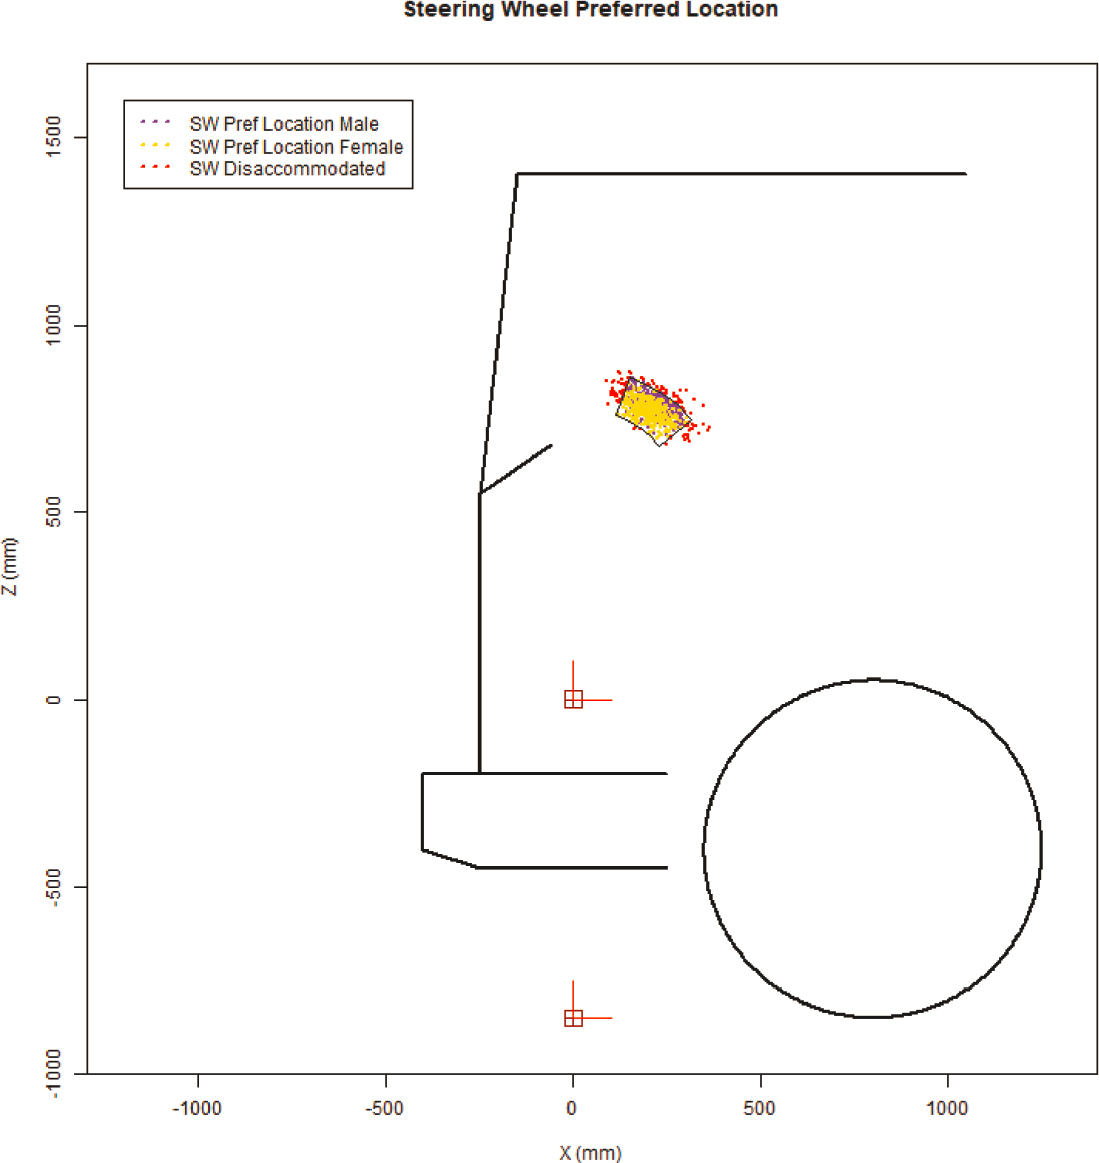
Steering wheel location prediction is the first step of cascade modeling and becomes the input for the following steps. Each preferred location is described with an angle and a distance from the pivot. With a total of 1,000 virtual drivers, 1,000 steering wheel locations are generated, and they
form a fan-shaped cluster of points where purple represents men and yellow represents women (Figure 5.1).
Through calculation, men’s preferred steering wheel locations were found to be farther away from the pivot than women’s by 20 mm on average, which is expected given that stature is an input to the model and, as a population, men are generally taller than women. The steering wheel tilt angles are almost identical across the two genders. This outcome indicates that driver’s postural preference is independent of gender when controlled for stature.

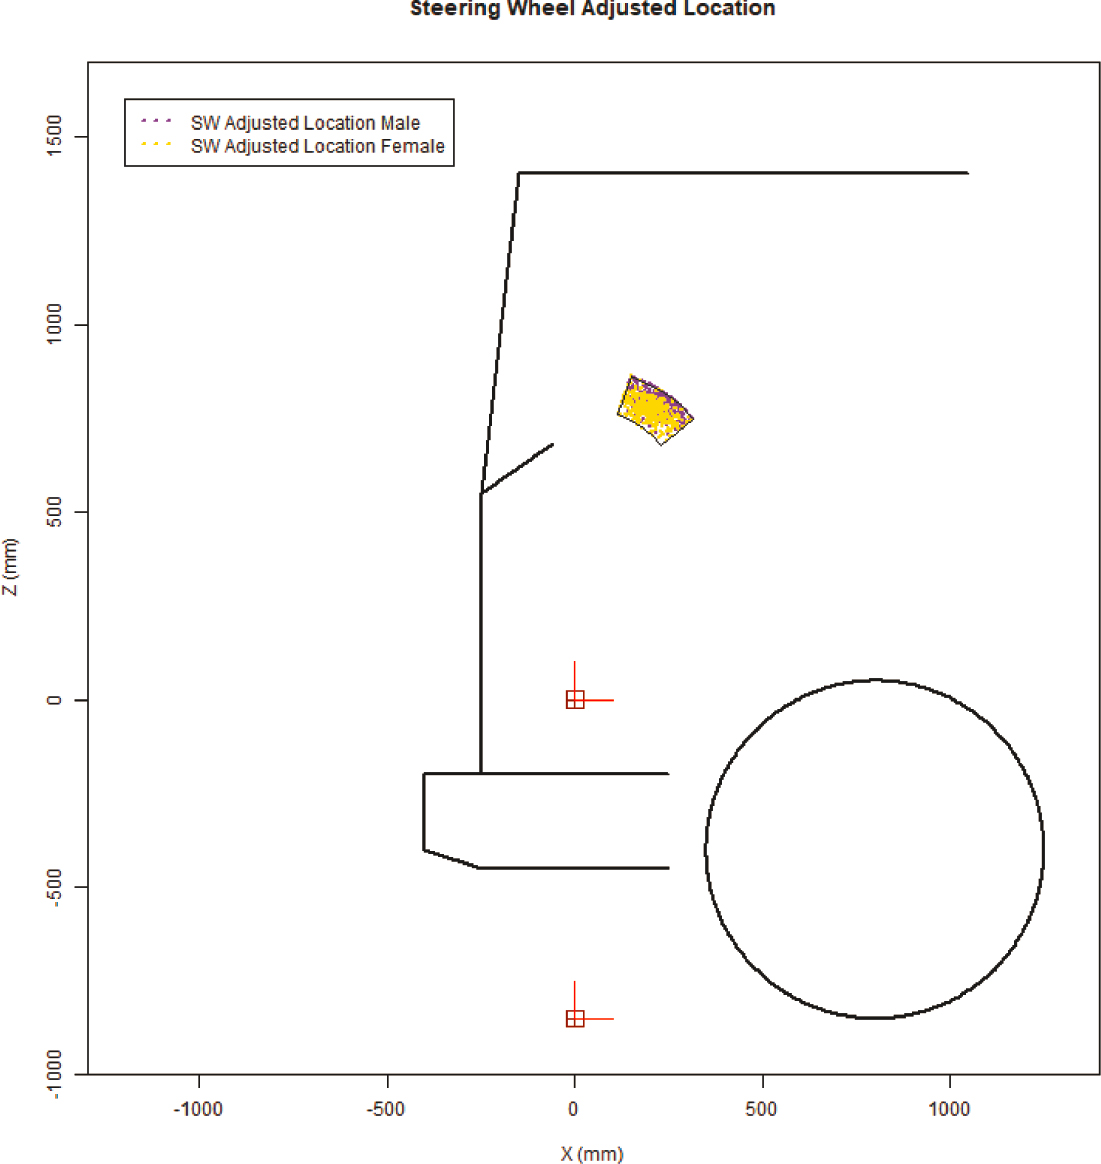
In some cases, a large enough adjustment envelope may be constructed to accommodate all the virtual drivers, but for the purpose of demonstration, a smaller adjustment envelope is chosen, and the disaccommodated drivers are marked in red (Figure 5.2). The adjustment is provided through a combination of telescoping and tilting about the pivot point.
For this specific bus layout, the pivot of the steering wheel is at (20 mm, 500 mm) with respect to the AHP. The steering wheel has a telescoping range of 275 mm to 385 mm and a tilt angle
of 20° to 50° from the vertical direction. Among the 1,000 virtual drivers, a total of 100 were disaccommodated (52 men and 48 women), which means an 89.6% and 90.4% accommodation rate for men and women, respectively. Considering gender ratio, the total accommodation is 90.0%. When a driver is disaccommodated, they would adjust the steering wheel to the nearest point on the envelope and adjust the rest of their body to adapt to the change. After applying such adjustment to all 100 disaccommodated drivers, the steering wheel locations shown in Figure 5.3 are achieved.
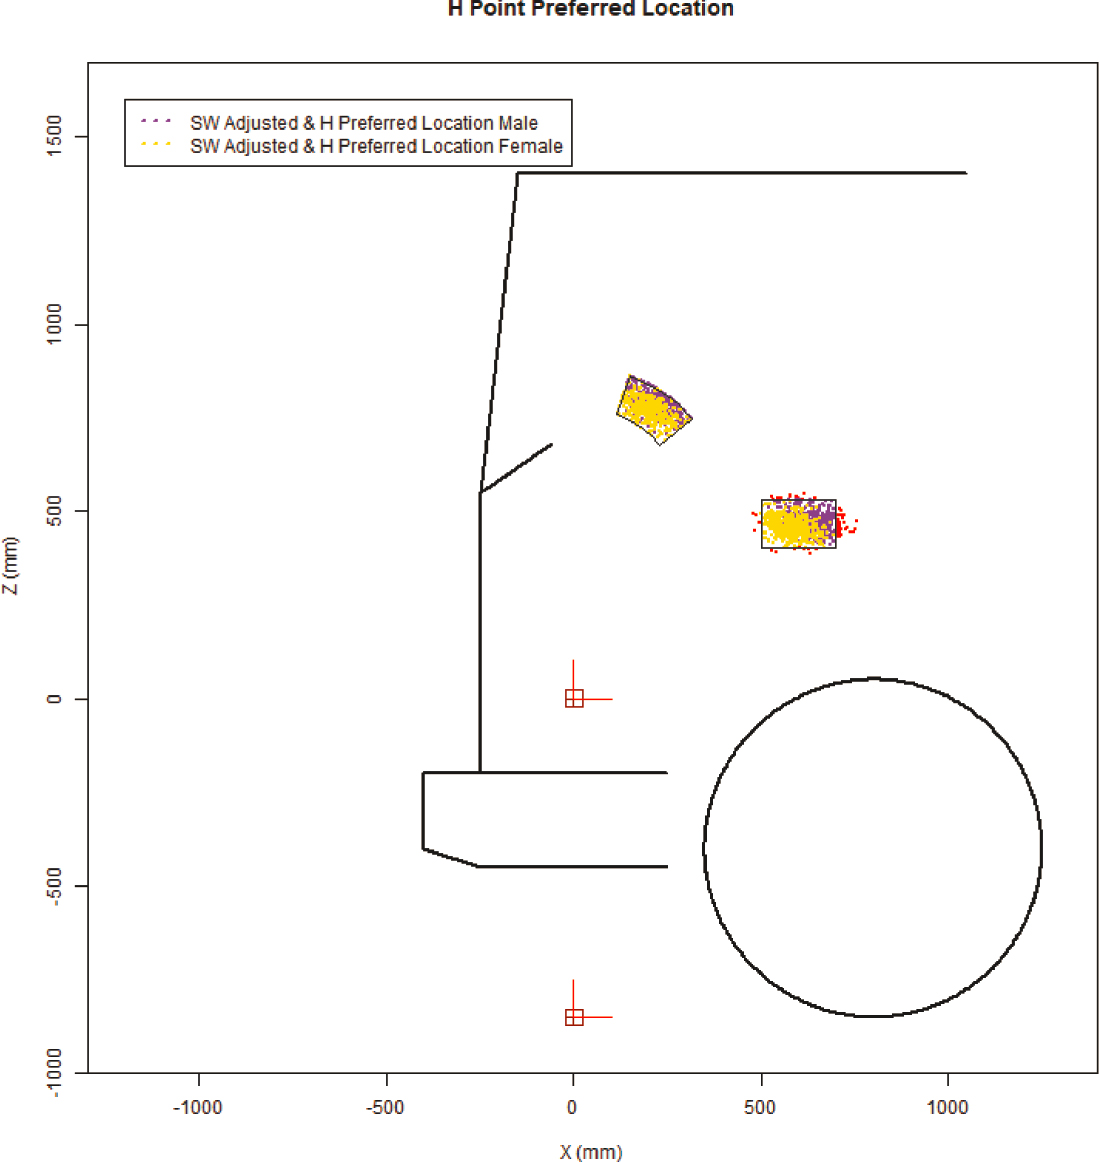
5.2 H-Point
Once the steering wheel locations are predicted and adjusted, the cascade model can proceed to seat position. Again, 1,000 preferred seat locations were generated. Due to the variation in average size across gender, the preferred seat locations of male drivers are expected to be farther away from the AHP, and this expectation is supported by data. On average, they move the seat 54 mm more in the X direction and 15 mm more in the Z direction than female drivers (Figure 5.4).
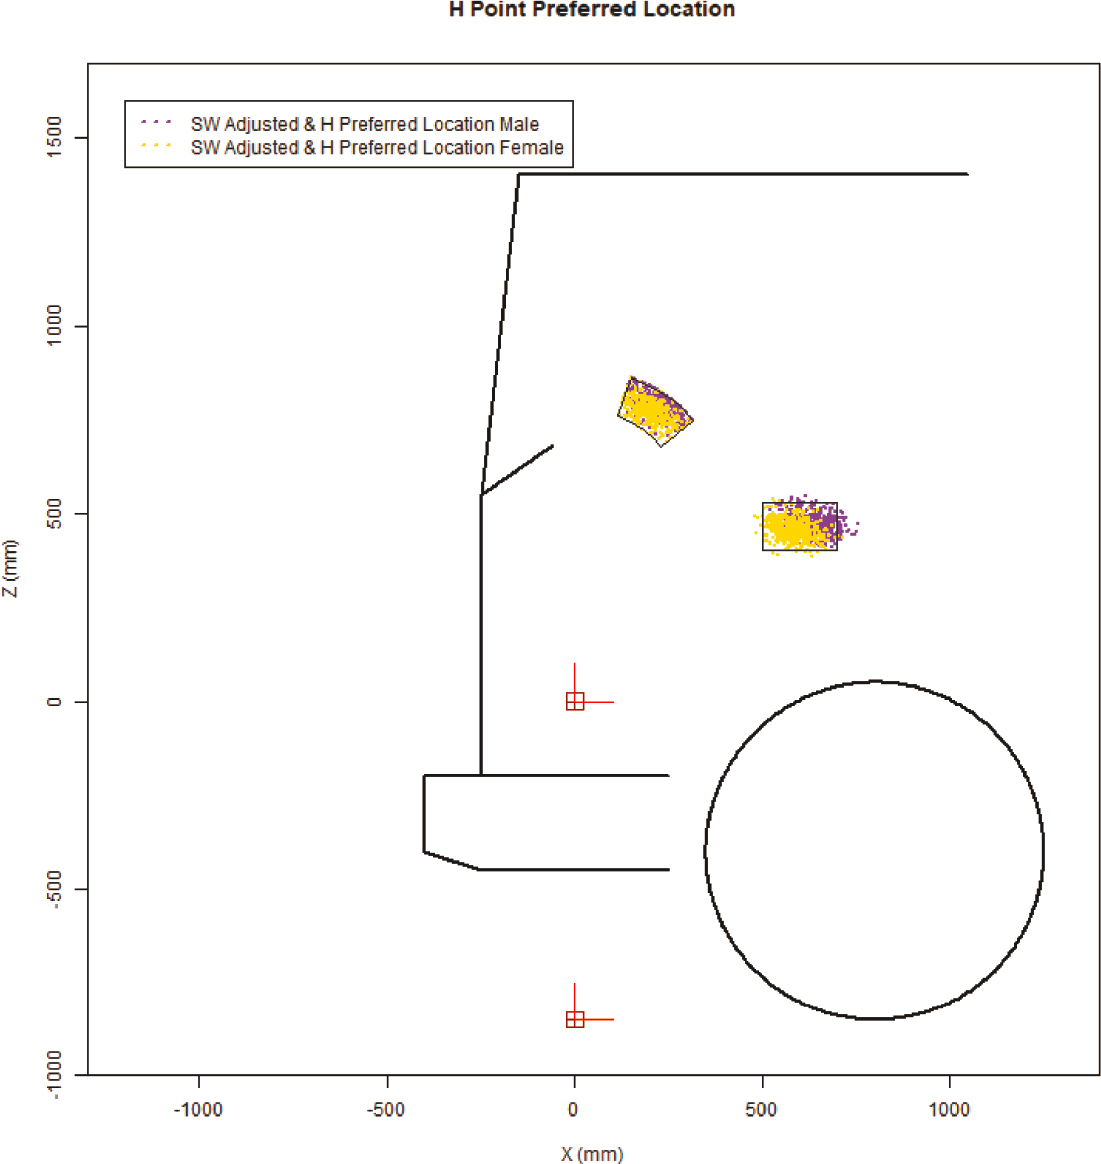
In this work, a limited adjustment range of the seat, 500 mm to 700 mm in the X direction and 400 mm to 530 mm in the Z direction, is used to demonstrate disaccommodation. This adjustment envelope leads to a 90.6% accommodation rate for men and a 96.6% for women, with a combined rate of 93.6%. Among all the disaccommodated drivers, 47 are men and 17 are women. Disaccommodated drivers are shown in red (Figure 5.5).
Similar to disaccommodated steering wheel locations, disaccommodated seat locations are moved to the nearest point on the envelope, and the drivers are expected to adjust their posture
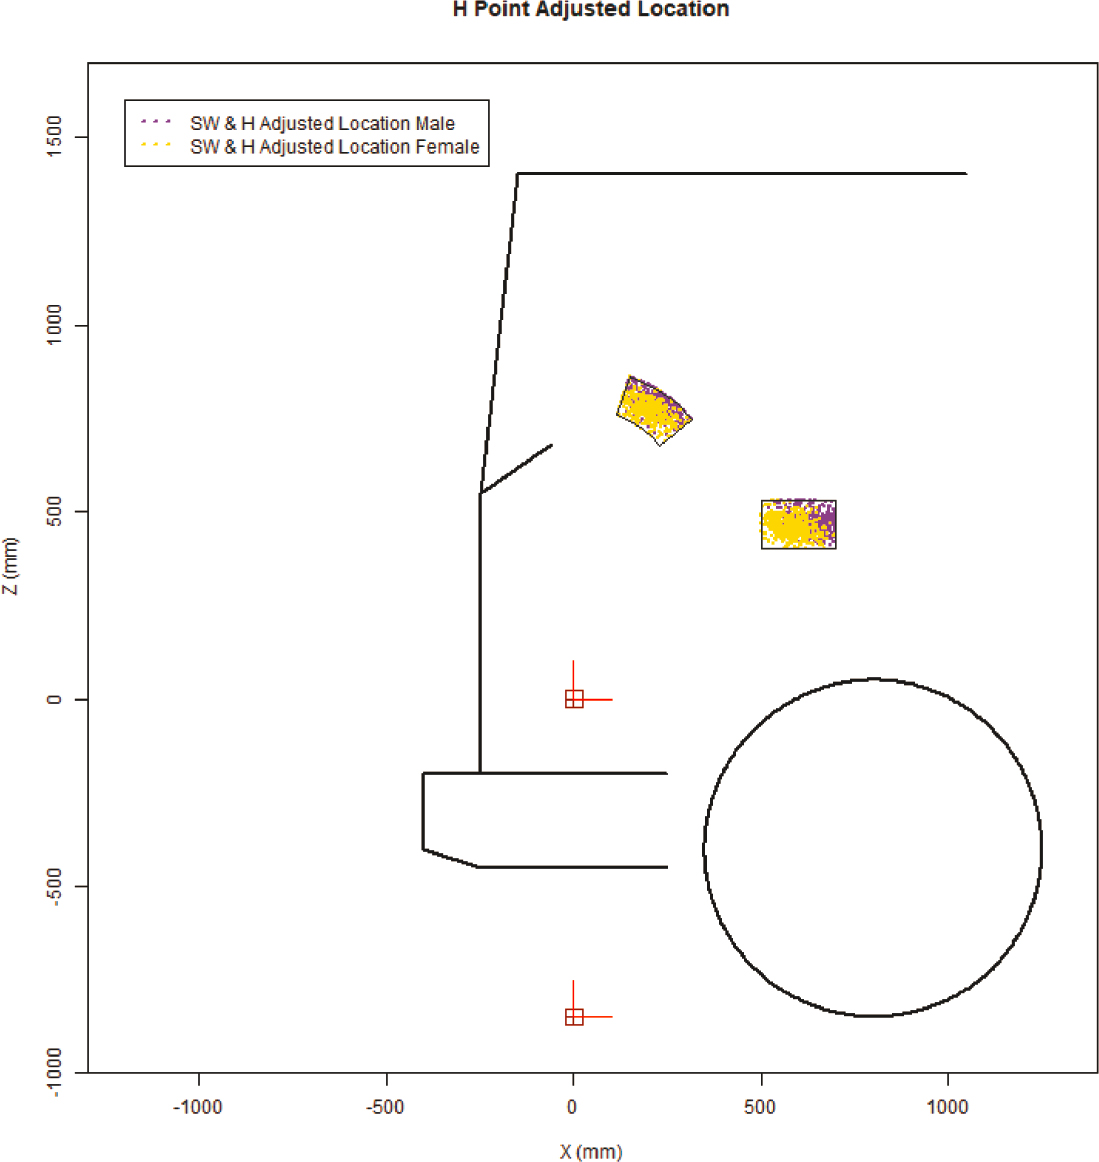
to adapt to this change. Although such adjustment is not ideal, it happens frequently. In some cases these changes are subtle and not noticed; in others they can lead to injury or reduced performance. The effect of driver self-adjustment is shown in Figure 5.6.
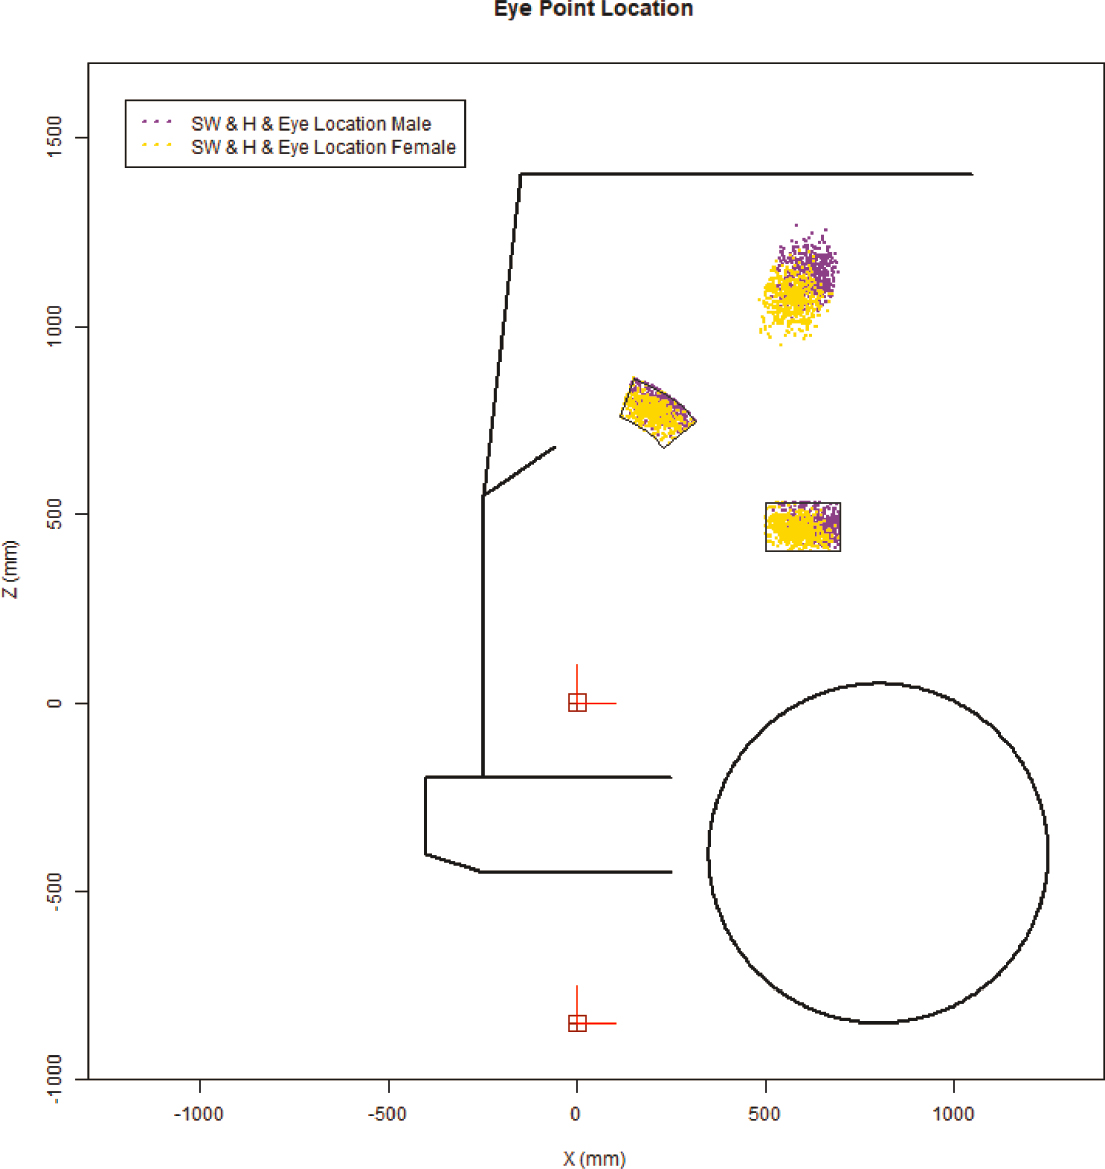
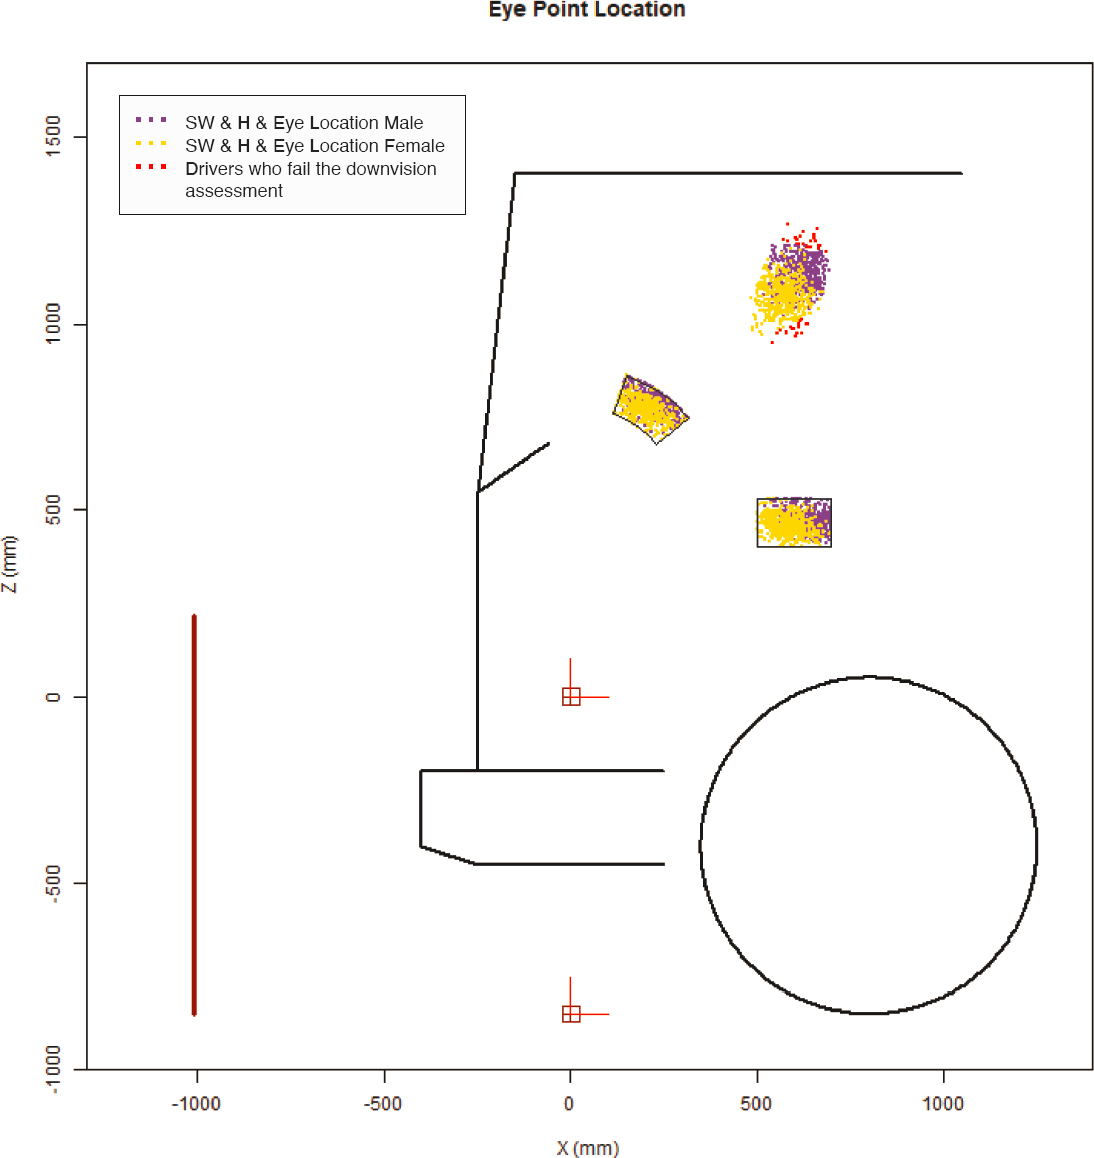
5.3 Eye Point
After having both steering wheel locations and seat locations successfully predicted, eye locations can be found using steering wheel and seat locations as inputs. For both men and women, the clusters of points are elliptical. Similar to seat position, the eye locations of men are farther
away from the AHP than the eye locations of women by an average of 49 mm and 66 mm in the X and Z directions, respectively (Figure 5.7).
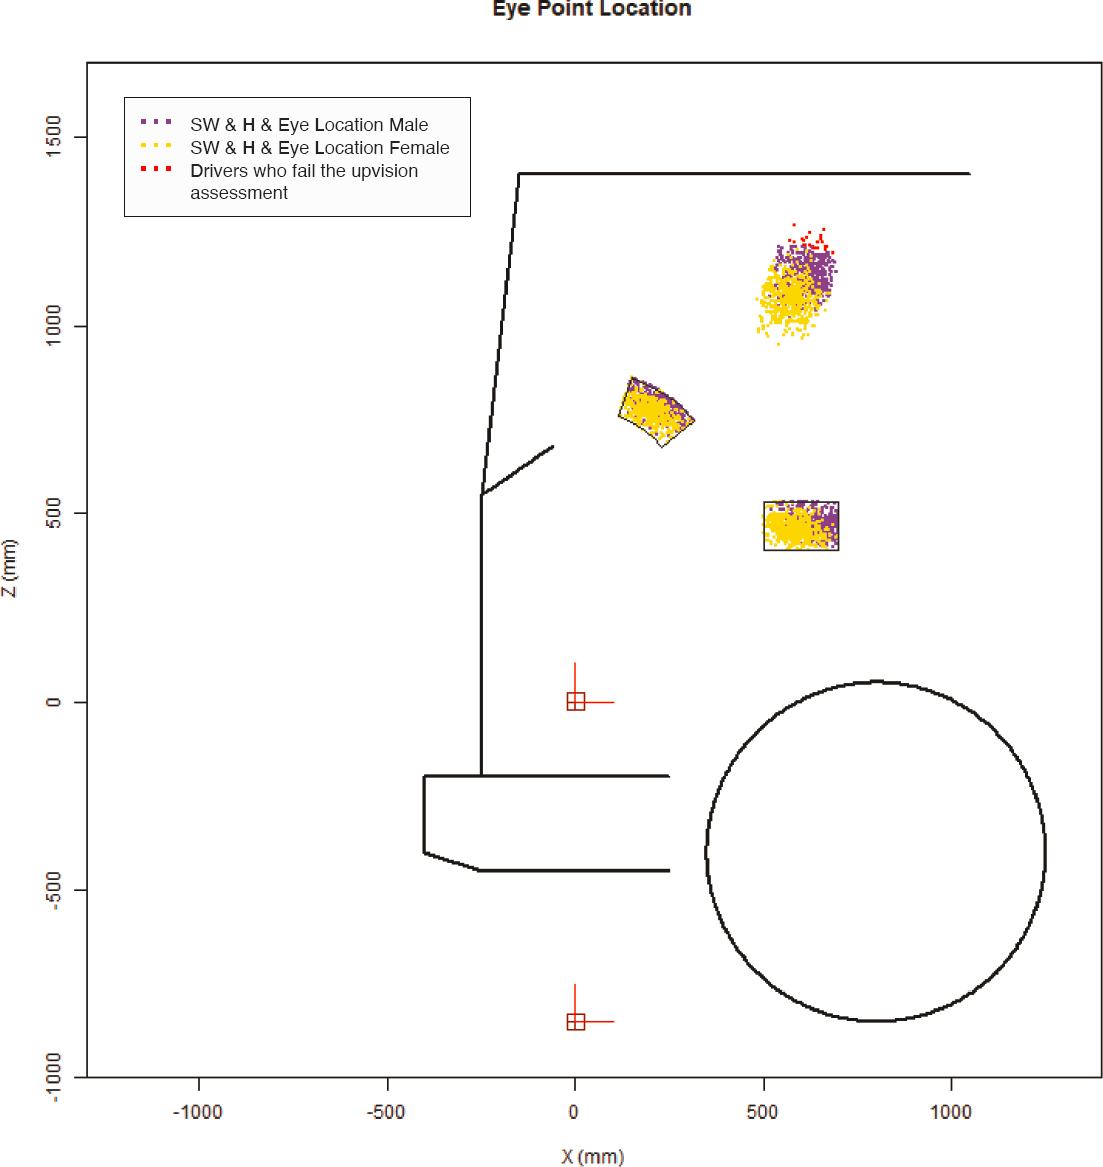
As mentioned in Chapter 4, a main safety requirement is that drivers must be able to see 14° above the horizontal plane, and the UDLO is usually the limiting factor. Due to the large size of most buses, the UDLO is usually very high, and the upward vision requirement is rarely a concern. In this work, the UDLO is positioned significantly lower compared to other transit buses in order to demonstrate disaccommodation on this measure. For this specific bus layout, 95.4% of the male drivers and 100% of female drivers, 97.7% combined, meet the upward vision requirement. Disaccommodated drivers are shown in red in Figure 5.8.
In addition to a 14° upvision angle, the APTA requires all bus drivers to be able to see a 42″-tall object 24″ in front of the bus. In Figure 5.9 the vertical line represents the object. When a driver looks downward, two components could block their vision: the cowl point and the tip of the dashboard. Depending on driver eye location, either one could be the limiting factor. Only when neither of them blocks driver vision is the requirement met. Given the locations of these components (Figure 5.9), 100% of the male drivers and 96.4% of the female drivers are accommodated on this requirement, which makes a 98.2% combined accommodation.
5.4 Overall Accommodation
Steering wheel location, seat location, and eye location are the three primary considerations in vehicle packaging, and these locations are used to assess all four requirements regarding spatial fit and vision safety (steering wheel, seat, upvision, and downvision). Through previous efforts, the accommodation rate of each requirement can be calculated, but it is of interest to study the overall accommodation. As discussed in Chapter 4, this work applies indicator functions to each virtual driver to gain a thorough understanding of what
Table 5.1. The univariate and multivariate accommodation rates of 1,000 virtual bus drivers.
| Gender | Steering Wheel | Seat (H-point) | Upvision | Downvision | Overall |
|---|---|---|---|---|---|
| Men | 89.6% | 90.6% | 95.4% | 100.0% | 80.6% |
| Women | 90.4% | 96.6% | 100.0% | 96.4% | 97.0% |
| Combined | 90.0% | 93.6% | 97.7% | 98.2% | 83.8% |
limitations they are encountering; from there, the overall accommodation rate can be calculated for the 1,000 drivers (Table 5.1).
As shown in Table 5.1, the difference between men and women is noticeable. In general, male drivers tend to sit farther back and higher up with respect to the AHP. This observation is expected because of the variation in body size across genders. In this work, a small bus with limited adjustment ranges was used to effectively illustrate disaccommodation. With this specific layout, a combined population of 83.8% is accommodated; however, the accommodation rate can be improved dramatically by (1) raising the UDLO, (2) lowering the cowl point (where the lower edge of the window meets the vehicle; see Figure 2.3) and the dashboard, and (3) increasing the adjustment ranges of the steering wheel and the seat.
5.5 Other Body Landmarks
The results produced from the cascade model demonstrate its usefulness in packaging a bus as the model delivers instantaneous and quantitative feedback for a design. This work aims to establish a bridge between bus layout and accommodation so designers can effectively make proper changes to their current bus designs, which will ultimately improve drivers’ overall well-being.
Besides an accurate and reliable model to predict drivers’ interaction with the vehicle, another goal of this work is to provide visualization to industry users to make vehicle packaging a more intuitive process. Specifically, a full body kinematics diagram that represents a human figure would be beneficial. To do this, more body landmarks need to be predicted to indicate the locations of body joints. The first step is to locate shoulder joints using linear regressions so the driver’s torso can be oriented (Figure 5.10).
A normal driving posture is when a driver is operating a vehicle without taking additional actions, such as spinning the steering wheel or braking. While drivers are maintaining a normal driving posture, their hands are expected to be placed on the lower quarter of the steering wheel. With hand location, shoulder location, and body dimensions being known, drivers’ upper limbs can be configured using inverse kinematics. Similarly, a driver’s foot tends to gently tap on the accelerator pedal while driving, so their ankle joint is relatively static to the AHP. With information on their leg lengths, drivers’ lower limbs can also be configured (Figure 5.11).
5.6 “Average” Driver
Chapter 2 discussed the percentile model and demonstrated that the percentile approach is incapable of consistently producing accurate posture prediction. One of the arguments is that an nth-percentile person does not exist due to human variability. In spite of that weakness, the model can be used as a visualization tool to show driving postures because an nth-percentile person can certainly exist in a virtual world. In Figure 5.12, the green lines represent an “average” man with average body dimensions throughout, and the orange lines represent an “average” woman.
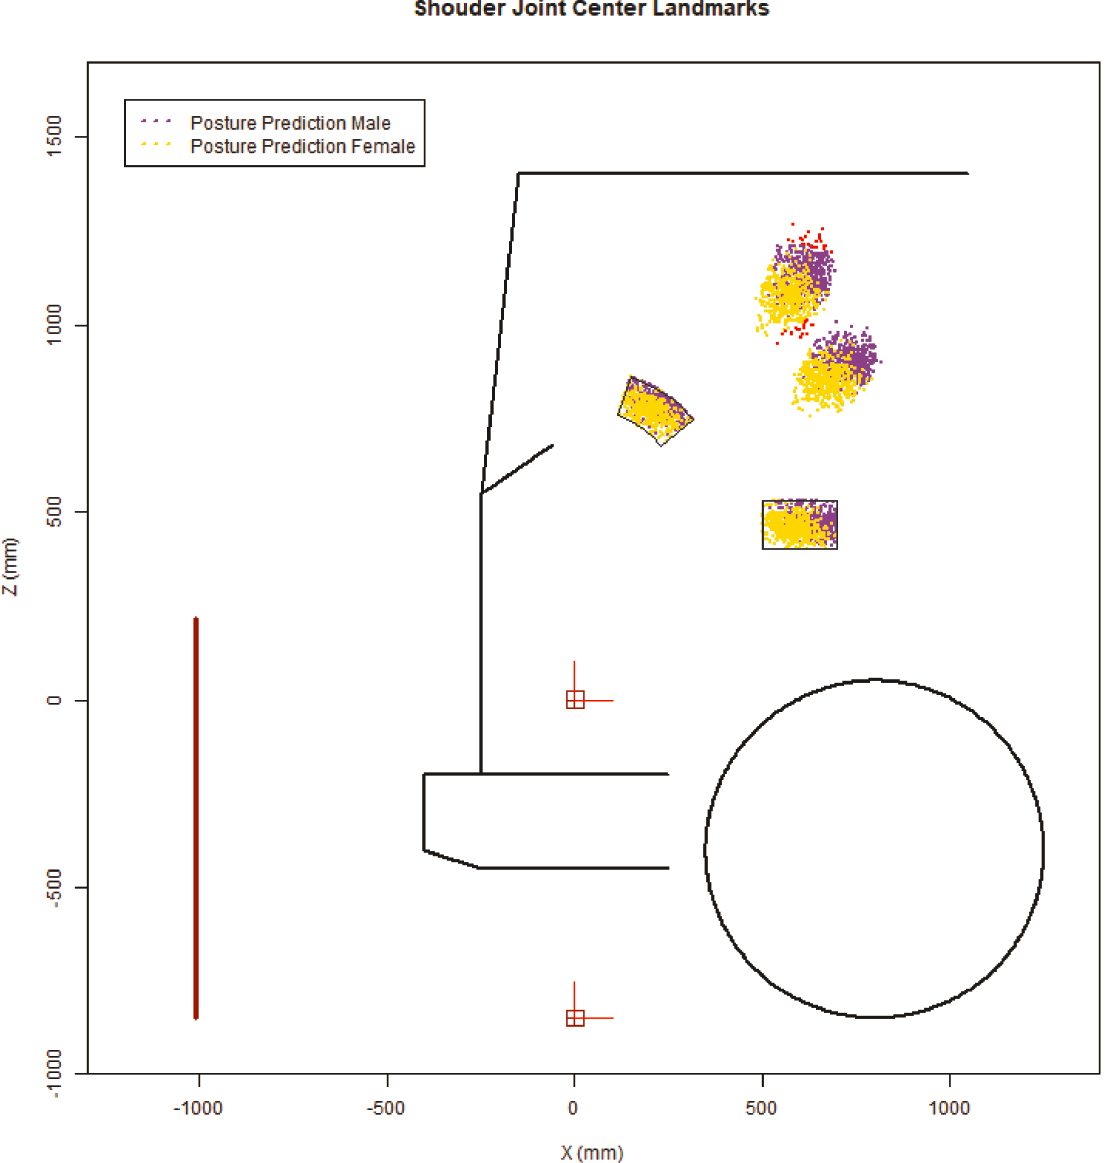
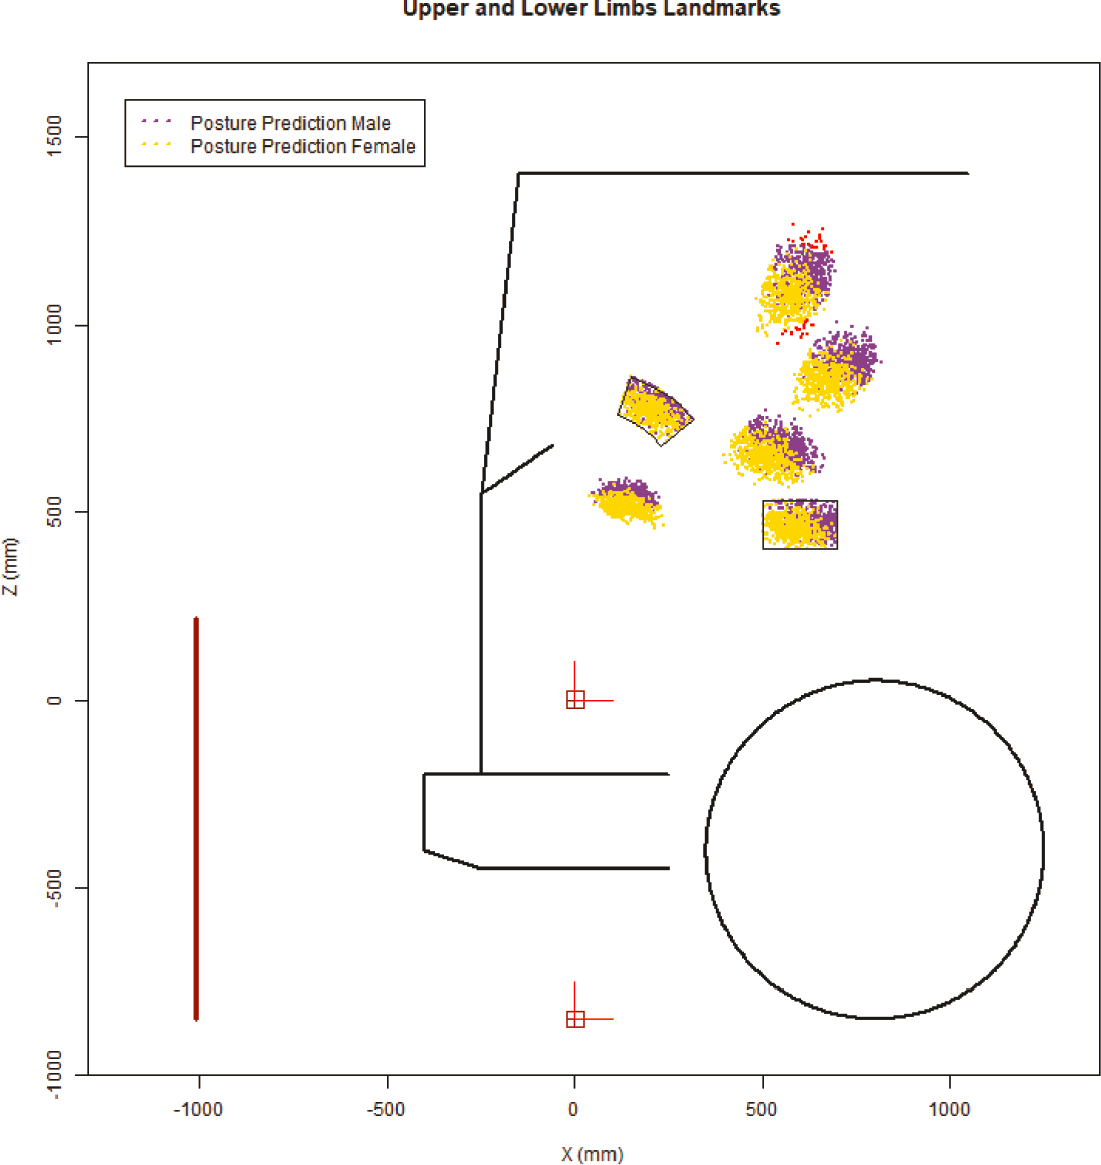
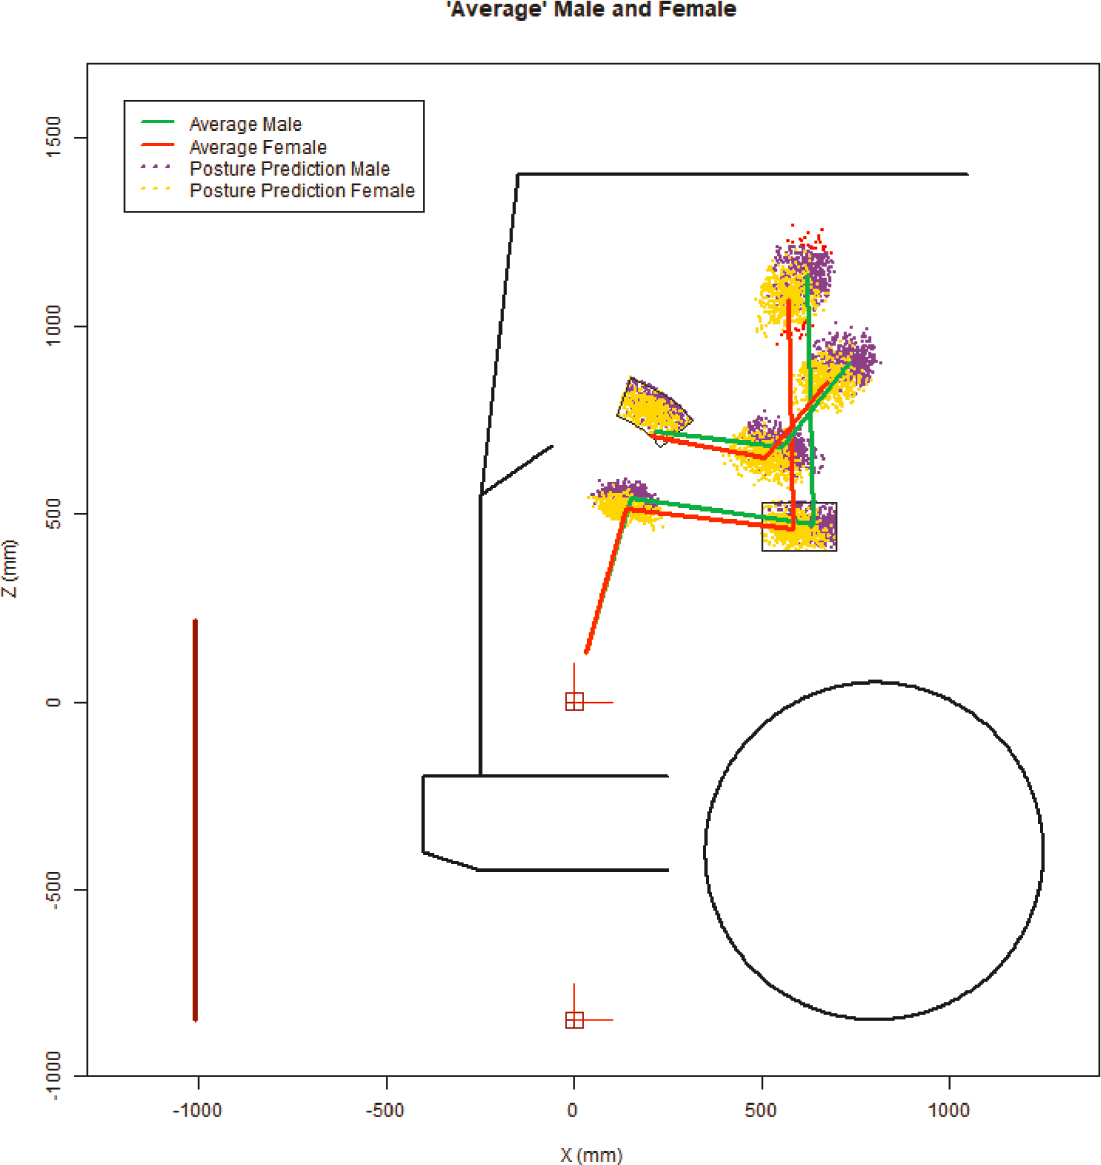
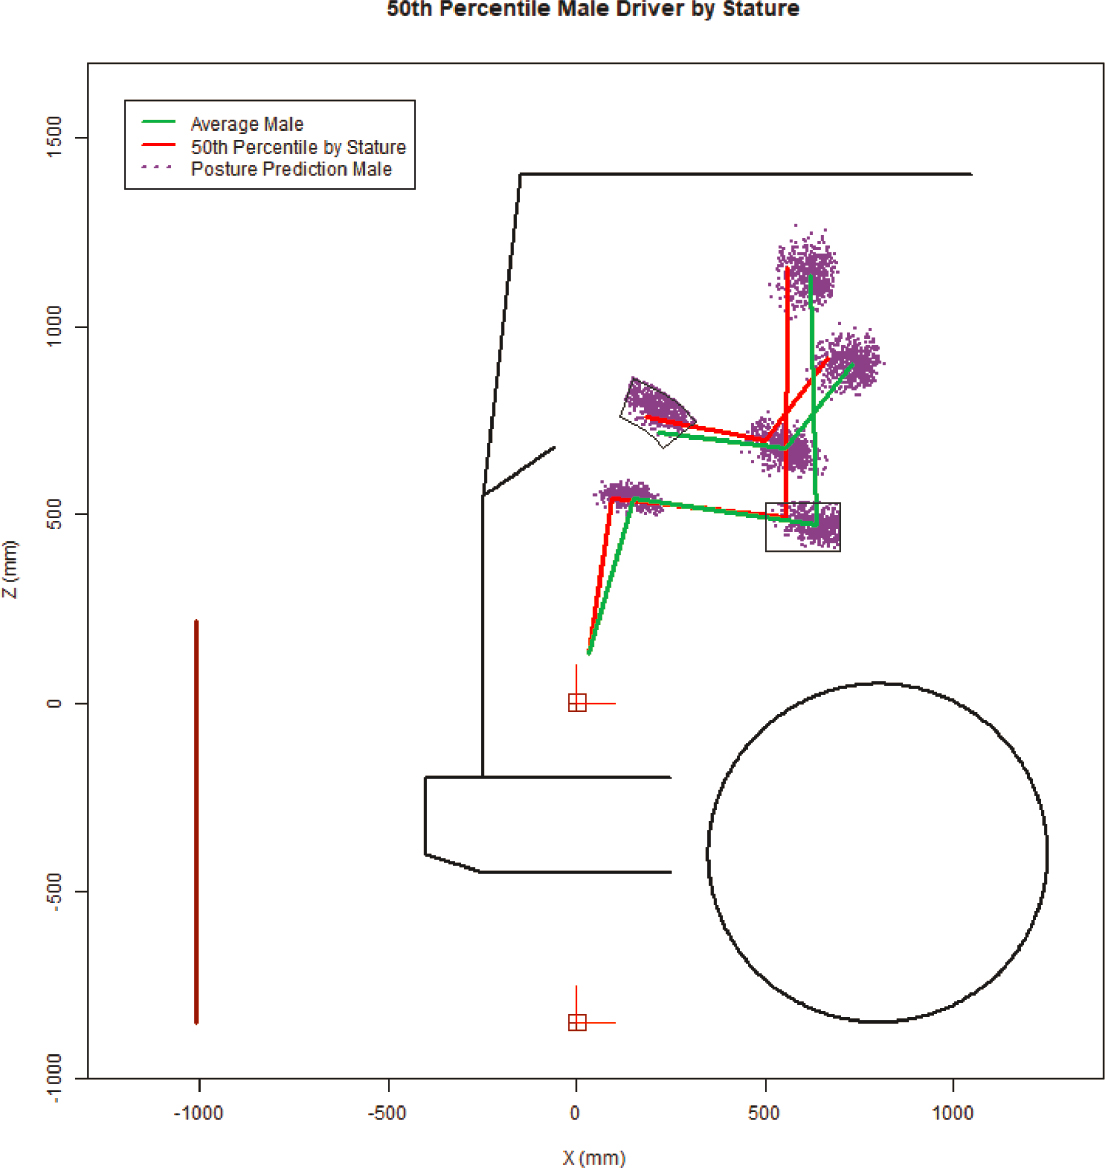
Figure 5.13 shows how the average locations for an entire population can vary from the preferred location for a single “average” driver. The plot shows the average joint center and component locations for 500 virtual men that have been postured using the model. Plotted against this is the representation of a man who is 50th-percentile by stature. The two drivers have significantly different postures, and it would be inaccurate to assume a driver with 50th-percentile stature would be 50th-percentile on other body dimensions. This limitation was identified more than 60 years ago (46).
5.7 RULA
This work dedicates a large amount of effort to driver posture prediction and configuration of each driver’s posture as joints and links. It is of interest to use this information to investigate musculoskeletal health, because bus drivers are known for their critical work environment. As discussed in Chapter 3, they operate the vehicle in a spatially limited workstation and are expected to maintain the same posture for hours. Under such circumstances, they are likely to develop fatigue and musculoskeletal symptoms, which not only deteriorate health but also increase the likelihood of an accident. In fact, this is one of the reasons bus drivers leave the bus transportation industry (111).
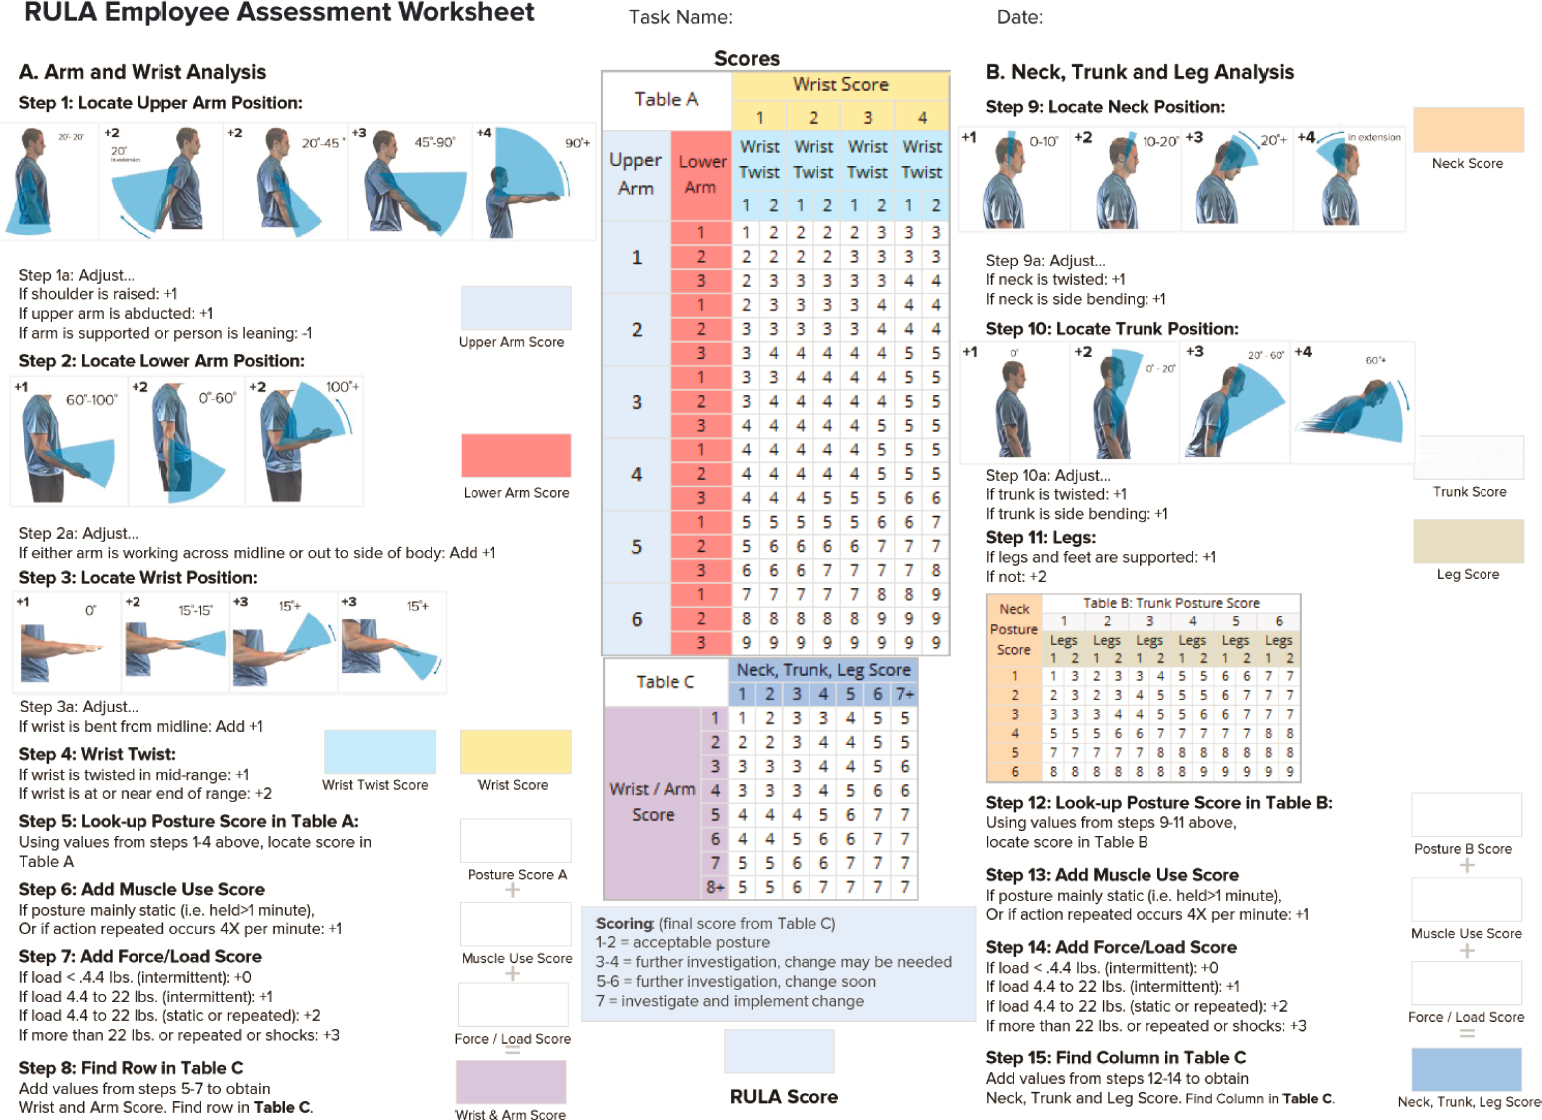
Aiming to quantitatively study drivers’ posture-related fatigue, a rapid upper limb assessment (RULA) is used. RULA is a method of estimating the risks of upper limb fatigue and disorders through work-related postures. It receives inputs such as body angles and force requirements to predict individual workers’ ergonomic risk factor (5). In recent years, RULA has been widely used for assembly workers who repetitively perform certain tasks and has proved a valuable tool to evaluate workers’ risk factors (112). Although RULA puts a great emphasis on the upper limbs, factors such as leg support and torso angle are also considered, which makes it a suitable method to assess bus drivers’ work conditions. The RULA worksheet is shown in Figure 5.14.
After carefully estimating the force loads in the upper and lower body while driving with a normal posture, a RULA is carried out for each driver. The final RULA score, indicating the ergonomic risk factor, is the outcome of the assessment. On a scale of 1 to 7, the associated actions to be taken are:
- 1–2: acceptable posture
- 3–4: further investigation, change may be needed
- 5–6: further investigation, change soon
- 7: investigate and implement change
The results show that all 1,000 virtual drivers scored 3, which indicates their driving postures put them at low ergonomic risk, and the need for a posture change is minimal. Although drivers may experience discomfort at times, especially when driving for too long, ergonomic risk is not likely to become a major concern. In addition, drivers’ postures vary, but the variation is not large enough to dramatically impact ergonomic risk factors. Therefore, it is unnecessary to repetitively conduct RULAs for each virtual driver after conducting it once.