Assessing Lifecycle and Human Costs of Bus Operator Workstation Design and Components (2024)
Chapter: 3 Bus Operator Posture and Associated Risk of CTDs
CHAPTER 3
Bus Operator Posture and Associated Risk of CTDs
Professional drivers are a high-risk group for work-related musculoskeletal disorders (WRMSDs). There are a number of different kinds of WRMSDs; this project examined the risk associated with one specific class: cumulative trauma disorders (CTDs). Analysis using three different assessment tools found that in typical situations the majority of bus drivers are not at particular risk for CTDs.
3.1 Background
Any repetitive job having potentially excessive frequencies, high forces, and extreme limb postures can result in WRMSDs of the upper extremities. Six major surveys (70) have estimated the prevalence of these to be on the order of 15% for the U.S. population. Professional drivers are a high-risk group for WRMSDs involving the spine (71) and the shoulder and knee joints (72); in particular, there is a high incidence of early degenerative spine changes among truck drivers (73). Also, Tse et al. reported the negative impact of bus operators’ stress on physical (cardiovascular diseases, gastrointestinal disorders, musculoskeletal problems, fatigue, etc.), psychological (depression, anxiety, post-traumatic stress disorder), and behavioral outcomes, with a very detailed review of 50 years of research on their injuries (74). Thus, the workplace of the driver, which includes the cabin climate, exposure to vibration and noise, and changing climatic conditions and driving postures, must be considered in relation to WRMSDs. These disorders contribute to low retirement age and high morbidity in drivers (75). Drivers are often exposed to repetitive and awkward postural stress in their working environment, contributing to back, neck, and upper extremity discomfort (76). Activities that include vibration and driving 30 km or more in a single trip increase the risk of back pain, disc rupture, tension, and fatigue. Although that research reported a limited examination of musculoskeletal disorders, later research focused specifically on the upper extremities with considerable detail from Washington State (77), Hong Kong (78), and Israel (79).
3.2 Research Activities
An experiment was designed to determine if bus drivers were at specific risk for CTDs. Video was captured for a number of professional bus drivers at the beginning and end of their shifts. This video was analyzed using three different assessment tools: the CTD risk index, rapid upper limb assessment (RULA), and the strain index.
3.2.1 Participants
Motion analysis was performed on existing videos of 14 bus operators. Participants were professional drivers who worked testing buses at the Larson Transportation Institute test track. All
bus operators were male and were included in the study’s analysis. The oldest study participants were over 40 years of age and drove 50–60 hours each week. The majority of drivers were driving more than 250 km per day. Anthropometric data such as stature, mass, sitting height, seated hip breadth, and seated bideltoid breadth were measured (Table 3.1). All study procedures were approved by the Pennsylvania State University’s Office for Research Protections.
3.2.2 Observation
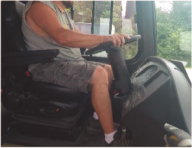
Each bus operator was required to drive an electric transit bus for two rounds (long and short tracks) at the Larson Transportation Institute test track facility. Participants drove three loops on each track at the beginning and three loops on each track at the end of their 1-hour driving shift, so the research team recorded six loops on the long track and six loops on the short track for each driver. The total recorded time per bus driver across the four conditions was approximately 20 minutes. Interior cameras recorded their posture. They were positioned to record the right and front profiles of the drivers. The cameras were placed to ensure they were not in the driver’s usual field of view. Specific tasks such as turning, lane changes, and avoidance of road hazards were incorporated into the driving schedule and were signaled in the video. This allowed decomposition of the video by task.
3.2.3 Assessment Tools
Three different risk analyses were performed on these motion data to ascertain potential risk for WRMSDs. A quantitative CTD risk index was developed by Weston and Freivalds (4) that evaluates all three major risk factors: force, frequency, and joint posture (Figure 3.1). This has been used quite successfully by Freivalds in his research at the Center for Cumulative Trauma Disorders in approximately 89 different industries over the last 30 years. That risk index was somewhat based on the second assessment tool used in this project: the more basic posture analysis index, the RULA developed by McAtamney and Corlett (5). A RULA worksheet is shown in Figure 3.2; this tool has been used to evaluate bus drivers (80) but was focused on trunk and neck regions rather than the upper extremities. A third assessment tool, the strain index, was developed by Moore and Garg to predict the risk of injury due to task attributes like intensity, duration, frequency, speed, and posture (6).
Due to the differing natures of the analyses, the data were processed slightly differently. For the CTD risk index and the strain index, a 2-minute segment of data was analyzed. For the RULA analysis, images were extracted at 1-second intervals from the videos. Among them, 10% were randomly selected for analysis. Thus, the total was 1,666 driving postures (20 min p 60 s p 14 drivers p 0.1 sampling) evaluated.
Table 3.1. Summary of the anthropometric data of study participants.
| Measure | Mean | SD |
|---|---|---|
| Stature | 1,788 mm | 59.1 mm |
| Mass | 104.6 kg | 19.5 kg |
| Hip breadth, seated | 427 mm | 35.0 mm |
| Bideltoid breadth, seated | 519 mm | 102 mm |
| Sitting height | 903 mm | 38.3 mm |


3.3 Results
3.3.1 CTD Risk Index
The results of the CTD risk index assessment for the participants are summarized in Table 3.2. The force factor and miscellaneous factor parameters were assumed to be 1.0 and 0.66, respectively. There is no CTD risk score greater than 1.0 across all the conditions. The highest score, which occurred at the beginning of the short durability track, was 0.56. There was no significant difference between tracks (p-value = 0.909) under the conditions examined here (Figure 3.3). Also, there was no significant difference in results from the beginning of the shift vs. the end of the shift (p-value = 0.308), an indication of fatigue.
Table 3.2. Results of the CTD risk index assessment.
| Track | Timing | Frequency Factors | Posture Factors | Force Factors | Misc Factors | CTD Risk Score |
|---|---|---|---|---|---|---|
| S | B | 0.392 | 0.907 | 1.00 | 0.660 | 0.756 |
| S | E | 0.389 | 0.886 | 1.00 | 0.660 | 0.748 |
| L | B | 0.376 | 0.893 | 1.00 | 0.660 | 0.724 |
| L | E | 0.363 | 0.864 | 1.00 | 0.660 | 0.736 |
3.3.2 RULA
Table 3.3 reports the results of the RULA. The driving postures are categorized into groups of low, average, and high posture and the corresponding component ratio of each posture group is reported. Score A represents wrist and arm scores and Score B refers to neck, trunk, and leg scores.
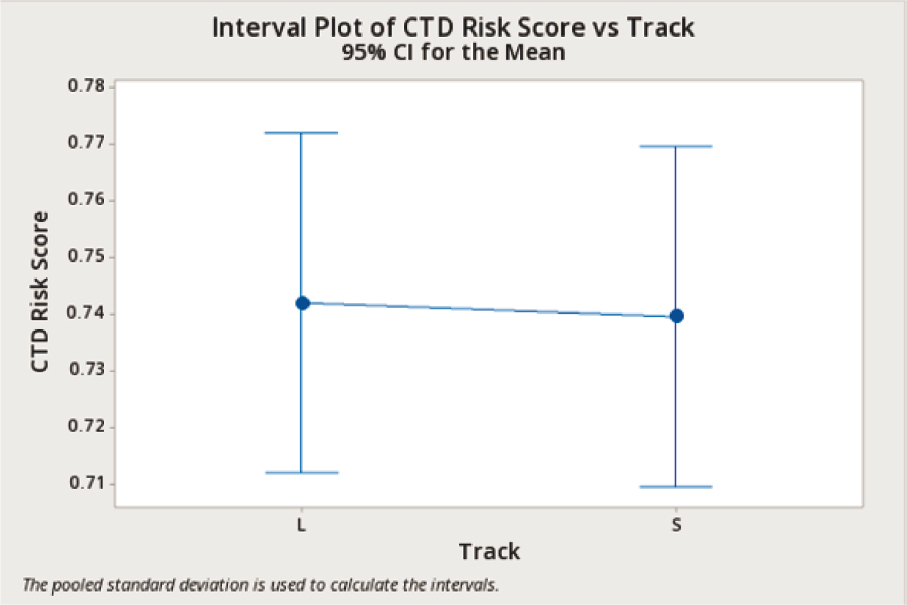
Table 3.3. Driving postures by category and the component ratios of each posture group.
 Low | 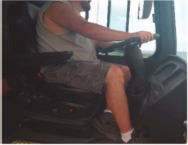 Average | 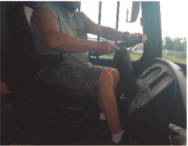 High | |
| Score A | 3 | 4 | 6 |
| Score B | 3 | 2 | 3 |
| Ground score | 3 | 4 | 5 |
| Component ratio | 88.3% | 10.2% | 1.50% |
Low posture occurred most frequently, with the low-posture group showing a RULA score of 3, indicating “low risk, changes may be applied.” The high-posture group received a RULA score of 5, indicating that this driving posture “needs further analysis and that change should be implemented soon.” There was no significant difference between tracks (p-value = 0.053) and no significant fatigue for 1 hour of driving (p-value = 0.165).
3.3.3 Strain Index
Figure 3.4 shows the individual value plot of the strain index. Most drivers scored between 3 and 7, indicating bus operation may place an individual at increased risk for distal upper extremity
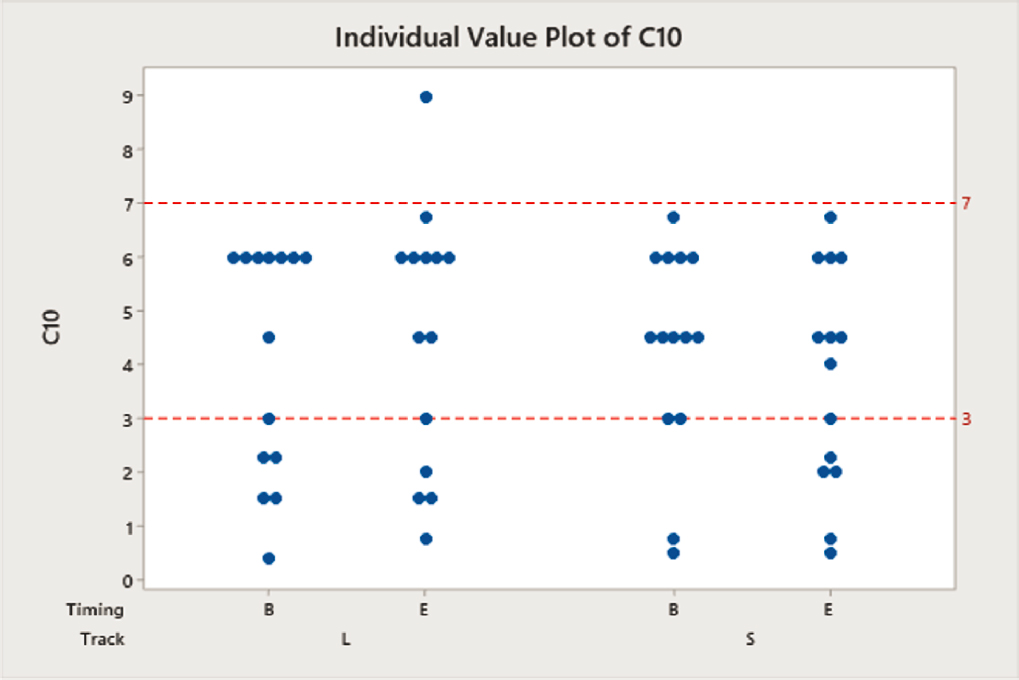
disorders; only one scored above 7, which implies bus operation is probably hazardous. Like the other results, strain index shows there was no significant difference between tracks (p-value = 0.637) and no significant fatigue for 1 hour of driving (p-value = 0.920).
3.3.4 Summary
Overall, the scores from the three evaluation tools showed that there may be some risk for CTDs for some drivers in terms of posture and movement during bus operation. Most of the drivers are in a low-risk state. One of the objectives of this research effort is to mitigate the risk for all drivers through improved bus workstation packaging.


